Phylogenetic Analysis of
Mycobacterium tuberculosis
Strains in
Wales by Use of Core Genome Multilocus Sequence Typing To
Analyze Whole-Genome Sequencing Data
R. C. Jones,aL. G. Harris,aS. Morgan,bM. C. Ruddy,cM. Perry,cR. Williams,cT. Humphrey,aM. Temple,bA. P. Daviesa,d
aSwansea University Medical School, Institute of Life Science, Swansea University, Swansea, Wales, United Kingdom
bHealth Protection Division (Mid and West Wales), Public Health Wales, Swansea, Wales, United Kingdom
cWales Centre for Mycobacteriology, Llandough Hospital, Cardiff, Wales, United Kingdom
dPublic Health Wales Microbiology, Swansea, Wales, United Kingdom
ABSTRACT An inability to standardize the bioinformatic data produced by whole-genome sequencing (WGS) has been a barrier to its widespread use in tuberculosis phylogenetics. The aim of this study was to carry out a phylogenetic analysis of tu-berculosis in Wales, United Kingdom, using Ridom SeqSphere software for core ge-nome multilocus sequence typing (cgMLST) analysis of whole-gege-nome sequencing data. The phylogenetics of tuberculosis in Wales have not previously been studied.
Sixty-six Mycobacterium tuberculosis isolates (including 42 outbreak-associated
iso-lates) from south Wales were sequenced using an Illumina platform. Isolates were assigned to principal genetic groups, single nucleotide polymorphism (SNP) cluster groups, lineages, and sublineages using SNP-calling protocols. WGS data were sub-mitted to the Ridom SeqSphere software for cgMLST analysis and analyzed along-side 179 previously lineage-defined isolates. The data set was dominated by the Euro-American lineage, with the sublineage composition being dominated by T, X, and Haarlem family strains. The cgMLST analysis successfully assigned 58 isolates to major lineages, and the results were consistent with those obtained by traditional SNP mapping methods. In addition, the cgMLST scheme was used to resolve an out-break of tuberculosis occurring in the region. This study supports the use of a cgMLST method for standardized phylogenetic assignment of tuberculosis isolates and for outbreak resolution and provides the first insight into Welsh tuberculosis phylogenetics, identifying the presence of the Haarlem sublineage commonly associ-ated with virulent traits.
KEYWORDS Mycobacterium tuberculosis, outbreak, phylogenetics, tuberculosis, whole-genome sequencing
W
ithin the speciesMycobacterium tuberculosis, seven major lineages have beenrecognized globally (1, 2), with these lineages showing different characteristics in terms of evolutionary status, transmissibility, drug resistance, host interaction, latency, and vaccine efficacy (3). The sublineages also show variations in virulence and patho-genicity (4): in particular, lineage 2 (East Asian) and lineage 4 (Euro-American) contain strains, such as the Beijing and Haarlem genotypes, respectively, which are notorious for their association with tuberculosis outbreaks and which are overrepresented among drug-resistant cases (5, 6).
Traditional PCR-based typing methods, such as mycobacterial interspersed repeti-tive unit–variable-number tandem-repeat (MIRU-VNTR) profiling and spoligotyping, have allowed the classification of isolates into phylogeographically related clades and families and led to the development of readily available databases, such as SpolDB4 (7,
CitationJones RC, Harris LG, Morgan S, Ruddy
MC, Perry M, Williams R, Humphrey T, Temple M, Davies AP. 2019. Phylogenetic analysis of Mycobacterium tuberculosisstrains in Wales by use of core genome multilocus sequence typing to analyze whole-genome sequencing data. J Clin Microbiol 57:e02025-18.https://doi .org/10.1128/JCM.02025-18.
EditorGeoffrey A. Land, Carter BloodCare &
Baylor University Medical Center
Copyright© 2019 American Society for
Microbiology.All Rights Reserved. Address correspondence to A. P. Davies, [email protected].
Received18 December 2018
Returned for modification30 January 2019
Accepted27 March 2019
Accepted manuscript posted online3 April
2019
Published
AEROBIC ACTINOMYCETES
crossm
on May 17, 2020 by guest
http://jcm.asm.org/
8) and MIRU-VNTRplus (9). Two other typing methods that have been developed with results correlating with internationally recognized spoligotype families are the principal genetic grouping (PGG) and single nucleotide polymorphism (SNP) cluster grouping (SCG) methods. The PGG method classifies isolates into one of three groups based on
nonsynonymous variants at thekatGandgyrAgenes (10). The SCG method classifies
isolates into six phylogenetically distinct groups and a further five subgroups based on the nucleotides present at nine specific loci in the H37Rv reference genome (11, 12).
With the advent of whole-genome sequencing (WGS), comparative analysis has led to the use of single nucleotide polymorphism (SNPs) as robust genetic markers for phylogenetic assignment (2, 7). SNPs are reliable and phylogenetically informative
markers, since the low sequence variation and lack of horizontal gene transfer inM.
tuberculosismake independent recurrent mutations unlikely (7). However, the lack of WGS data standardization has been one of the barriers to the widespread usage of WGS (13, 14). Coll et al. (15) developed a robust SNP barcode method that analyzes 60 loci
and that is capable of assigning M. tuberculosis isolates into major lineages and
sublineages. The method has a higher level of resolution than the PGG and SCG methods and provides phylogenetic associations that can be correlated with spoligo-type families, and the lineages assigned by the method can be compared with those in a globally established database (15). The development of WGS gene-by-gene multilo-cus sequence typing (MLST) methods and software, such as Ridom SeqSphere software (16), has resulted in a more standardized and user-friendly approach than traditional WGS SNP mapping for resolving and understanding outbreaks (14, 17, 18). Ridom SeqSphere allows isolate sequences to be aligned and compared in a standardized manner using a globally defined core genome MLST (cgMLST) scheme (13, 16, 18). To date, although this method has been used for providing a clinical resolution of tuberculosis outbreaks (13), it has not been used to analyze the phylogenetic
compo-sition of aM. tuberculosisisolate data set.
The phylogenetic diversity of strains ofM. tuberculosisin Wales has not previously
been studied. One aim of this work was to use for the first time the gene-by-gene-based core genome MLST (cgMLST) method, PGG, SCG, and SNP barcoding to
phylogeneti-cally analyze 66 Welsh M. tuberculosisisolates, assign them to phylogenetic groups,
lineages, and sublineages, and carry out a comparison of the different methods. Identifying the presence of strains such as Haarlem and Beijing family strains, which are associated with outbreaks and resistance, would be of interest to public health and outbreak control organizations in Wales, the United Kingdom, and further afield and give insight into the diversity of tuberculosis within Wales.
cgMLST was also used to study a set of isolates from one particular outbreak of tuberculosis in south Wales in detail. This outbreak came to the attention of Public Health Wales (PHW) in 2006. At that time the outbreak involved 8 cases with cultured isolates and appeared to be circulating among individuals who frequented five local public houses within an area, with one public house having connections to several cases in the outbreak. The index case was the landlord of that public house, and at the time of that diagnosis in 2004, contact tracing of close contacts and the pub’s regular customers was carried out promptly and detected no other cases. The outbreak sparked a review by Public Health Wales of tuberculosis case records in the area. From 2006 to 2011, a further 5 cases with clinical isolates were reported, making a total of 13 reported isolate-confirmed cases in the area since 2004. Two were an estranged husband and wife pair. All the isolates were fully susceptible to all first-line antituberculous chemo-therapy.
MATERIALS AND METHODS
Isolates.DNA from 66M. tuberculosisisolates collected between 2004 and 2011 was obtained from the Wales Centre for Mycobacteriology, Cardiff, United Kingdom. Forty-two of the isolates were from 3 separate tuberculosis outbreaks in the southwest area of Wales according to both MIRU-VNTR typing and epidemiological investigations (isolate prefixes are LL, NPT, TH, and GO), and the remaining 24 were randomly selected endemic (background) isolates (and given the prefix BK). Outbreak isolates prefixed
on May 17, 2020 by guest
http://jcm.asm.org/
NPT were those from one particular public house-related outbreak of tuberculosis which was studied in detail, as outlined in the introduction.
Epidemiological investigation.Epidemiological information was obtained from face-to-face inter-views with a nurse from the original PHW contact tracing investigation team and from documents produced during the outbreak investigation.
Sequencing and assembly.The genomic DNA was sequenced using Nextera XT library preparation kits (version 3; Illumina, San Diego, CA, USA) and a MiSeq benchtop sequencer (Illumina, San Diego, CA, USA), with paired-end reads being quality filtered with the Trimmomatic software tool (version 0.32; Usadellab, Germany) using a sliding-window approach of 5 bases and a quality score of Q20. The resulting contigs/genomes were assembled using the SPAdes genome assembler (version 3.9.0) (19). The k-mers used for SPAdes were 33, 55, 77.99, and 127. The sequence read archive (SRA) sequences for 179 lineage-defined isolates (NCBI) previously published (1) were also assembled using the SPAdes genome assembler.
cgMLST analysis and phylogenetic assignment.Assembled genomes were uploaded onto the Ridom SeqSphere software (version 4.1.9; Ridom; Münster, Germany). Each isolate sequence was aligned to the Ridom SeqSphere M. tuberculosis core genome MLST (cgMLST) scheme of 2,891 core genes (GenBank accession numberNC_000962.3), previously defined for alignment and subsequent genomic analysis (14, 18). Successful alignments to the cgMLST were defined as good targets by the Ridom SeqSphere software, and full cgMLST analysis was carried out on isolate sequences that conferred⬎90% good targets. The cgMLST scheme was also used to compare the sequenced Welsh isolates and 179 isolates whose lineage was previously defined by Comas et al. (1). The 179 isolates selected from Comas et al. (1) were those whose genomes also exceeded the 90% quality threshold under the Ridom SeqSphere parameters. The resulting phylogeny comparison was made using an unweighted pair group method with arithmetic mean (UPGMA) tree produced by Ridom SeqSphere and further annotated and modified using the iTol tool (version 4;https://itol.embl.de) (20). The genome ofMycobacterium canettii, as the ancestral member of theM. tuberculosiscomplex, was used to root the tree.
WGS SNP barcoding and sublineage genotyping.Isolates were aligned to the H37Rv reference genome using the Burrows-Wheeler alignment (BWA; version 0.7.17) (21). The SAMtools program suite (version 1.3.1) (22) was then used to call SNPs from each of 60 designated loci previously described (15) (with the omission of 2M. bovisloci). Thus, the isolates based on the SNP pattern (SNP barcode) at the designated loci were split into one of the phylogeographically related groups: lineage 1 (Indo-Oceanic), lineage 2 (East Asian), lineage 3 (East African-Indian), lineage 4 (Euro-American), lineage 5 (West Africa 1), lineage 6 (West Africa 2), or lineage 7 (Horn of Africa) (7, 15).
EachM. tuberculosislineage determined by SNP mapping was also divided into one of the following sublineages: the Beijing (23), Latin American Mediterranean (LAM) (24), Haarlem (25), or X family (24). SNPs were initially identified through extraction of relevant gene sequences from each isolate using the sequence extraction application within Ridom SeqSphere and detected manually using BioEdit software. Concatenated SNPs were then used to produce a phylogenetic UPGMA tree using iTol software, and isolates were assigned to one of the sublineage genotypes listed above.
PGG and SCG.Gene sequences forgyrAandkatGwere extracted from the WGS of each isolate using Ridom SeqSphere and analyzed manually using BioEdit to identify the presence of principal genetic grouping (PGG)-defining amino acids at codons 95 and 493, the PGG informative sites within the genes
gyrAandkatG(10). Based on the composition of amino acids at these loci, each isolate was assigned to a PGG (26). For SNP cluster grouping (SCG) analysis, sequences were aligned to the H37Rv reference genome using BWA. SAMtools was then used to call SNPs from the previously defined nine specific loci (12), and each isolate then assigned to an SNP cluster group. Phylogenetic analysis was carried out only on isolates with each of the nine loci present (31 isolates).
RESULTS
N50and the number of contigs for each assembled genome are shown in Table S1
in the supplemental material.
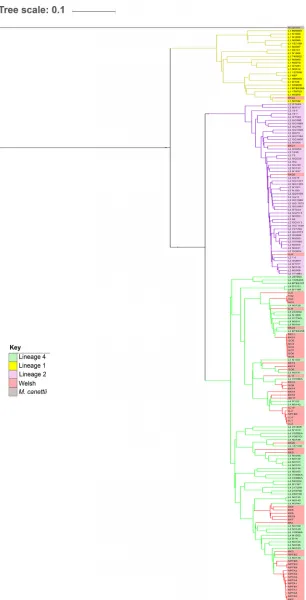
cgMLST association.Fifty-eight of the 66 isolates had a sequence quality sufficient for cgMLST analysis and were incorporated into a phylogeny that also included the 179 defined isolates (1). The resulting tree shows that the Welsh and
lineage-defined isolates clustered into lineages 1 (n⫽1), 2 (n⫽3), and 4 (n⫽53) (Fig. 1).
Lineages 3, 5, 6 and 7 are not shown, as none of the Welsh isolates were assigned to them. All but one outbreak-associated isolate (isolate LL9) clustered with the lineage 4 isolates, while the endemic isolates showed more lineage diversity.
Phylogenetic composition using SNP barcoding and sublineage genotyping.
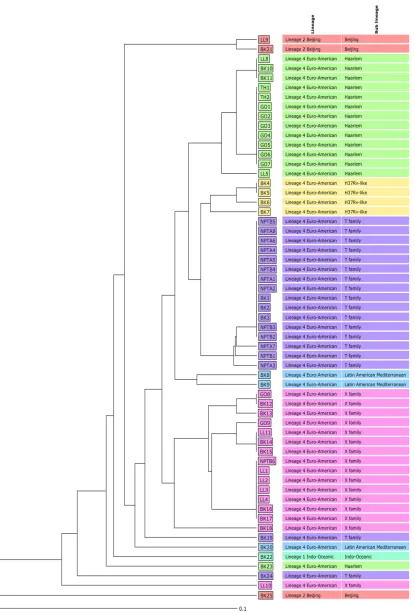
SNP barcoding was carried out on the 59 Welsh isolates that had⬎90% sequence data,
as required for the 60-locus SNP barcode analysis. The results were consistent with those from the cgMLST association. Lineage 4 (Euro-American) dominated the data set with 55 isolates (Fig. 2), and all but 1 outbreak-associated isolate clustered with this lineage. Fourteen of the 55 lineage 4 isolates were of the Haarlem sublineage, and of the 18 T family isolates, 13 showed a clonal pattern across the 60 SNPs, with 10 of these being from the same recognized outbreak. Twelve of the 16 X family isolates could be
on May 17, 2020 by guest
http://jcm.asm.org/
FIG 1An unweighted pair group method with arithmetic mean (UPGMA) tree based on the cgMLST association between 58 Welsh isolates. The UPGMA tree shows the phylogeny of the 58 Welsh isolates and the lineage-defined isolates (1) which had a sequence quality sufficient for cgMLST analysis. TheM. canettiigenome was used to root the tree. Lineages 3, 5, 6, and 7 are not shown, as none of the Welsh isolates were assigned to them. Green, lineage 1; yellow, lineage 2; pink, lineage 4; red, Welsh isolates; gray,M. canettii.
on May 17, 2020 by guest
http://jcm.asm.org/
[image:4.585.55.361.68.668.2]FIG 2Phylogenetic analysis of 59 WelshM. tuberculosisisolates. The figure shows the 59 isolates that had⬎90% sequence data (as required for the 60-locus SNP barcode analysis) assigning the isolates to lineages and sublineages. Unweighted pair group method with arithmetic mean (UPGMA) tree showing SNP barcoding results. The scale bar indicates the genetic divergence relevant to branch length and is based on units of the number of nucleotide differences per site across 60 loci.
on May 17, 2020 by guest
http://jcm.asm.org/
[image:5.585.44.459.69.684.2]split into three clonally related clusters correlating to those seen in Fig. 2, and 3 lineage 2 Beijing strains were identified. The T family sublineage dominated the outbreak isolates (39%), followed by the Haarlem sublineage (33%) and the X family (27%). Table 1 shows a direct comparison between the cgMLST and SNP results, indicating a correlation at the lineage level for each Welsh isolate.
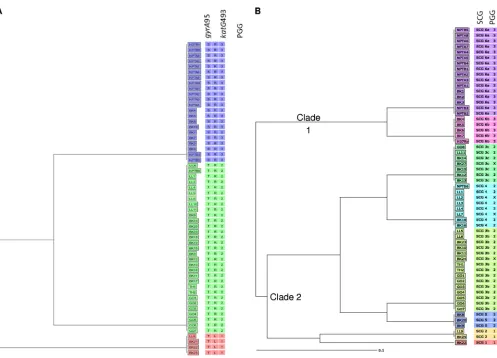
PGG and SCG analysis.Of the 66 isolates sequenced, 57 could be assigned to a PGG based on sequence data, as shown in Fig. 3A. Four isolates clustered within PGG1, 31 clustered within PGG2, and 22 clustered within PGG3, along with the H37Rv genome. Compared to the sublineage data, the Haarlem and X family and LAM sublineage isolates grouped with PGG2 and the T family and H37Rv-like isolates grouped with PGG3. All lineage 1 and 2 isolates were associated with PGG1. Fifty-six of the original 66 isolates could confidently be assigned to an SCG based on the sequence data provided. The SCG results identified two predominant SCGs, SCG-6a and SCG-3b, with 16 and 15 isolates clustering to these subgroups, respectively (Fig. 3B). Other subgroups present were SCG-4 (8 isolates), SCG-3c (7 isolates), SCG-6b (4 isolates), SCG-5 (3 isolates), SCG-2 (2 isolates), and SCG-1 (1 isolate). Nine isolates were excluded, as they did not yield sequence data for all nine loci, and SCG-3a was not represented in the data set. The SCG phylogeny split into two clear clades, with clade 2 being more diverse than clade 1. When PGG results were compared with SCG results, it was found that clade 1 contained all the PGG3 isolates and clade 2 contained all PGG1 and PGG2 isolates (Fig. 3B). The PGG2 isolates also divided into four different SCG groups. Within clade 2, isolates of SCG-3c and SCG-4 shared a closer relationship with each other than they did with isolates of SCG-3b and SCG-5, and vice versa.
NPT outbreak isolate analysis.All the NPT-designated outbreak isolates clustered as Euro-American T family isolates, except for NPTB6 (Fig. 2). In addition, a further 3 three background isolates (BK1, BK2, and BK3) also clustered clonally as T family isolates and were included in further downstream analysis (Fig. 2). NPTB6 did not cluster within the same T family sublineage but clustered with 6 X family sublineage isolates. This was evidence that NPTB6 had been wrongly included within this outbreak cluster and was unrelated. For further outbreak analysis, the 3 additional T family background cases were included with the NPT isolates when analyzed by cgMLST.
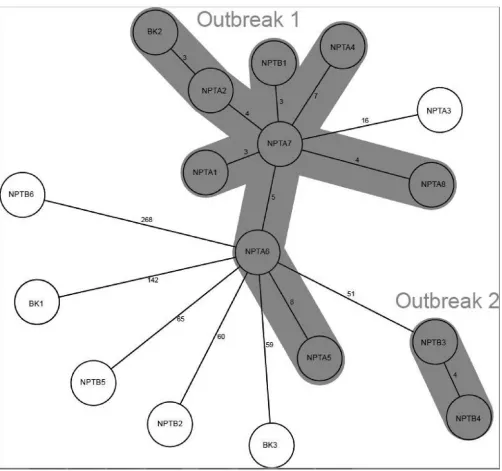
cgMLST analysis revealed that there were in fact 8 distinct isolates within the T family group, including the existence of 2 clusters (Fig. 4). The clusters defined by cgMLST consisted of one containing 9 isolates (outbreak 1) and one containing 2 isolates (outbreak 2, consisting of the isolates from the estranged husband and wife). In outbreak 1 there were 8 NPT isolates and 1 background isolate, previously thought of as an unrelated case. NPTA3 showed 16 allelic differences from its closest relative (NPTA7) and, thus, according to the definition of no more than 12 allelic differences (13, 14), could not be directly linked to either outbreak. Five other isolates showed no evidence of being directly linked with any other isolate within the data set: these included three NPT isolates (NPTB2, NPTB5, and NPTB6) and two background ones (BK1 and BK3). The data indicated that NPTA7 was the source case. This case, diagnosed with pulmonary tuberculosis in 2007, was known to a number of the other cases as a regular at the public house, although he denied this. The cgMLST results supported the epidemiological evidence that he was associated with the public house.
DISCUSSION
This study has provided the first insight into the phylogenetic diversity of M.
tuberculosis isolates from Wales using cgMLST. In addition, it is one of the first independent confirmatory studies of the cgMLST scheme of Kohl et al. (13). Gene-by-gene MLST methods have previously been shown to be useful in clinical outbreak resolution and epidemiological investigations of human pathogens, such as
methicillin-resistantStaphylococcus aureusandCampylobacter, as well asM. tuberculosisitself (17,
18). Specifically, the Ridom SeqSphere gene-by-gene cgMLST scheme has previously been used to look at tuberculosis outbreaks (13, 18) and consists of a portable, standardized database platform for use with WGS data in tuberculosis research.
on May 17, 2020 by guest
http://jcm.asm.org/
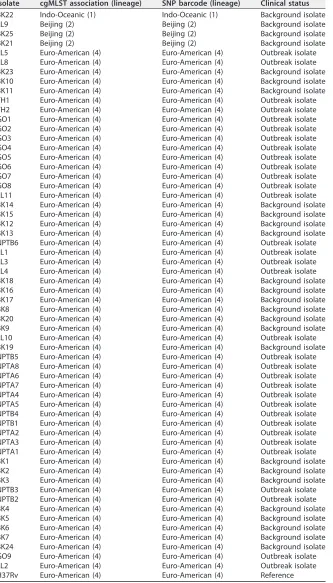
TABLE 1Lineaged, by cgMLST and SNP analysis, of 58 sequenced isolates that had sequence quality sufficient for cgMLST analysis, showing the correlation of both methods at the lineage level for each Welsh isolate
Isolate cgMLST association (lineage) SNP barcode (lineage) Clinical status
BK22 Indo-Oceanic (1) Indo-Oceanic (1) Background isolate LL9 Beijing (2) Beijing (2) Background isolate BK25 Beijing (2) Beijing (2) Background isolate BK21 Beijing (2) Beijing (2) Background isolate LL5 Euro-American (4) Euro-American (4) Outbreak isolate LL8 Euro-American (4) Euro-American (4) Outbreak isolate BK23 Euro-American (4) Euro-American (4) Background isolate BK10 Euro-American (4) Euro-American (4) Background isolate BK11 Euro-American (4) Euro-American (4) Background isolate TH1 Euro-American (4) Euro-American (4) Outbreak isolate TH2 Euro-American (4) Euro-American (4) Outbreak isolate GO1 Euro-American (4) Euro-American (4) Outbreak isolate GO2 Euro-American (4) Euro-American (4) Outbreak isolate GO3 Euro-American (4) Euro-American (4) Outbreak isolate GO4 Euro-American (4) Euro-American (4) Outbreak isolate GO5 Euro-American (4) Euro-American (4) Outbreak isolate GO6 Euro-American (4) Euro-American (4) Outbreak isolate GO7 Euro-American (4) Euro-American (4) Outbreak isolate GO8 Euro-American (4) Euro-American (4) Outbreak isolate LL11 Euro-American (4) Euro-American (4) Outbreak isolate BK14 Euro-American (4) Euro-American (4) Background isolate BK15 Euro-American (4) Euro-American (4) Background isolate BK12 Euro-American (4) Euro-American (4) Background isolate BK13 Euro-American (4) Euro-American (4) Background isolate NPTB6 Euro-American (4) Euro-American (4) Outbreak isolate LL1 Euro-American (4) Euro-American (4) Outbreak isolate LL3 Euro-American (4) Euro-American (4) Outbreak isolate LL4 Euro-American (4) Euro-American (4) Outbreak isolate BK18 Euro-American (4) Euro-American (4) Background isolate BK16 Euro-American (4) Euro-American (4) Background isolate BK17 Euro-American (4) Euro-American (4) Background isolate BK8 Euro-American (4) Euro-American (4) Background isolate BK20 Euro-American (4) Euro-American (4) Background isolate BK9 Euro-American (4) Euro-American (4) Background isolate LL10 Euro-American (4) Euro-American (4) Outbreak isolate BK19 Euro-American (4) Euro-American (4) Background isolate NPTB5 Euro-American (4) Euro-American (4) Outbreak isolate NPTA8 Euro-American (4) Euro-American (4) Outbreak isolate NPTA6 Euro-American (4) Euro-American (4) Outbreak isolate NPTA7 Euro-American (4) Euro-American (4) Outbreak isolate NPTA4 Euro-American (4) Euro-American (4) Outbreak isolate NPTA5 Euro-American (4) Euro-American (4) Outbreak isolate NPTB4 Euro-American (4) Euro-American (4) Outbreak isolate NPTB1 Euro-American (4) Euro-American (4) Outbreak isolate NPTA2 Euro-American (4) Euro-American (4) Outbreak isolate NPTA3 Euro-American (4) Euro-American (4) Outbreak isolate NPTA1 Euro-American (4) Euro-American (4) Outbreak isolate BK1 Euro-American (4) Euro-American (4) Background isolate BK2 Euro-American (4) Euro-American (4) Background isolate BK3 Euro-American (4) Euro-American (4) Background isolate NPTB3 Euro-American (4) Euro-American (4) Outbreak isolate NPTB2 Euro-American (4) Euro-American (4) Outbreak isolate BK4 Euro-American (4) Euro-American (4) Background isolate BK5 Euro-American (4) Euro-American (4) Background isolate BK6 Euro-American (4) Euro-American (4) Background isolate BK7 Euro-American (4) Euro-American (4) Background isolate BK24 Euro-American (4) Euro-American (4) Background isolate GO9 Euro-American (4) Euro-American (4) Outbreak isolate LL2 Euro-American (4) Euro-American (4) Outbreak isolate H37Rv Euro-American (4) Euro-American (4) Reference
on May 17, 2020 by guest
http://jcm.asm.org/
ever, the method has not previously been used for the classification ofM. tuberculosis
isolates into well-defined phylogenetic lineages. This study provided for the first time a snapshot of tuberculosis phylogenetics across a geographical area based on cgMLST in comparison with the phylogenetics based on SNP calling methods. In this study, the
resulting cgMLST phylogenetic tree contained all seven majorM. tuberculosis
sublin-eages and broadly matched that seen using SNP mapping-based methods (1, 27). Of the 66 isolates for which WGS was performed, 58 were successfully analyzed by cgMLST in conjunction with 179 lineage-defined isolates (1), with lineage 4, the Euro-American lineage, dominating the collection. Lineage 1 and 2 isolates were also identified, but in much lower numbers. Consistent with the findings of Comas et al. (1), lineage 2 and 3 isolates shared a closer relationship with each other than with lineage 4 isolates. Hence, despite the use of a different set of genomic data, the evolutionary positions of each lineage according to cgMLST were consistent with those found in other studies that used in-house SNP mapping pipelines for the construction of their phylogenies (1, 27, 28).
According to the SNP barcoding and subgenotyping methods, the results of which correlated with the cgMLST results, the data set contained a diverse collec-tion of Euro-American sublineages, which were not dominated by a single sublin-eage, as isolates of the T family, X family, and Haarlem family made up a large proportion of the lineage 4 data set, with the Haarlem isolates being particularly
FIG 3Neighbor-joining phylogeny showing the principal genetic grouping and single nucleotide polymorphism cluster grouping profiles of 57 and 56 Welsh isolates, respectively, with the reference genome H37Rv also being assigned. (A) PGG results. Red, PGG1; green, PGG2; blue, PGG3. Letters refer to the amino acids present at each locus: T, threonine; R, arginine; L, leucine; and S, serine. The scale bar highlights the genetic divergence relevant to the branch length and is based on units of the number of amino acid differences per site across thegyrAandkatGloci. (B) SCG results, where the phylogeny harbors two clades, clade 1 and clade 2. The PGG assigned to each isolate is shown in the right column, and X denotes isolates that could not be assigned a PGG group.
on May 17, 2020 by guest
http://jcm.asm.org/
[image:8.585.46.543.66.424.2]prevalent in the outbreak-assigned cases. The proportion of Euro-American lineage isolates here is similar to Public Health England data for TB cases in indigenous people across the whole of the United Kingdom and Ireland (29). This study also identified 2% of the isolates to be lineage 1 and 6% to be lineage 2, again correlating with the data for the indigenous population of the United Kingdom (29) and Ireland (30, 31). The discovery of numerous Haarlem sublineage strains and some Beijing strains was an interesting finding.
The PGG results correlated well with the lineage groupings, as 31 of the Welsh isolates were PGG2 or PGG3, which have previously been associated with the Euro-American lineage, while PGG1 is associated with lineages 1, 2, and 3 (7). The SCG results revealed a predominance of SCG-3 and SCG-6 isolates, with SCG-3b and SCG-6a isolates being the most prominent. Unlike for PGG analysis, the SCG analysis highlighted a large degree of divergence within the Euro-American lineage, consistent with the diversity
FIG 4A minimum-spanning tree of 17 cases constructed using Ridom SeqSphere software. Isolates sharing less than 12 allelic differences are classified as direct transmission events and are thus part of a clonal outbreak and are grouped accordingly into outbreak 1 and outbreak 2.
on May 17, 2020 by guest
http://jcm.asm.org/
[image:9.585.43.545.68.539.2]seen in the SNP barcode result. Such an association was expected, as SCGs have previously been shown to assign themselves with the SNP barcoding and sublineage groupings (7, 11).
Phylogenetic analysis confirmed that all the apparent NPT outbreak isolates except NPTB6 were clustered within the same sublineage, the Euro-American T family. In addition, the SNP barcode method identified three further apparently unrelated local isolates that clustered within this phylogeny, indicating that phylogenetic character-ization may be useful in tuberculosis outbreak investigation.
Through the use of cgMLST, the relationship between the NPT outbreak isolates was resolved, and two clusters/outbreaks were confirmed. The cgMLST analysis also con-firmed that the cases in outbreak 1 were directly linked to the public house, as assumed by the initial contact tracing team. However, a number of cases, including the es-tranged husband and wife pair, were unrelated, serving as a reminder that TB remains endemic in Wales and that cases occurring within a small area are not necessarily related. Such results could be used as a basis to support targeted outbreak control interventions around the public house and the identification of NPTA7 (who denied frequenting the public house, contradicting the evidence provided by other cases) as the source case.
SNP barcoding provides a very high level of resolution, is more established in terms of providing sublineage assignments, and provides a correlation with spoligotyping. However, it requires bioinformatic expertise and is difficult to standardize, as it is not linked to a global database. In addition, the SNP barcode used here is based solely on a set of markers (15) and so cannot provide an understanding of individual relation-ships within an outbreak, restricting its use to phylogenetics.
In comparison, cgMLST is a relatively new method. However, it has the advantage of being a simpler, standardized method for analyzing large amounts of genomic data which are easily uploaded to a global database for analysis using the user-friendly Ridom SeqSphere software, which could facilitate the use of genomics for tuberculosis surveillance. The results of cgMLST analysis were consistent with those obtained by traditional SNP mapping methods. Although cgMLST is yet to be developed to a level whereby isolates can be confidently assigned to a phylogenetic sublineage, this study provides evidence that, at least at the lineage level, the phylogenetic associations made using cgMLST correlate with those made using SNP barcoding. This work supports the
use of cgMLST for standardized phylogenetic assignment ofM. tuberculosisisolates, in
addition to its use for delineating clinical outbreaks (13, 18).
SUPPLEMENTAL MATERIAL
Supplemental material for this article may be found athttps://doi.org/10.1128/JCM
.02025-18.
SUPPLEMENTAL FILE 1, XLSX file, 0.01 MB.
ACKNOWLEDGMENTS
This work was funded by the St. David’s Medical Foundation and Coleg Cenedla-ethol Cymraeg funding.
The funders had no role in study design, data collection and interpretation, or the decision to submit the work for publication.
REFERENCES
1. Comas I, Coscolla M, Luo T, Borrell S, Holt KE, Kato-Maeda M, Parkhill J, Malla B, Berg S, Thwaites G, Yeboah-Manu D, Bothamley G, Mei J, Wei L, Bentley S, Harris SR, Niemann S, Diel R, Aseffa A, Gao Q, Young D, Gagneux S. 2013. Out-of-Africa migration and Neolithic co expansion of
Mycobacterium tuberculosis with modern humans. Nat Genet 45: 1176 –1182.https://doi.org/10.1038/ng.2744.
2. Gagneux S, Deriemer K, Van T, Kato-Maeda M, De Jong BC, Narayanan S, Nicol M, Niemann S, Kremer K, Gutierrez MC, Hilty M, Hopewell PC, Small PM. 2006. Variable host-pathogen compatibility inMycobacterium
tuber-culosis. Proc Natl Acad Sci U S A 103:2869 –2873.https://doi.org/10.1073/ pnas.0511240103.
3. Thwaites G, Caws M, Chau TTH, D’Sa A, Lan NTN, Huyen MNT, Gagneux S, Anh PTH, Tho DQ, Torok E, Nhu NTQ, Duyen NTH, Duy PM, Richenberg J, Simmons C, Hien TT, Farrar J. 2008. Relationship betweenMycobacterium tuberculosisgenotype and the clinical phenotype of pulmonary and men-ingeal tuberculosis. J Clin Microbiol 46:1363–1368.https://doi.org/10.1128/ JCM.02180-07.
4. Anderson J, Jarlsberg LG, Grindsdale J, Osmond D, Kawamura M,
on May 17, 2020 by guest
http://jcm.asm.org/
Hopewell PC, Kato-Maeda M. 2013. Sublineages of lineage 4 (Euro-American)Mycobacterium tuberculosisdiffer in genotypic clustering. Int J Tuberc Lung Dis 17:885– 891.https://doi.org/10.5588/ijtld.12.0960. 5. Marais BJ, Victor TC, Hesseling AC, Barnard M, Jordaan A, Brittle W,
Reuter H, Beyers N, van Helden PD, Warren RM, Schaaf HS. 2006. Beijing and Haarlem genotypes are overrepresented among children with drug-resistant tuberculosis in the Western Cape Province of South Africa. J Clin Microbiol 44:3539 –3543.https://doi.org/10.1128/JCM.01291-06. 6. Bifani PJ, Plikaytis BB, Kapur V, Stockbauer K, Pan X, Lutfey ML,
Moghazeh SL, Eisner W, Daniel TM, Kaplan MH, Crawford JT, Musser JM, Kreiswirth BN. 1996. Origin and interstate spread of a New York City multidrug-resistantMycobacterium tuberculosisclone family. JAMA 275: 452– 457.https://doi.org/10.1001/jama.1996.03530300036037. 7. Gagneux S, Small PM. 2007. Global phylogeography ofMycobacterium
tuberculosisand implications for tuberculosis product development. Lancet Infect Dis 7:328 –337.https://doi.org/10.1016/S1473-3099(07)70108-1. 8. Brudey K, Driscoll JR, Rigouts L, Prodinger WM, Gori A, Al-Hajoj SA, Allix C,
Aristimuño L, Arora J, Baumanis V, Binder L, Cafrune P, Cataldi A, Cheong S, Diel R, Ellermeier C, Evans JT, Fauville-Dufaux M, Ferdinand S, de Viedma D, Garzelli C, Gazzola L, Gomes HM, Guttierez MC, Hawkey PM, van Helden PD, Kadival GV, Kreiswirth BN, Kremer K, Kubin M, Kulkarni SP, Liens B, Lillebaek T, Ly H, Martin C, Martin C, Mokrousov I, Narvskaïa O, Ngeow Y, Naumann L, Niemann S, Parwati I, Rahim Z, Rasolofo-Razanamparany V, Ra-solonavalona T, Rossetti ML, Rüsch-Gerdes S, Sajduda A, Samper S, Shem-yakin IG, et al. 2006.Mycobacterium tuberculosiscomplex genetic diversity: mining the Fourth International Spoligotyping Database (SpolDB4) for clas-sification, population genetics and epidemiology. BMC Microbiol 6:23.
https://doi.org/10.1186/1471-2180-6-23.
9. Weniger T, Krawczyk J, Supply P, Niemann S, Harmsen D. 2010. MIRU-VNTRplus: a web tool for polyphasic genotyping of Mycobacterium tuberculosiscomplex bacteria. Nucleic Acids Res 38:W326 –W331.https:// doi.org/10.1093/nar/gkq351.
10. Sreevatsan S, Pan X, Stockbauer KE, Connell ND, Kreiswirth BN, Whittam TS, Musser JM. 1997. Restricted structural gene polymorphism in the
Mycobacterium tuberculosis complex indicates evolutionarily recent global dissemination. Proc Natl Acad Sci U S A 94:9869 –9874.https:// doi.org/10.1073/pnas.94.18.9869.
11. Filliol I, Motiwala AS, Cavatore M, Qi W, Hazbon MH, Bobadilla Del Valle M, Fyfe J, García-García L, Rastogi N, Sola C, Zozio T, Guerrero MI, León CI, Crabtree J, Angiuoli S, Eisenach KD, Durmaz R, Joloba ML, Rendón A, Sifuentes-Osornio J, Ponce de León A, Cave MD, Fleischmann R, Whittam TS, Alland D. 2006. Global phylogeny of Mycobacterium tuberculosis
based on single nucleotide polymorphism (SNP) analysis: insights into tuberculosis evolution, phylogenetic accuracy of other DNA fingerprint-ing systems, and recommendations for a minimal standard SNP set. J Bacteriol 188:759 –772.https://doi.org/10.1128/JB.188.2.759-772.2006. 12. Alland D, Lacher DW, Hazbon MH, Motiwala AS, Qi W, Fleischmann RD,
Whittam TS. 2007. Role of large sequence polymorphisms (LSPs) in generating genomic diversity among clinical isolates ofMycobacterium tuberculosis and the utility of LSPs in phylogenetic analysis. J Clin Microbiol 45:39 – 46.https://doi.org/10.1128/JCM.02483-05.
13. Kohl TA, Diel R, Harmsen D, Rothganger J, Walter KM, Merker M, Weniger T, Niemann S. 2014. Whole-genome-based Mycobacterium tuberculosis surveillance: a standardized, portable, and expandable approach. J Clin Microbiol 52:2479 –2486.https://doi.org/10.1128/JCM.00567-14. 14. Walker TM, Ip CLC, Harrell RH, Evans JT, Kapatai G, Dedicoat MJ, Eyre DW,
Wilson DJ, Hawkey PM, Crook DW, Parkhill J, Harris D, Walker AS, Bowden R, Monk P, Smith EG, Peto TE. 2013. Whole-genome sequencing to delineateMycobacterium tuberculosisoutbreaks: a retrospective ob-servational study. Lancet Infect Dis 13:137–146.https://doi.org/10.1016/ S1473-3099(12)70277-3.
15. Coll F, McNerney R, Guerra-Assuncao JA, Glynn JR, Perdigao J, Viveiros M, Portugal I, Pain A, Martin N, Clark TG. 2014. A robust SNP barcode for typingMycobacterium tuberculosiscomplex strains. Nat Commun 5:4812.
https://doi.org/10.1038/ncomms5812.
16. Junemann S, Sedlazeck FJ, Prior K, Albersmeier A, John U, Kalinowski J,
Mellmann A, Goesmann A, von Haeseler A, Stoye J, Harmsen D. 2013. Updating benchtop sequencing performance comparison. Nat Biotech-nol 31:294 –296.https://doi.org/10.1038/nbt.2522.
17. Maiden MC, Van Rensburg MJJ, Bray JE, Earle SG, Ford SA, Jolley KA, McCarthy ND. 2013. MLST revisited: the gene-by-gene approach to bacte-rial genomics. Nat Rev Microbiol 11:728 –736. https://doi.org/10.1038/ nrmicro3093.
18. Kohl TA, Harmsen D, Rothganger J, Walker T, Diel R, Niemann S. 2018. Harmonised genome wide typing of tubercle bacilli using a web-based gene-by-gene nomenclature system. EBioMedicine 34:131–138.https:// doi.org/10.1016/j.ebiom.2018.07.030.
19. Bankevich A, Nurk S, Antipov D, Gurevich AA, Dvorkin M, Kulikov AS, Lesin VM, Nikolenko SI, Pham S, Prjibelski AD, Pyshkin AV, Sirotkin AV, Vyahhi N, Tesler G, Alekseyev MA, Pevzner PA. 2012. SPAdes: a new genome assembly algorithm and its applications to single-cell sequenc-ing. J Comput Biol 19:455– 477.https://doi.org/10.1089/cmb.2012.0021. 20. Letunic I, Bork P. 2016. Interactive tree of life (iTOL) v3: an online tool for the display and annotation of phylogenetic and other trees. Nucleic Acids Res 44:W242–W245.https://doi.org/10.1093/nar/gkw290. 21. Li H, Durbin R. 2009. Fast and accurate short read alignment with
Burrows-Wheeler transform. Bioinformatics 25:1754 –1760. https://doi .org/10.1093/bioinformatics/btp324.
22. Li H, Handsaker B, Wysoker A, Fennell T, Ruan J, Homer N, Marth G, Abecasis G, Durbin R, 1000 Genome Project Data Processing Subgroup. 2009. The sequence alignment/map (SAM) format and SAMtools. Bioin-formatics 25:2078 –2079.https://doi.org/10.1093/bioinformatics/btp352. 23. Mestre O, Luo T, Dos Vultos T, Kremer K, Murray A, Namouchi A, Jackson C, Rauzier J, Bifani P, Warren R, Rasolofo V, Mei J, Gao Q, Gicquel B. 2011. Phylogeny ofMycobacterium tuberculosis Beijing strains constructed from polymorphisms in genes involved in DNA replication, recombina-tion and repair. PLoS One 6:e16020. https://doi.org/10.1371/journal .pone.0016020.
24. Comas I, Homolka S, Niemann S, Gagneux S. 2009. Genotyping of genetically monomorphic bacteria: DNA sequencing inMycobacterium tuberculosishighlights the limitations of current methodologies. PLoS One 4:e7815.https://doi.org/10.1371/journal.pone.0007815.
25. Cubillos-Ruiz A, Sandoval A, Ritacco V, Lopez B, Robledo J, Correa N, Hernandez-Neuta I, Zambrano MM, Del Portillo P. 2010. Genomic signatures of the Haarlem lineage ofMycobacterium tuberculosis: implications of strain genetic variation in drug and vaccine development. J Clin Microbiol 48: 3614 –3623.https://doi.org/10.1128/JCM.00157-10.
26. Grimes CZ, Teeter LD, Hwang L-Y, Graviss EA. 2009. Epidemiologic charac-terization of culture positiveMycobacterium tuberculosispatients by katG-gyrAprincipal genetic grouping. J Mol Diagn 11:472– 481.https://doi.org/ 10.2353/jmoldx.2009.080171.
27. Gagneux S. 2012. Host–pathogen coevolution in human tuberculosis. Philos Trans R Soc Lond B Biol Sci 367:850 – 859.https://doi.org/10.1098/ rstb.2011.0316.
28. Firdessa R, Berg S, Hailu E, Schelling E, Gumi B, Erenso G, Gadisa E, Kiros T, Habtamu M, Hussein J, Zinsstag J, Robertson BD, Ameni G, Lohan AJ, Loftus B, Comas I, Gagneux S, Tschopp R, Yamuah L, Hewinson G, Gordon SV, Young DB, Aseffa A. 2013. Mycobacterial lineages causing pulmonary and extrapulmonary tuberculosis, Ethiopia. Emerg Infect Dis 19:460 – 463.https://doi.org/10.3201/eid1903.120256.
29. Public Health England. 2014. Tuberculosis in the UK 2014 report. Public Health England, London, United Kingdom.
30. Fitzgibbon M, Gibbons N, Roycroft E, Jackson S, O’Donnell J, O’Flanagan D, Rogers TR. 2013. A snapshot of genetic lineages ofMycobacterium tuberculosisin Ireland over a two-year period, 2010 and 2011. Euro Surveill 8(3):pii⫽20367.https://www.eurosurveillance.org/content/10.2807/ ese.18.03.20367-en.
31. Ojo OO, Sheehan S, Corcoran DG, Nikolayevsky V, Brown T, O’Sullivan M, O’Sullivan K, Gordon SV, Drobniewski F, Prentice MB. 2010. Molecular epidemiology ofMycobacterium tuberculosisclinical isolates in South-west Ireland. Infect Genet Evol 10:1110 –1116.https://doi.org/10.1016/j .meegid.2010.07.008.