Sensor and Microcontroller based Urban Crisis
Management
Samruddhi Rao
B.E Electronics and Telecommunication S.I.E.S Graduate School of Technology
Nerul, Navi Mumbai
Rohith Prabhu
B.E Electronics and Telecommunication S.I.E.S Graduate School of Technology
Nerul, Navi Mumbai
Harshad Lodiwale
B.E Electronics and Telecommunication S.I.E.S Graduate School of Technology
Nerul, Navi Mumbai
Neha Kundri
B.E Electronics and Telecommunication S.I.E.S Graduate School of Technology
Nerul, Navi Mumbai
ABSTRACT
Urbanization brings with it several consequences, both adverse and beneficial. Traffic congestion and urban flooding are two menacing problems of urbanization. This paper proposes an efficient solution to determine not just the traffic density but the nature of traffic flow and also the flood water level in case of an emergency situation. It also provides a solution to drain the flood water with no on site human intervention required. In comparison to conventional techniques the proposed system is a cost effective alternative, thus perfectly suitable for implementation in developing countries.
Keywords
Traffic congestion, urban flooding, urban crisis management, traffic flow sensor, flood sensor, Zigbee, Visual Basic 6.0
1.
INTRODUCTION
With the advent of industrial revolution 200 years ago, there has been a dramatic increase in urban growth, also known as Urbanization. The passage of time has further accelerated this growth and today the speed and scale of expansion of cities is unprecedented. In USA 5% of the population lived in cities in 1800. By 1920 50% of the population lived in cities. In comparison only 17.8% of population of Third world societies lived in cities in 1950. But by 2000, the percentage had increased to 40% and by 2030, the percentage is predicted to increase to 60%.[CES, IISC]. As cities are beckoning people from across the world, it has also caused several serious problems of which Traffic congestion and Urban Flooding are grave issues. Traffic congestion has today become an issue of global concern resulting in problems such as travel time delay, increase of traffic accidents, rise of fuel depletion, survival environmental degradation and so on. It severely affects the city’s normal function and its sustainable development [1]. The excess fuel consumption and time wasted in traffic, Congestion leads to annual economic burdens ranging from $83 billion to $124 billion [2].
Another major issue is urban flooding. It is a result of human encroachment on farmlands, woodlands etc thereby reducing the surface area available for water infiltration into the soils, resulting in rapid runoff. Thus urban flooding occurs very quickly, has greater peaks from 1.8 to 8 times and increased volumes by up to 6 times. The gravity and widespread nature
of the above mentioned problems probes us for an effective urban crisis management model.
2.
LITERATURE REVIEW
In today’s world, automobile dependence is one of the major aspects of urban travel in cities.
The most visible manifestation of this automobile dependence is the road traffic congestion problem (Miller, 1972). Traffic congestion occurs when travel demand exceeds the existing road system capacity (Rosenbloom, 1978). In order to overcome this problem accurate and real time measurement of traffic parameters such as type and number of vehicles, their individual speeds and overall flow pattern is essential. The existing methods can be broadly divided into intrusive and non intrusive techniques. The intrusive techniques include employment of, pneumatic road tubes, inductive loop, magnetic sensors etc and the non intrusive techniques include ultrasonic sensors, infrared sensors, video image processors etc [3]. Drawback of using pneumatic road tubes and inductive loop sensors is that they are temperature sensitive, which affects their data accuracy rates and that of magnetic sensors is that they cannot detect stopped vehicles. In case of video image processors factors such as inclement weather, shadows, vehicle projection into adjacent lanes, occlusion, day-to-night transition etc affect performance [4]. Also the cost associated with VIP’s and other non intrusive techniques is large making it a non- economical option.
pixels correctly, with an associated false positive rate of 6%, but for urban areas these figures fell to 57% and 18%, respectively. Even with the employment of currently available SAR image resolutions of 3 m and higher, signal returns from man-made structures hamper the accurate mapping of flooded areas [7]. The difficulty of detecting flooded areas in a built-up environment has been partially addressed by a Change Detection approach that makes use of pre- or post flood reference images available in the data archives of satellite data providers. Although this approach overcomes the need of a high-resolution DEM and a SAR simulator for determining shadow regions that are not visible to the satellite, it requires a reference image with the same imaging characteristics as the flood image restricting its applicability for new satellites [8]. Hence we conclude that most of these methods although capable of flood detection in rural areas, fail to provide effective continuous real time detection in urban areas.
3.
CONCEPTUAL MODEL OF THE
SYSTEM
3.1
Sensor
In our approach sensors are used to detect traffic intensity and flood levels. They are connected to the port of the microcontroller. The 2 sensors used are as follows:-
A.
Traffic flow sensor
Conventionally sensors such as proximity sensors, optical detectors etc are used to detect moving vehicles. Detection of vehicle is done by placing a sensor along the road and with each passing vehicle a pulse is generated. These pulses are then counted and the count value is proportional to the number of vehicles passing the road. This approach can be used only to determine the volume of traffic passing through a particular area and not nature of traffic flow (i.e. free flow or congestion).
If the traffic is moving smoothly then the pulses generated due to the switching will have low pulse width and high frequency. Due to the low width of the pulse, count value is low as the controller program loop used to scan the port line to which switch is connected detects logic high for most of the time in a given interval and count does not increase. Thus count value is low indicating smooth flow of traffic. When there is a traffic jam occurring at a junction then switching frequency is low resulting in a widened pulse. This increase in pulse width causes logic low detection by the controller for more number of instants with the count value increasing correspondingly. Thus higher count indicates traffic jam. When the count value is in between the two values the traffic is said to be moderate. The plank arrangement also consists of springs to avoid triggering of switch due to light weight vehicles.
[image:2.595.314.541.78.255.2]In our approach shown in fig.1, a traffic flow sensor is implemented using switch, springs and a metal plank. The switch changes its state for each passing vehicle from logic high to logic low. The output of switch is continuously sensed by the microcontroller port and every time it senses a logic low the count value is incremented, the value of count gives the nature of traffic flow. The frequency of switching
Fig.1 Traffic Flow Sensor
B.
Flood sensor
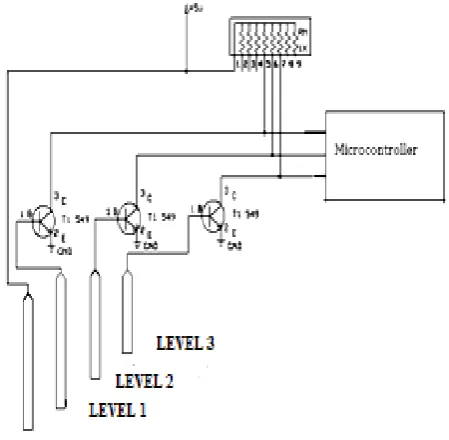
In order to detect flood level we make use of conducting level sensor shown in fig.2. The conducting level sensors are more suitable for applications where point detection is required. These sensors are constructed using transistors and conducting probes. The conducting probes can be of etched PCB type or conducting wires. However implementing the circuit using etched PCB improves the performance and makes the circuit sophisticated.
Fig. 2 Flood sensor
3.2
Microcontroller
[image:2.595.327.552.415.635.2]3.3
Zigbee module
In our system we make use of a Zigbee module for communication between the microcontroller and central monitoring system. It is a reliable, low power, secure, low cost wireless standard. It is easy to deploy, has a long battery life and can be used globally [9]. It thus contributes to making the system more cost effective and sustainable. However the option of using GSM/GPRS based wireless system is available but these services require payment of fee for using the network moreover the cost of hardware is also high.
The another drawback of GSM/GPRS based wireless network is that they require high power for its operation .This drawback is overcome as Zigbee is a low power wireless mesh networking standard.
3.4
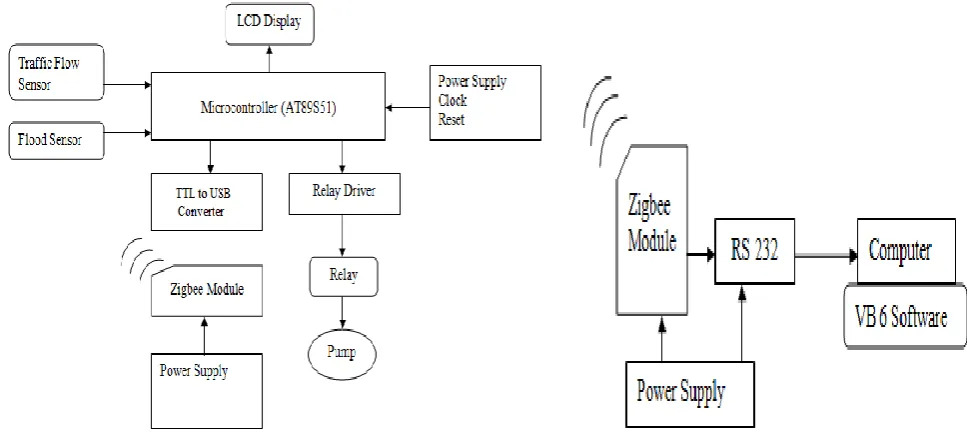
Block diagram
The block diagram is depicted in the fig.3 & 4. Flood sensor helps in detecting the flood levels. These flood levels are then assigned a particular value by the microcontroller indicating the level of flood at the corresponding junction .The traffic sensor senses the traffic density at a particular junction. Detection of traffic density is done with help of switch and a program driven function used to determine the traffic density depending upon switching frequency. The traffic density is classified as high, low and medium depending upon the count value .This information about traffic density and flood levels is then relayed to the central monitoring unit using Zigbee module and also to the preceding junction and is displayed using LCD display[10]. At the central unit the information coming from each of the junction needs to be distinguished and for this purpose each junction has its own unique Area Code. Whenever the flood level reaches maximum level a control action needs to be initiated quickly. Since this system updates the information to the central monitoring unit on a regular basis the control action can be initiated by the person
in central monitoring unit by simply giving command to the microcontroller using Zigbee wireless networking standard for communication. On receiving the command the controller turns on the DC motor [10] so as to pump the flood water into the sewage water drain. The driving of DC motor is done using motor drive relay circuit.
The communication between the microcontroller and the central monitoring unit is achieved using Zigbee communication. The Zigbee module produces TTL output which is not compatible with the computer used at the central monitoring unit. Hence TTL to USB converter is used. The USB output available at the converter is compatible with the computer. The computer in the central monitoring unit helps in displaying information such as traffic density and flood level with the help of visual basic. Thus the traffic density and flood level at a particular junction is displayed at central monitoring unit on a real time basis. Since visual basic is an event driven program the control to switch on the motor can be done by the operator at central monitoring unit by giving the command with a single click on computer.
Also in some situations the real time visuals of particular junction are also required to mitigate against the calamity, a the real time visuals of a particular junction helps the person sitting in control unit to take preventive measures for which a wireless camera is used. At the central monitoring unit the wireless camera receiver receives the real time images from each camera installed at traffic junction. The wireless camera receiver provides audio/video output. This AV output needs to be converted to USB standard to make it compatible with the computer at the control unit. This conversion is done by the TV tuner card which provides USB standard output. The USB output from the TV tuner card is inputted to the computer which displays the real time images of traffic junctions.
[image:3.595.53.537.469.689.2]4.
SOFTWARE DESCRIPTION
4.1
C Programming
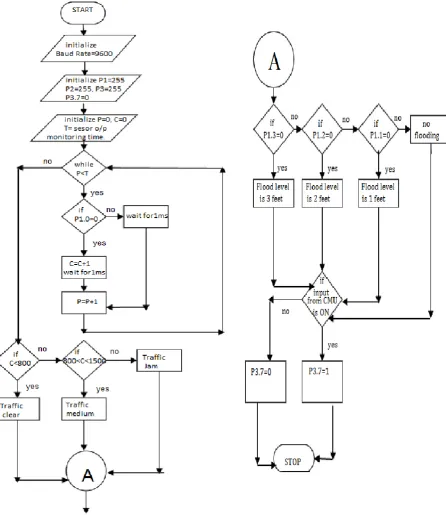
In our system we make use of BASCOM – 8051, for writing micro-controller code in the C language [11]. It is an integrated development environment that includes a BASIC Compiler for 8051 compatible microcontroller devices, Editor, 8051 Simulator and In-System Programming support for a range of 3rd party hardware. Fig 5 indicates the program flow chart. The Baud Rate is specified for serial communication. Next all pins of port 1, 2, 3 are assigned a logic high except P3.7 which is initially assigned a logic low,
indicating that initially the pump is off. The loop control variable P and count variable C is also initialized. The counter value is incremented each time the microcontroller senses a logic low and it value at the end of monitoring period is used to determine the nature of traffic flow, classifying it as clear, medium and jam. Also the input of pins P1.3, P1.2 and P1.1 is used to determine the level of flooding. The microcontroller based on the received input key makes a decision to ON or OFF the pump by making P3.7=1or P3.7= 0.
[image:4.595.64.511.206.722.2]4.2
Visual Basic
Visual Basic is an event driven programming language used to create GUI (Graphical User Interface) applications. In our
system it is used to create control panel for indicating flood level and traffic intensity.
5.
RESULTS CONCLUSION & FUTURE
SCOPE
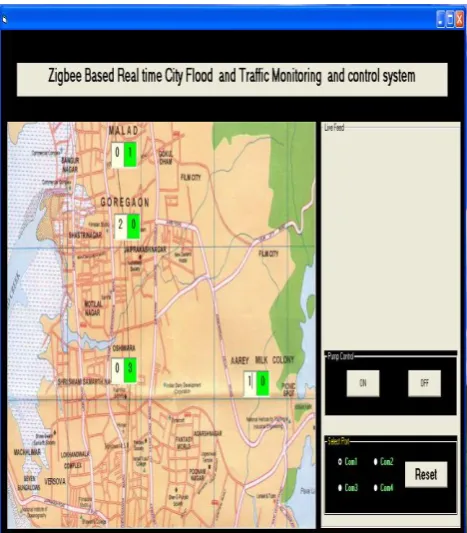
[image:5.595.54.288.202.469.2]The proposed system was successfully implemented and results observed. Accurate numerical data indicating the nature of traffic and flood level was provided and made available at the CMU using Zigbee technology. The figure below shows the control panel at the CMU.
Fig. 6 VB Based Control Panel
We can hence conclude that the proposed system is an efficient and cost effective solution to determine both the nature of traffic flow and extent (level) of flooding. Along with the images it provides accurate real-time numerical data which is an advantage over the conventional techniques. It also helps in initiating a quick response in emergency situations such as flooding with no on field human intervention required as the command is issued and transmitted wirelessly by an operator from the central monitoring unit located at a distant location. This system is useful in developing countries as they have to consider economics before modernization.
The same approach can also be used to detect pollution levels , the only additional requirement being that in that case we need to use a controller which has a built-in ADC such as AVR, PIC controller etc.
6.
REFERENCES
[1] Huan YANG, Heping AN, The Management of Current Traffic Congestion Status During the Urbanization Development, CSC, Volume 2, 2011.
[2] Jonathan I Levy, Jonathan J Buonocore and Katherine von Stackelberg, Evaluation of the public health impacts of traffic congestion: a health risk assessment, Environment health journal, 2010
[3] Khalil M. Yousef, Jaman N. Al- Karaki Ali M. Shatnawi, Intelligent Traffic Light Flow Control System Using Wireless Sensors Networks, JOURNAL OF INFORMATION SCIENCE AND ENGINEERING 26, 753-768 (2010).
[4] Luz Elena, Y. Mimbela, Lawrence A. Klein, A Summary of Vehicle Detection and Surveillance Technologies used in Intelligent Transportation Systems, The Vehicle Detector Clearing house New Mexico State University NMSU and the U.S. Department of Transportation FHWA Fall 2000.
[5] T. Veljanovski , P. Lamoveca , P. Pehani K.Oštir, COMPARISON OF THREE TECHNIQUES FOR DETECTION OF FLOODED AREAS ON ENVISAT AND RADARSAT-2 SATELLITE IMAGES Scientific Research Centre of the Slovenian Academy of Sciences and Arts, SI-1000 Ljubljana, Slovenia .
[6] Mason, D.C. ; Speck, R. ; Devereux, B. ; Schumann, G.J.P. ; Neal,J.C. ; Bates,P.D. Flood Detection in Urban Areas Using TerraSAR-X, Geoscience and Remote Sensing, IEEE Transactions on Volume: 48 , Issue: 2 .
[7] Davenport, Mason, D.C. , I.J. ; Neal, J.C. ; Schumann,
G.J.-P. ;Bates, P.D., Near
Real-Time Flood Detection in Urban and Rural Areas Using High-Resolution Synthetic Aperture Radar Images, IEEE Transactions on Volume : 50, Issue :8
[8] Laura Giustarini, Renaud Hostache, Patrick Matgen, Guy J.-P. Schumann, A Change Detection Approach to Flood Mapping, IEEE TRANSACTIONS ON GEOSCIENCE AND REMOTE SENSING, VOL. 51, NO. 4, APRIL 2013.
[9] Dr.S.S.Riaz Ahamed, The Role of Zigbee in Future Data Communication, Journal of Theoretical and Applied Information Technology.
[10] Mazidi and Mazidi, ‘Microcontrollers’, Prentice Hall Publications, Pg 284-290,300-310,428-430,441-450.