Implementation of an Object Oriented Model to Analyze
Relative Progression of Source code Versions with
Respect to Software Quality
Mandeep K. Chawla
Department of Computer Science & Applications MCM DAV College for Women
Chandigarh, India.
Indu Chhabra.
Ph.D.Department of Computer Science & Applications Panjab University
Chandigarh, India.
ABSTRACT
Many object oriented metrics have been explored and successfully applied by researchers to measure distinct aspects of software quality. Metrics are believed to be early indicators of qualitative parameters to give an idea as to how far a software engineering process has been well-implemented. However, using these metrics in isolation may not serve the purpose entirely. It is more productive to combine these metrics and map them into higher level quality attributes to gain insight into software design properties. This paper aims at analyzing the relative progression of selected versions of java open source software with respect to certain quality parameters which have been quantified and characterized by the QMOOD quality model. The versions can then be compared among themselves against these attributes to determine which design aspects have been improved relative to their predecessors and which still need to be taken care of.
Keywords
Object oriented metrics, Apache Tomcat, Quality attributes, QMOOD, Software quality.
1.
INTRODUCTION
Software community is striving hard to deliver robust software solutions and metrics provide economical means to measure certain aspects of design traits. It is beneficial in not just keeping a check on the cost of development on the whole, but also in bringing out a valuable end product. In view of that, object oriented metrics play an inevitable role and developers seek suitable metrics to reveal internal structure of the source code with respect to software quality. It is more productive to combine these metrics and map them into higher level quality attributes to gain understanding into end-product properties, rather than just restricting their use in isolation.
A quality evaluation approach relies on a quality model that defines components for specifying and measuring quality and for assessing and aggregating the measurement results. Models usually decompose quality into a hierarchy of criteria and attributes. These hierarchical models lead to metrics at their lowest level [1]. Practitioners have recommended several quality models in literature, for instance, ISO/IEC 9126 standard [2] defines various quality characteristics such as functionality, reliability, usability and alike which are further divided into several sub-characteristics. But this standard does not provide apparent information as how to evaluate these characteristics. Bansiya et al. [3] introduced his quality model QMOOD (Quality Model for Object-Oriented Design), an improved hierarchical model for the assessment of high-level
design quality attributes in object-oriented designs. The model readily provides a way to map source code metrics to higher abstraction levels. In this work, we have adopted QMOOD simply because of two reasons- First, it is easy to implement and secondly, it offers the means for measurement of external quality factors from internal design attributes. Besides, it is worth mentioning that this model was primarily applied with C++/Visual C++ validation suite though it can be implemented on any object oriented software. Rest of the paper is organized as follows. Section 2 identifies the quality model undertaken, software to be analyzed, chosen tools and the methodology to follow. Section 3 discusses the metrics agreed upon and their computation as part of the evaluation. Section 4 records the results of base metrics, normalized values and higher level attributes derived from the model. Result analysis, validation and interpretation are dealt in Section 5. Section 6 pinpoints limitations and future directions for the study. Section 7 describes related work and prior research done in this area. Concluding remarks are mentioned in Section 8.
2.
METHODOLOGY
To empirically evaluate the usefulness of QMOOD model, we have randomly chosen four versions of Apache Tomcat1 web server (Series 7). It is an open source software implementation of the Java Servlet and Java Server Pages technologies, and coded in pure java. Apache Tomcat powers numerous large-scale, mission-critical web applications across a diverse range of industries and organizations. CKJM-extended 2.02, (Chidamber and Kemerer Java Metrics and many other metrics) an enhanced version of the original CKJM [4], which is an open source command-line metric calculation tool has been opted to extract source code metrics for selected Tomcat (TC) versions. This tool is capable of computing 19 size and structure metrics per class. While CKJM works on .class files, so as a precondition, project should compile fully to enable the tool to start measurements. To achieve this, source code of all four versions were compiled with Apache Ant3 (version 1.9.0), a Java library and command-line utility that help building software. Tomcat source tree is divided into numerous modules spanning over multiple packages, so, a small command line batch script had to be written, in addition, to specify path of all the directories containing .class files. Metrics values are planned to be redirected to .xml file, an option available with the tool itself. Once the quantities are obtained, they are intended to be used as input for the quality model under consideration. Table I
1 http://tomcat.apache.org/
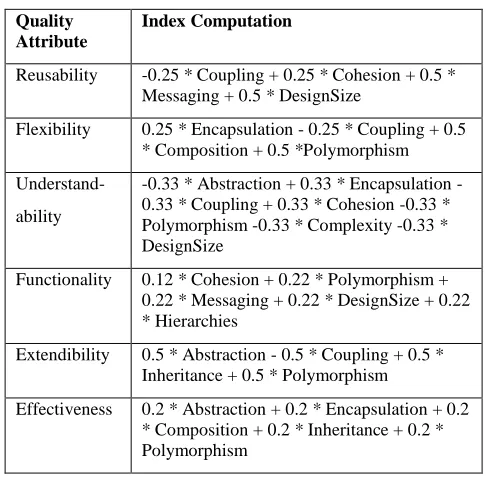
35 describes the formulas to quantify the quality attributes defined
by QMOOD.
Table I. Computation formulas for quality attributes in QMOOD [3]
Quality Attribute
Index Computation
Reusability -0.25 * Coupling + 0.25 * Cohesion + 0.5 * Messaging + 0.5 * DesignSize
Flexibility 0.25 * Encapsulation - 0.25 * Coupling + 0.5 * Composition + 0.5 *Polymorphism Understand-
ability
-0.33 * Abstraction + 0.33 * Encapsulation - 0.33 * Coupling + 0.33 * Cohesion -0.33 * Polymorphism -0.33 * Complexity -0.33 * DesignSize
Functionality 0.12 * Cohesion + 0.22 * Polymorphism + 0.22 * Messaging + 0.22 * DesignSize + 0.22 * Hierarchies
Extendibility 0.5 * Abstraction - 0.5 * Coupling + 0.5 * Inheritance + 0.5 * Polymorphism
Effectiveness 0.2 * Abstraction + 0.2 * Encapsulation + 0.2 * Composition + 0.2 * Inheritance + 0.2 * Polymorphism
3.
EVALUATION
SETTING
[image:2.612.319.561.68.306.2]Once this comprehensive base-work is carried out, the batch script is invoked from command line to set off CKJM for each source code version one at a time. After collecting the output in XML file, it is convenient to import the same in any spreadsheet program facilitating us for further analysis. It should be noted that name of metrics delivered by CKJM are not precisely the same as described by QMOOD metric-suite, however many similarities have been identified. Besides, according to Bansiya et al. [3], at the lowest level, metrics used to assess design properties may be changed or a different set of design properties may be used to assess quality attributes. QMOOD metrics and equivalent substitute metrics have been recorded in Table II.
Table II. QMOOD properties &equivalent substitute metrics
Design Property [QMOOD]
Design Metric
[QMOOD]
Equivalent metric substitute
(in this paper)
Coupling Direct Class Coupling (DCC)
Coupling between object classes (CBO) Cohesion Cohesion Among
Methods of Classes (CAM)
- Same as in QMOOD -
Messaging Class Interface Size (CIS)
Number of public Methods (NPM) Design Size Design Size in
Classes (DSC)
Number of Classes (NOC)
Encapsulation Data Access Metric (DAM)
- Same as in QMOOD -
Composition Measure of Aggregation (MOA)
- Same as in QMOOD -
Polymorphism Number of Polymorphic Methods (NOP)
Coupling Between Methods (CBM)
Abstraction Average Number of Ancestors (ANA)
Inheritance Coupling (IC)
Complexity Number of Methods (NOM)
Weighted methods per Class (WMC) Hierarchies Number of
Hierarchies (NOH)
Depth of Inheritance Tree (DIT)
Inheritance Measure of Functional Abstraction (MFA)
- Same as in QMOOD -
Following is a brief justification of the metrics replaced/substituted for the ones dictated by chosen model- i) Polymorphism: The corresponding metric NOP is a count of the methods that can exhibit polymorphic behavior. This metric has been compensated by CBM, which according to CKJM manual, measures the total number of new/redefined methods to which all the inherited methods are coupled.
ii) Abstraction: In QMOOD, this property signifies the average number of classes from which a class inherits information. The metric ANA has been replaced with IC which provides the number of parent classes to which a given class is coupled. iii) Complexity: The CKJM program assigns a complexity value of 1 to each method, and therefore the value of the WMC is equal to the number of methods (NOM) in the class.
Lastly, the meaning of corresponding metrics for properties Messaging, Design Size and Hierarchies is inherently the same in QMOOD and CKJM; they just differ by name. As for rest of properties, even the metrics’ names are identical.
4.
COMPUTED
METRICS
&
QUALITY
ATTRIBUTES
Table III, IV, V and VI records the descriptive statistics for metrics computed respectively for each version in succession and the entries which are not-applicable are marked with symbol ‘–'.
Table III. Descriptive statistics for Version 7.0.6
Version 7.0.6
Metric MAX AVG STD-DEV SUM
CBO 77 4.08 6.44 -
CAM 1 0.53 0.25 -
NPM 264 7.93 13.17 15475
NOC - - - 1949
[image:2.612.56.299.121.364.2] [image:2.612.51.291.523.715.2]MOA 36 0.09 1.03 -
CBM 28 0.84 2.47 1643
IC 4 0.32 0.62 -
WMC 289 9.77 14.95 19050
DIT 6 1.62 0.99 -
[image:3.612.56.297.68.665.2]MFA 1 0.31 0.39 -
Table IV. Descriptive statistics for Version 7.0.22
Version 7.0.22
Metric MAX AVG STD-DEV SUM
CBO 78 4.10 6.40 -
CAM 1 0.53 0.25 -
NPM 278 7.97 13.77 16686
NOC - - - 2092
DAM 1 0.57 0.47 -
MOA 35 0.098 1.00 -
CBM 28 0.77 2.34 1604
IC 4 0.29 0.60 -
WMC 301 9.83 15.44 20569
DIT 6 1.46 1.04 -
MFA 1 0.25 0.37 -
Table V. Descriptive statistics for Version 7.0.39
Version 7.0.39
Metric MAX AVG STD-DEV SUM
CBO 72 3.43 6.10 -
CAM 1 0.54 0.26 -
NPM 296 7.98 16.05 18815
NOC - - - 2358
DAM 1 0.56 0.47 -
MOA 37 0.10 1.01 -
CBM 26 0.84 2.39 1986
IC 4 0.32 0.61 -
WMC 319 9.75 17.50 22997
DIT 6 1.78 1.01 -
[image:3.612.330.564.84.310.2]MFA 1 0.35 0.41 -
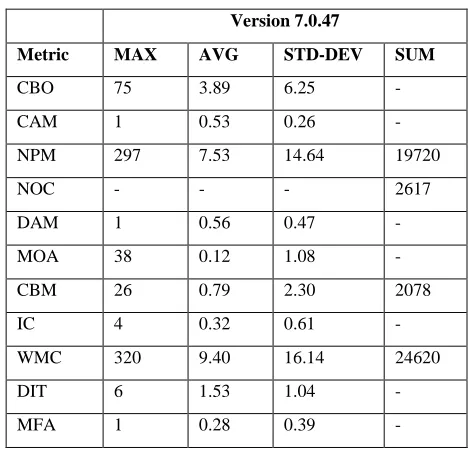
Table VI. Descriptive statistics for Version 7.0.47
Version 7.0.47
Metric MAX AVG STD-DEV SUM
CBO 75 3.89 6.25 -
CAM 1 0.53 0.26 -
NPM 297 7.53 14.64 19720
NOC - - - 2617
DAM 1 0.56 0.47 -
MOA 38 0.12 1.08 -
CBM 26 0.79 2.30 2078
IC 4 0.32 0.61 -
WMC 320 9.40 16.14 24620
DIT 6 1.53 1.04 -
MFA 1 0.28 0.39 -
Since these measures further have to make up as input parameters to attain quality attributes, we need to choose one aggregate value from each metric’s domain of quantities [5]. Therefore, average value for each metric will be used except for NPM, NOC, CBM; for which aggregate function sum makes more sense.
[image:3.612.323.570.532.704.2]Moreover, because actual metric values of different ranges are combined in the computation of the quality indices, the metric values for each framework were normalized with respect to the metrics' values in the first version of the frameworks [3]. The actual metric measures of 4 versions of Apache Tomcat are replaced by their normalized values (computed by dividing a metric value with the metrics' value in the first selected version) and shown in Table VII. The idea has been borrowed again from the prototype study of the founder of this model itself. Table VIII shows the derived values of the 6 quality attributes dictated by QMOOD quality model based on the normalized values of Table VII.
Table VII. Normalized metric values
Metric TC 7.0.6 TC 7.0.22 TC 7.0.39 TC 7.0.47
CBO 1 1.01 0.84 0.95
CAM 1 1.00 1.03 1.01
NPM 1 1.08 1.22 1.27
NOC 1 1.07 1.21 1.34
DAM 1 1.02 1.01 1.01
MOA 1 1.06 1.08 1.31
CBM 1 0.98 1.21 1.26
IC 1 0.89 1.00 0.99
37
DIT 1 0.90 1.09 0.94
MFA 1 0.80 1.11 0.89
5.
RESULT
ANALYSIS,
VALIDATION
AND
INTERPRETATION
The plot of QMOOD quality indices has been shown in Fig. 1 based on values in Table VIII.
Table VIII. Derived Quality attributes
Quality index
TC
7.0.6
TC 7.0.22
TC 7.0.39
TC 7.0.47
Reusability 1.00 1.07 1.26 1.32
Flexibility 1.00 1.02 1.19 1.30
Understandability -0.99 -0.97 -1.06 -1.15 Functionality 1.00 1.01 1.16 1.18 Extendibility 1.00 0.83 1.24 1.09 Effectiveness 1.00 0.95 1.08 1.09 The expected increase in values of these quality attributes is compatible with the idea that these quality attributes should improve with new releases in framework-based systems [3]. However, one may notice a reverse trend in case of Understandability. It is the only parameter with negative values and has been skipped in the graph as well. This is in conformance with the principle that each new version carries additional functionality and is expected to be more challenging to comprehend and understand. We have verified this with the results of Bansiya et al. [3] and our findings have found to be in agreement with them. Also, there are few exceptions to mention. Value of ‘Effectiveness’ in version 7.0.22 shows a small decrease (unlike their counterparts) from the computed values in 7.0.6. The same trend has been observed in ‘Extendibility’ too. This corroborates the fact that version 7.0.6 is stated to be the first stable version in Tomcat series 7. So the source code of this version is assumed to be fine-tuned and refactored to have reasonable provisions for potential enhancements; whereas 7.0.22 was primarily aimed for bug fixes and few improvements. Furthermore, from Table VIII, version 7.0.39 is adjudged better than its successor in Extendibility. The most likely reason behind is, this version is marked with more additions and improvements than in 7.0.47. It may be confirmed from the Changelog4, published by of Apache software foundation for all its releases.
The benefits of implementing this model are twofold – Firstly, as a cost-effective means to quantify certain quality aspects and cross-comparison among different versions; secondly, as an indicator to problem areas by pinpointing constituent base-metrics which may cause degradation in a specific quality factor. For instance, it can be observed in Table I that complexity and coupling are inversely proportional to quality factors and hence resources may be allocated to improvement zones accordingly as well as by determining the weighted input of essential metrics. Additionally, it would be beneficial for project managers to use
4 http://tomcat.apache.org/tomcat-7.0-doc/changelog.html
[image:4.612.321.559.108.266.2]metrics to identify extreme values, isolate unsafe modules, and stay well-versed about the trade-off between various software attributes of interest [6].
Fig. 1 Plot of QMOOD quality indices
6.
LIMITATIONS
&
FUTURE
DIRECTIONS
Like many empirical studies, it is worth mentioning the limitations of our study:
a) Our results come from evaluation of randomly chosen four versions of Tomcat series. Future work with wider samples is vital to make generalized remarks.
b) More multi-version products should also be examined to see if the findings are dependable across different kinds of software. c) Our results are apparently restricted to the measurement precision of the metric calculation tool. Replications of our study using other such tool are also desirable to validate these outcomes.
d) Another source of bias may be the Quality model chosen itself.
7.
RELATED
WORK
experimental technique, based on search-based refactoring, to assess software metrics and to explore relationships between them. Authors [15] in their work, establishes the relationship between selected source code metrics and a high level software attribute, maintainability, as opined by IT experts.
8.
CONCLUDING
REMARKS
In the field of software engineering, metrics have quite been instrumental in understanding of whether the quality of software built corresponds to the expectations of the stakeholders [16]. To make software metrics more beneficial, they can be utilized as part of a comprehensive quality model to derive higher level design characteristics. In this study, various object oriented metrics (extracted from the source code of 4 versions of Apache Tomcat) have been taken as input parameters in QMOOD to quantify and indicate trends in reusability, flexibility, functionality, understandability, extendibility, and effectiveness. Quantification of these quality characteristics provides ample opportunities for different stakeholders having varied interests in the project, and as a convenient cross-comparison instrument for project managers. It gives an insight into as how the project is progressing from one version to next - either with the aim of improving quality or with the sole idea of adding functionality at the cost of quality. Also one can notice that metrics have been employed over and again in certain characteristics carrying different weights. These weights can also be modified to achieve new thresholds or to meet end users' priorities. Once it is known which components are potentially more problematic than others, testing and fixing efforts can be well directed and more effective. According to Rosenberg (1998), when metrics are used to evaluate projects, there is no guideline to interpret their results. Often qualifying the result is based on common sense and experience. Determining an acceptable value depends on enterprise requirements and developer experience.
In future, we plan to extend this research by taking additional metrics into consideration to derive another set of higher level attributes.
9.
REFERENCES
[1] Samoladas, I., Gousios, G., Spinellis, D., & Stamelos, I. 2008. The SQO-OSS quality model: measurement based open source software evaluation. In Open source development, communities and quality, Springer US, 237-248.
[2] [ISO 2001. ISO/IEC 9126-1: Software engineering - product quality - part 1: Quality model. Geneva, Switzerland.
[3] Bansiya, J., & Davis, C. G. 2002. A hierarchical model for object-oriented design quality assessment. Software Engineering, IEEE Transactions on, 28(1), 4-17.
[4] D. Spinellis 2005. Tool Writing: A Forgotten Art? IEEE Software, Vol. 22, No. 4, 9-11.
[5] Chawla, M. K., and Chhabra I. 2013. Capturing OO Software Metrics to attain Quality Attributes–A case study. International Journal of Scientific & Engineering Research, Vol. 4, Issue 6, 359-363.
[6] Chawla, M. K., and Chhabra I. 2013. Investigating the Strength of Relationships among Software Metrics. International Journal of Computer Applications, 81(10), 21-25.
[7] Bouwers, E., Deursen, A. V., & Visser J. 2013. Evaluating usefulness of software metrics: an industrial experience report. In Proceedings of the International Conference on Software Engineering, IEEE Press (May 2013), 921-930. [8] Goyal, P. K., & Joshi, G. 2014. QMOOD metric sets to
assess quality of Java program. In Issues and Challenges in Intelligent Computing Techniques (ICICT 2014), IEEE (Feb 2014), 520-533.
[9] Roden, P. L., Virani, S., Etzkorn, L. H., & Messimer, S. 2007. An empirical study of the relationship of stability metrics and the qmood quality models over software developed using highly iterative or agile software processes. In Source Code Analysis and Manipulation, SCAM 2007, Seventh IEEE International Working Conference (Sep 2007), 171-179.
[10]O’Keeffe, M., & Ó Cinnéide, M. 2008. Search-based refactoring for software maintenance. Journal of Systems and Software, 81(4), 502-516.
[11]Sehestedt, S., Cheng, C. H., & Bouwers, E. 2014. Towards quantitative metrics for architecture models. In WICSA Companion (Apr 2014).
[12]Bouwers, E., Visser, J., & Van Deursen, A. 2012. Getting what you measure. Commun. ACM, 55(7), 54-59.
[13]Osbeck, Joshua, et al. 2011. Investigation of automatic prediction of software quality. Fuzzy Information Processing Society (NAFIPS), Annual Meeting of the North American, IEEE.
[14]Ó Cinnéide, M., Tratt, L., Harman, M., Counsell, S., and Hemati Moghadam, I. 2012. Experimental assessment of software metrics using automated refactoring. In Proceedings of the ACM-IEEE international symposium on Empirical software engineering and measurement, 49-58. [15]Hegedűs, P., Bakota, T., Illés, L., Ladányi, G., Ferenc, R.,
& Gyimóthy, T. 2011. Source code metrics and maintainability: a case study. In Software Engineering, Business Continuity, and Education, 272-284. Springer Berlin Heidelberg.