Different Data Mining Techniques for Weather Prediction
Sanika Sarode
1, Puja Girkar
2, Samiksha Kanekar
3,
Saurabh Mishra
4,
Rohini Patil
51,2,3,4,5 Department of Computer Engineering, Terna Engineering College, Maharashtra, India
---***---Abstract -
Abstract-Data Mining is the process of miningand analyzing immense set of data and then extracting the relevant data. Data mining tools allow business to make proper and good decision. Traditional method was time consuming therefore, they can be used to predict meteorological data, This is called weather prediction [12].Weather Forecasting is an important application and has been one of the most scientifically and technologically challenging problem around the world [14].This survey paper uses the data mining techniques for weather prediction such as Back propagation, Decision tree, K-means Clustering, Expectation Maximization, Numerical and Statistical method.
Key Words: meteorological data, data mining, back
propagation.
1. INTRODUCTION
Weather forecasting is one of the important problems which are addressed by the meteorology departments all over the world. In this process a day-to-day analysis of the weather is predicted for taking decisions and these forecasting should be communicated for the end users [3]. It is a most challenging issue since the decisions that are taken are mostly with uncertainty. These forecasting strategies are categorized by researchers in a 2-fold, based on numeric modeling and based scientific processing. Among these categorizations, the predictions of the rainfalls are mostly subjected to the analysis by numerical methods [2]. Since the data changes dynamically, in particular with weather, results into uncertainties in most of the cases. We demonstrate some of the Data Mining Techniques used in weather forecasting.
2. LITERATURE SURVEY
In [7] Rajesh Kumar reviewed “Decision Tree for the Weather Forecasting”, the application based on Decision trees and machine learning algorithm are applied to this prediction. The measurements are fog, rain, thunder, humidity and pressure. Classification methods, decision tree based methods, rule based, memory based reasoning, neural network and support vector machine methods applied in this process. In this prediction, main goal is to create a model that’s going to predict the value of target parameters based on input parameters and huge amount of data can be used to predict.
In [9] Fair bridge R.W proposed K-means clustering is a data mining algorithm used to cluster observations into groups of relevant observations without any prior knowledge of those relationships. K-means is the most popularly used algorithm for clustering. User need to specify the number of clusters (k) in advance. Algorithm randomly selects k objects as cluster
mean or center and K-means Basic version works with numeric data only. It is a prototype based clustering technique defining the prototype in terms of a centroid which is considered to be the mean of a group of points and is applicable to objects in a continuous n-dimensional space. It is a method of vector quantization, really from signal processing, that is famous for cluster analysis in data mining and Cluster data using the k means algorithm.
In [11] The Wikipedia states that an Expectation Maximization is an iterative method for finding maximum likelihood or Maximum a posteriori (MAP) estimates of parameters in statistical models, where the model depends on unobserved latent variables. There are two steps in this EM Algorithm process: There are two step mainly involved in EM Algorithm process:
Step 1: EM iteration alternates between performing an expectation step, which made a function for the expectation of the log-likelihood assess using the current estimate for the parameters. Then, calculate the expected value of the log likelihood function. Q ( Ө | Ө (t) ) = E z | x , Ө (t) [Log L 9 ( Ө; X , Z ) ] Here , Z = Sequence of values or Sum Log L = Log likelihood Ө = Unknown Parameters X = Observed Data (Ө (t))
Step 2: A maximization step, which computes parameters maximizing, the expected log-likelihood found on the Estep. These parameters estimates are then used to determine the distribution of the latent variables in the next E step. Find the parameters that maximizes this quantity: Ө (t + 1) = arg max Q ( Ө | Ө (t) ) Ө By Applying these two steps for finding maximization values of weather attributes like sunny, rainy and overall temperature and humidity mean and standard deviation and windy and play.
Charney and Academician Obukhov (of former Soviet Russia) who derived a consistent set of mathematical equations for weather prediction. Statistical methods are used along with the numerical weather prediction. This method often supplements the numerical method. Statistical methods use the past records of weather data on the assumption that future will be a repetition of the past weather.
In [20] Saurabh Karsoliya, Manisha Kharola and Dinesh Kumar proposed Back propagation Method as a deep learning algorithm, it is a term used to describe neural networks with more than one hidden layer. The back propagation method for training multilayer feed forward network is conducted in two phases.
1) Phase 1: propagation
2) Each propagation involves the following steps:
1. Propagation forwarded through the network to generate the output value(s)
2. Calculation of the cost (error term)
3. Propagation of the output activations back through the network using the training pattern target in order to generate the deltas (the difference between the desired and actual output values obtained) of all output and hidden neurons.
3) Phase 2: weight updating
For each weight updating, the following steps must be followed.
The weight's output delta and input activation function are multiplied to find weight.
A ratio (percentage) of the weight's gradient is subtracted from the weight.
3. EXISTING SYSTEM
3.1. K-Means Clustering:
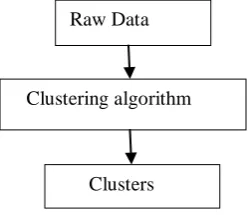
[image:2.595.81.206.660.767.2]K-means clustering algorithm is a data mining technique used to cluster observations into groups of similar observations without any previous knowledge of the relationships [12]. K-means is one of the most popularly used algorithms for clustering. Signal processing, that is famous for cluster analysis in data mining and cluster data using the k means algorithm also uses this method, the inputs in this method is number of cluster which will be used and the dataset.
Fig -1. Data mining clustering steps
The K-Means clustering algorithm is a partition-based cluster analysis method. Following steps in this process:
Step 1: Initialization step: initialize K centroids
Do Assignment step: assign each data point to its centroid Re-estimation step: Re compute centroid (cluster centers) While (there are still changes in the centroid) select k objects as initial cluster centers. The dataset is partitioned into K clusters and the data points are randomly set to the clusters resulting in clusters that have roughly the same number of data points.
Step 2: For each data point calculate the Euclidean distance from the data point to each cluster. The Euclidean distance is the straight-line distance between two pixels,
ED√(x1 – x2)² + (1 – y2)²
Where (x1, y1) & (x2, y2) are two data points.
Step 3: If the data point is nearer to its own cluster, leave it where it is. If the data point is not closest to its own cluster, move it into the closest cluster. Repeat the above step until a entire pass through all the data points’ results in no data point transferring from one cluster to another.
Step 4: Repeat this process until the criterion function converged and square error criterion for clustering.
3.2. Decision tree J48 Algorithm
Decision tree is a tool that helps a tree-like graph or model of decisions and their possible consequences, including chance event results, resource costs, and utility [2]. The decision tree J48 is the implementation of algorithm ID3 (Iterative Dichomiser 3) developed by the WEKA project team. By applying a decision tree like J48 Algorithm on dataset would allow to predict the target variables/parameters of a new dataset record [7].Following steps in J48 Algorithm process: Step1: Divide the input space of a weather dataset into manually exclusive areas.
Step 2: Assign the label of having an attributes. Step 3: Describe the value of each data points. Step 4: Applying the rule.
R1 : IF (Outlook = Sunny) AND (Windy = FALSE ) THEN Play = Yes R2 : IF(Outlook = Sunny ) AND (Windy = TRUE ) THEN Play = No R3 : IF( Outlook = Overcast ) THEN Play = Yes
R4: IF (Outlook = Rainy ) AND (Humidity = High ) THEN Play = No R5 : IF (Outlook = Rainy ) AND (humidity = Normal ) THEN Play = Yes
Clustering algorithm Raw Data
Step 5: Splitting criterion to calculate the attributes is the best to split that portion of the training data that reaches a particular node.
3.3. EM (Expectation maximization algorithm)
An iterative method for finding maximum likelihood or Maximum a posteriori (MAP) estimates of parameters in statistical models, where the model depends on unobserved latent variables is called as an Expectation Maximization is. There are two steps in this EM Algorithm process:
There are two step mainly involved in EM Algorithm process[12]:
Step 1 : EM iteration alternates between performing an expectation step, which made a function for the expectation of the log-likelihood assess using the current estimate for the parameters. Then, calculate the expected value of the log likelihood function.
Q ( Ө | Ө^(t) ) = E z | x , Ө^(t) [Log L 9 ( Ө; X , Z ) ] Here , Z = Sequence of values or Sum
Log L = Log likelihood Ө = Unknown Parameters X = Observed Data (Ө^(t))
Step 2: A maximization step, which computes parameters maximizing, the expected log-likelihood found on the Estep. These parameters estimates are that used to determine the distribution of the latent variables in the next E step. Find the parameter that maximizes this quantity:
Ө (t + 1) = arg max Q (Ө | Ө (t))
3.4. Numerical methods
More recently it has been observed that other methods can more accurately predict the future weather than was possible by the traditional synoptic approach [1]. The numerical method involves a lot of mathematical calculations. At present a full set of hydro thermodynamic equations is used for Numerical Weather Prediction [11]. The derivation of this set is based on the fundamental laws of conservation including the following ones:
1. Newton’s second law should be applied in a rotating coordinate system. The mathematical representation of this law is a projection of acceleration on three directions of the corresponding coordinate axes (equations of motion). dV/dt + 2Ω x V=F + G + P.
Here V – vector of velocity,
Ω - angular velocity of the Earth’s rotation, F – viscosity forces,
G –gravitational force,
P – pressure forces, per unit mass for force terms.
2. Law of conservation of mass as applied to motion of fluid or gas and mathematically expressed as a continuity equation dρ/dt + ρ∇V = 0.
Here ρ is air density.
3. The first law of thermodynamics or law of conservation of energy as applied to thermal energy and expressed as a heat fluxes equation. ,
dT/dt – R/c T/p dp/dt = ε/c, where T – air temperature,
R – Specific gas constant for dry air, c - Specific heat capacity,
ε - Non-adiabatic sources (sinks) of heat.
4. Equation of state, representing a one-valued coupling among pressure, air density and temperature and meaning that the atmospheric air can be considered as an ideal gas p = ρRT.
5. Law of conservation of specific humidity providing a total humidity balance in the atmosphere, which can be locally expressed as
dq/dt = S,
where q is specific air humidity,
S - Term, describes phase transformation of humidity in atmosphere, processes of evaporation and precipitation. Depending on the goal the initial system can be transformed into any form.
3.5. Statistical Method
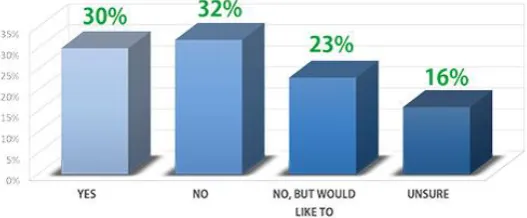
[image:3.595.312.576.608.717.2]Along with the numerical weather prediction Statistical methods is used [11]. This method is supplementary method of the numerical method. Statistical methods use the previous records of weather data, assuming that future will be a repetition of the past weather. Statistical methods are important in long-range weather forecasts. The National Weather Service prepares monthly and weekly weather statistics.
represented on charts [11]. Estimates of the maximum temperature for the day from the data of the current conditions are providing by these charts. Another statistical approach to weather prediction is called the Analog Method. An attempt is made to identify in the past weather records that are almost similar to the current conditions.
4. PROPOSED SYSTEM
4.1 Back propagation Method
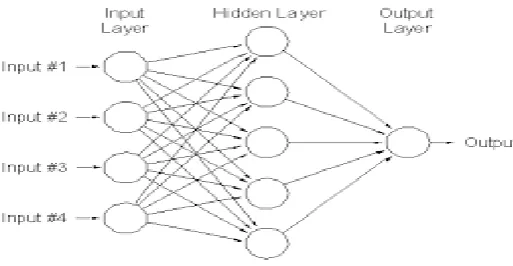
[image:4.595.39.296.275.408.2]Back propagation is sometimes referred to as deep learning algorithm it is a term used to describe neural networks with more than one hidden layer[16]. The back propagation method for training multilayer feed forward network is conducted in two phases
Fig -3: A Back Propagation Neural Network Architecture Back propagation is a supervised learning algorithm, the desired output are given as part of training vector. An error signal is produced by subtracting actual network output from the desired outputs. This error signal generated is then the basis for the back propagation , this error are then passed back through the network by computing the contribution of every hidden processing unit/layer and determining the corresponding adjustment needed to produce the correct output[20].
4.2 Algorithm:
Consider a network with a single input ‘a’ and network function ‘f’. The derivative f 0 (a) is computed in two phases:
4.3 Feed-forward:
The network is fed with an input a. At each node the primitive functions at the nodes and their derivatives are evaluated. The derivatives are stored.
4.4 Back propagation:
The constant 1 is fed into the output unit and the network runs backwards. Input information given to a node is then added and the obtained result is multiplied by the value stored in the left part of the unit then this result is transmitted to the left of the unit. The result collected at the input unit is the derivative of the network function.
4.5 Phases in Back Propagation Technique:
4.5.1 Phase 1: Propagation
Each propagation involves the following steps:
1. Propagation forwarded through the network to generate the output value(s)
2. Calculation of the cost (error term)
3. Propagation of the output activations back through the network using the training pattern target in order to generate the deltas (the difference between the desired and actual output values obtained) of all output and hidden neurons.
4.5.2 Phase 2: Weight updating
For each weight updating, the following steps must be followed:
1. The weight's output delta and input activation function are multiplied to find weight.
2. A ratio (percentage) of the weight's gradient is subtracted from the weight.
The speed by which a neuron can learn and the quality of learning is called as learning rate. Greater the ratio, faster the neuron trains, but lower the ratio, more accurate the training is. The error varies directly, or inversely to, the weight is determine by the sign of the gradient of a weight. Therefore, the weight must be updated in the opposite direction.
5. ANALYSIS
Methods Accuracy Time
complexity/functions Usage
K-means clustering High O (n^2) More
Decision tree J48
algorithm High O(n^2) More
Back propagation
algorithm Very high O(w^3) w:count of weights More
Numerical method High f(n)*(1+o(1)) Less
Statistical method Low O(n^2) Less
Expectation
maximization Moderate O(Nkd) Less
Table -1: Comparison of Different Algorithms
6. CONCLUSION
,Statistic method has been applied to the data collected in specific time.
This paper determines the effective computer based method to predict weather based on parameters like accuracy, execution time and usage.
REFERENCES
[1] Arti R. Naik., Prof. S.K.Pathan ., “ Weather classification
and forecasting using feed forward neural network” , International Journal of Scientific and Research Publications, Vol 2, Issue 12, 2012 .
[2]
https://www.ijarcce.com/upload/2016/february-16/IJARCCE%2062.pdf
[3] Prasanth Rao Jillella.S.S .,”Weather Forecasting Using
Artificial Neural Networks And Data Mining Techniques” , International Journal Of Innovative Technology And Research Vol No:3, pp.2534 – 2539, 2015.
[4] M. Viswambari., Dr. R. AnbuSelvi . , “Data Mining
Techniques To Predict Weather: A Survey”, International Journal Of Innovative Science, Engineering & Technology, Vol. 1 Issue 4, pp. 2348 – 7968, 2014 .
[5] AnkitaJoshi1 . , Bhagyashri Kamble2 ., Vaibhavi Joshi3 .,
Komal Kajale4 ., Nutan Dhange5 , “Weather Forecasting And Climate Changing Using Data Mining Application”, International Journal Of Advanced Research In Computer And Communication Engineering, Vol. 4, Issue 3, 2015.
[6] http://csjournals.com/IJCSC/PDF6-2/33.%20Vamsi.pdf [7] Rajesh Kumar, “Decision Tree For The Weather
Forecasting”. International Journal Of Computer Applications (0975–8887) Volume76–No.2, 2013.
[8] Meghali A. Kalyankar, S. J. Alaspurkar, “ Data Mining
Technique to Analyse the Metrological Data”, International Journal of Advanced Research in Computer Science and Software Engineering 3(2), 114-118, February – 2013.
[9] www.wikipedia.com 8. Fair bridge R.W. , "Data mining in
course management systems: Moodle case study and tutorial/ Computers & Education”, Vol. 51, No. 1, pp. 368-384, 2008 .
[10] Rushing J.R., Ramachandran U. , Nair S. ,Graves R., Welch,
LinA., , “A Data Mining Tool kit for Scientists and Engineers”/ Computers & Geosciences, 31,pp607-618, 2005.
[11] http://www.preservearticles.com/2011111717376/wh
at-are-the-methods-used-for-weather-forecasting.html
[12] https://www.ijircce.com/upload/2016/december/44_
Weather.pdf
[13] https://www.ijecs.in/issue/v5-i12/77%20ijecs.pdf [14]
https://www.ijarcce.com/upload/2016/february-16/IJARCCE%2062.pdf
[15] http://ijmcs.info/current_issue/IJMCS160837.pdf [16] Classification and Prediction of Future Weather by using
Back Propagation Algorithm-An Approach by Sanjay D. Sawaitul, Prof. K. P. Wagh, Dr.P. N. Chatur Government College of Engineering, Amravati, Maharashtra, India
[17] Divyachuan ., jawaharthakur ., “Data mining techniques
for weather prediction: A review”/ International journal on recent and innovation trends in computing and communication, volume: 2 issue: 8, 2014.
[18] An Efficient Weather Forecasting System using Artificial
Neural Network by Dr. S. Santhosh Baboo and I.KadarShereef. 7. Convective weather forecast accuracy analysis at center and sector levels by yaowang and banavarsridhar, nasaames research center, moffett field, California.
[19] Artificial Neural Networks’ Application in Weather
Forecasting – Using RapidMiner by A Geetha, G M Nasira ,Mother Teresa Women’s University ,Kodaikanal.
[20] SaurabhKarsoliya, “Approximating Number of Hidden
layer neurons in Multiple Hidden Layer BPNN Architecture”, International Journal of Engineering Trends and Technology- Volume3Issue6- 2012, pp 714- 717.
[21] https://www.ijircce.com/upload/2016/december/44_