Journal of Chemical and Pharmaceutical Research, 2014, 6(7):361-370
Research Article
CODEN(USA) : JCPRC5
ISSN : 0975-7384
Design and reliability analysis of large-scale multi-level sampling plan
Lihong Li, Yan Li*, Jie Sun and Qinghua Liu
College of Science, Hebei United University, Tangshan, Hebei, China
_____________________________________________________________________________________________
ABSTRACT
In order to establish the additional method of single objective layer composite PPS sample the permanent random technique was used in a set of multi-objective hierarchical design scheme. Yves g. Berger (2005) research was used instead of Hajek estimator for HT estimate variance estimators. Simple analysis was carried out on the sampling error.
Keywords: Sampling survey; multilevel; stratified sampling; error analysis; additional PPS sample method
_____________________________________________________________________________________________
INTRODUCTION
Hierarchical sampling survey method versatilely uses a sample and improved the utilization rate of it, which is a major tool in large-scale data collection and analysis [1]. China has implemented hierarchical management system on the government survey in economy, population, agriculture, etc. More and more cases are inseparable from the stratified sampling, and therefore a suitable design of the hierarchical sampling program is necessary [2-5].
Currently, investigating solutions of the problem in hierarchical estimation methods are mainly direct and indirect estimation methods. Direct estimation methods are layers of sampling method, ABC method and the sample addition method [6-7]. Layers of sampling and sample design using ABC method have great limitations in practical applications because they require that all levels should be investigated which contrary to consume large sample survey economic advantage [8-11]. Additional samples’ sampling method is a bottom-up design idea, and it is to meet the level of the target variable estimation sample additional ways to the next level of the target variable estimation accuracy required on the basis of need, which can satisfy sample survey of actual demand. Indirect estimation method is to fully exploit the existing sample information, make full use of indirect information and data improve all levels of the estimated amount of the target variable [12-15].
This paper introduced the basics of stratified sampling, followed by an additional method using sample design, and the design of the program in evaluation and optimization.
STRATIFIED SAMPLING
The definition of stratified sampling
Stratified sampling first stratify the unit according to certain general sign, and then several layers according to the principles of randomly selected sample units into the sample. Sample units drawn from the layers constitute the total
sample. Suppose there are N units overall
π
N=
{
Y
1,
Y
2,...,
Y
N}
, stratify the unit k layers according to certaingeneral sign, the
h
(
h
=
1
,
2
,...
k
)
layerπ
Nh hasN
h units, that is∑
=
kN
From
h
(
h
=
1
,
2
,...
k
)
layer siphonn
i units to constitute a sub-sample of theh
layer:(
h h hni)
hi
y
y
y
y
=
1,
2,...,
,
(
h)
n
i
=
1
,
2
,...,
All the sub-samples are the overall sample:
( )
(
)
U
k
i
k
i i n
i
y
y
y
n
n
y
y
1 1
2
1
,
,...,
,
=
∑
==
=
=
Sample append method
Process of additional sample is divided in three steps: first we need to determine the overall sample, followed by determining the sample size, and the third to determine additional sampling methods.
Suppose overall units are U, in certain initial sample
S
p, initial sample size isn
p, there are two additional strategies:(1)Replace the additional. Additional sampling during the initial samples have been returned to the sampling
frame, additional sampling during the whole sampling remains U;
(2)Additional without replacement. Additional sampling during the initial sample without replacement sampling
frame, additional sampling during the whole sampling is
U /
S
p.For multi-phase sampling, the situation is more complex, the type of additional stages may have different policies.
Sample estimation method
Different additional sampling and sample methods can take two estimation methods, namely the weighted estimate, another is estimated HT.
If we obtain parameter estimates
θ
ˆ
p of parameterθ
using initial sampleS
p, and unbiased estimatesθ
ˆ
c ofparameter
θ
using additional sampleS
c, then the final estimated isθ
ˆ
=
a
θ
ˆ
p+
(
1
−
a
) (
θ
ˆ
c,
0
≤
a
≤
1
)
which isweighted average of
θ
ˆ
p andθ
ˆ
c.HT estimates are generally used in sampling without replacement unit will not be repeated when pumped. When there is an additional sampling besides sampling is not put back twice, and the strategy is not added back in, the unit will not be able to get repeated in other cases, cells are likely to be repeated pumped.
In fact, regardless of whether the unit may be able to get repeated, we can take the HT estimates. Using HT estimate for overall Y:
∑
=
=
'1
ˆ
ni i i m
y
Y
π
Among them
n
' represents the effective sample size,π
i represents probability eventually being able to get ofunit i, called final probability sample. We use
π
pisaid in the initial probability sampling unit i is pumped, called it into initial probability,π
ci called chase join probability. When additional sampling and initial sampling are independent:(
)
(
)
ci pi ci pi
ci pi
i
π
π
π
π
π
π
π
−
+
=
−
−
−
=
1
1
1
When additional strategy is not put back when, according to the probability of incompatible events additive:
ci pi i
π
π
When additional strategy is back, but additional sampling and initial sampling are not independent, the relationships
of
π
iand
π
pi,
π
iand
π
ciare not clear.Define the indicator function:
(
)
(
)
∉
∈
=
S
i
S
i
I
i0
1
。When additional sampling and initial sampling are independent,
(
) (
)
(
)
(
)(
)
(
)
(
ci cj)
cij(
pi pj)
pij cij pij ci pj cj pj cij cj ci pij pj pj ci pi ci pi ci pi ci pi j i j i
ij
P
I
I
π
π
π
π
π
π
π
π
π
π
π
π
π
π
π
π
π
π
π
π
π
π
π
π
π
π
π
π
π
−
−
+
−
−
+
+
+
+
+
+
=
+
−
−
+
−
−
+
−
−
−
+
+
−
+
=
=
=
+
−
+
=
1
1
1
1
1
0
,
0
1
When additional sampling and initial sampling are not independent, there is no clear formula of
π
ij.In different methods of sampling and sample additional, two estimation methods are considered. As to which method is better depends on the general characteristics and overall or domain-specific sampling and sample additional methods.
PROGRAM DESIGN Sample survey targets
The case is based on 2012 statistics, Hebei Province, rural food production as the original survey data. In the survey, we chose Hebei Province, Chengde City, Qinhuangdao City as a sub-population surveys and investigations in general to form a hierarchical sampling. All the survey sample size is at 95% confidence level, and the target amount for each research domain absolute error does not exceed 5% of the limit determined by the premise.
The overall sample and the cell
In order to facilitate convergent with national sample surveys, we selected 171 counties in Hebei Province as the survey sampling design of the survey period. 171 samples of all county towns are the overall design of the sample, and each township is a investigation unit.
Sampling methods
The whole process will use the PPS random systematic sampling method. First part of the 11 municipalities in Hebei Province is the first level; each survey counties and municipalities as a second level; each county under the
jurisdiction of the township streets as the third level. After determining the sample size n, we takeM0( =
∑
iM
M0 ,
i
M
measure the size of each unit)divide n get the sampling interval K. We draw a random number R between 1--K,
the range in which the amount of the sample is drawn, the rest of the sample interval of time plus the selected K. The
probability into a sample is
Z
i=
M
i/ M
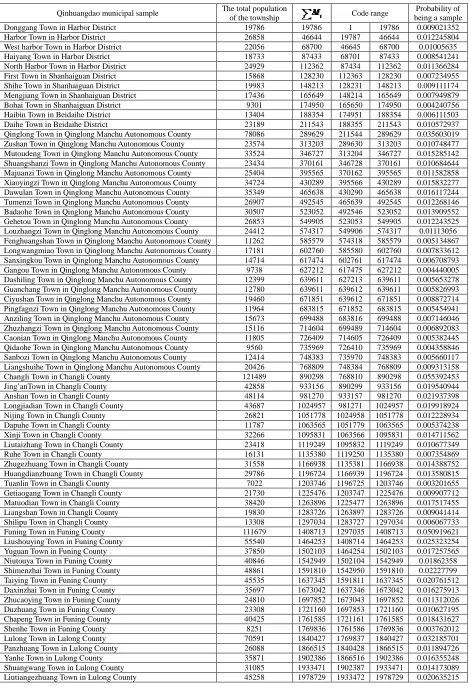
0.Qinhuangdao city with a select sample as an example, withdrawn from the sample size n =62 PPS sample. Sampling intervalK=M0/n,R∈
( )
1,K ,we suppose R=30000. In the harbor town harbor area code range, the sample is drawn,Table 1 Qinhuangdao municipal sample selection process table
Qinhuangdao municipal sample The total population
of the township Code range
Probability of being a sample
Donggang Town in Harbor District 19786 19786 1 19786 0.009021352
Harbor Town in Harbor District 26858 46644 19787 46644 0.012245804
West harbor Town in Harbor District 22056 68700 46645 68700 0.01005635
Haiyang Town in Harbor District 18733 87433 68701 87433 0.008541241
North Harbor Town in Harbor District 24929 112362 87434 112362 0.011366284
First Town in Shanhaiguan District 15868 128230 112363 128230 0.007234955
Shihe Town in Shanhaiguan District 19983 148213 128231 148213 0.009111174
Mengjiang Town in Shanhaiguan District 17436 165649 148214 165649 0.007949879
Bohai Town in Shanhaiguan District 9301 174950 165650 174950 0.004240756
Haibin Town in Beidaihe District 13404 188354 174951 188354 0.006111503
Daihe Town in Beidaihe District 23189 211543 188355 211543 0.010572937
Qinglong Town in Qinglong Manchu Autonomous County 78086 289629 211544 289629 0.035603019 Zushan Town in Qinglong Manchu Autonomous County 23574 313203 289630 313203 0.010748477 Mutoudeng Town in Qinglong Manchu Autonomous County 33524 346727 313204 346727 0.015285142 Shuangshanzi Town in Qinglong Manchu Autonomous County 23434 370161 346728 370161 0.010684644 Majuanzi Town in Qinglong Manchu Autonomous County 25404 395565 370162 395565 0.011582858 Xiaoyingzi Town in Qinglong Manchu Autonomous County 34724 430289 395566 430289 0.015832277 Dawulan Town in Qinglong Manchu Autonomous County 35349 465638 430290 465638 0.016117244 Tumenzi Town in Qinglong Manchu Autonomous County 26907 492545 465639 492545 0.012268146 Badaohe Town in Qinglong Manchu Autonomous County 30507 523052 492546 523052 0.013909552 Gehetou Town in Qinglong Manchu Autonomous County 26853 549905 523053 549905 0.012243525 Louzhangzi Town in Qinglong Manchu Autonomous County 24412 574317 549906 574317 0.01113056 Fenghuangshan Town in Qinglong Manchu Autonomous County 11262 585579 574318 585579 0.005134867 Longwangmiao Town in Qinglong Manchu Autonomous County 17181 602760 585580 602760 0.007833612 Sanxingkou Town in Qinglong Manchu Autonomous County 14714 617474 602761 617474 0.006708793 Gangou Town in Qinglong Manchu Autonomous County 9738 627212 617475 627212 0.004440005 Dashiling Town in Qinglong Manchu Autonomous County 12399 639611 627213 639611 0.005653278 Guanchang Town in Qinglong Manchu Autonomous County 12780 639611 639612 639611 0.005826993 Ciyushan Town in Qinglong Manchu Autonomous County 19460 671851 639612 671851 0.008872714 Pingfagnzi Town in Qinglong Manchu Autonomous County 11964 683815 671852 683815 0.005454941 Anziling Town in Qinglong Manchu Autonomous County 15673 699488 683816 699488 0.007146046 Zhuzhangzi Town in Qinglong Manchu Autonomous County 15116 714604 699489 714604 0.006892083 Caonian Town in Qinglong Manchu Autonomous County 11805 726409 714605 726409 0.005382445 Qidaohe Town in Qinglong Manchu Autonomous County 9560 735969 726410 735969 0.004358846 Sanbozi Town in Qinglong Manchu Autonomous County 12414 748383 735970 748383 0.005660117 Liangshuihe Town in Qinglong Manchu Autonomous County 20426 768809 748384 768809 0.009313158
Changli Town in Changli County 121489 890298 768810 890298 0.055392453
Jing’anTown in Changli County 42858 933156 890299 933156 0.019540944
Anshan Town in Changli County 48114 981270 933157 981270 0.021937398
Longjiadian Town in Changli County 43687 1024957 981271 1024957 0.019918924
Nijing Town in Changli County 26821 1051778 1024958 1051778 0.012228934
Dapuhe Town in Changli County 11787 1063565 1051779 1063565 0.005374238
Xinji Town in Changli County 32266 1095831 1063566 1095831 0.014711562
Liutaizhang Town in Changli County 23418 1119249 1095832 1119249 0.010677349
Ruhe Town in Changli County 16131 1135380 1119250 1135380 0.007354869
Zhugezhuang Town in Changli County 31558 1166938 1135381 1166938 0.014388752
Huangdianzhuang Town in Changli County 29786 1196724 1166939 1196724 0.013580815
Tuanlin Town in Changli County 7022 1203746 1196725 1203746 0.003201655
Getiaogang Town in Changli County 21730 1225476 1203747 1225476 0.009907712
Matuodian Town in Changli County 38420 1263896 1225477 1263896 0.017517455
Liangshan Town in Changli County 19830 1283726 1263897 1283726 0.009041414
Shilipu Town in Changli County 13308 1297034 1283727 1297034 0.006067733
Funing Town in Funing County 111679 1408713 1297035 1408713 0.050919621
Liushouying Town in Funing County 55540 1464253 1408714 1464253 0.025323254
Yuguan Town in Funing County 37850 1502103 1464254 1502103 0.017257565
Niutouya Town in Funing County 40846 1542949 1502104 1542949 0.01862358
Shimenzhai Town in Funing County 48861 1591810 1542950 1591810 0.02227799
Taiying Town in Funing County 45535 1637345 1591811 1637345 0.020761512
Daxinzhai Town in Funing County 35697 1673042 1637346 1673042 0.016275913
Zhucaoying Town in Funing County 24810 1697852 1673043 1697852 0.011312026
Duzhuang Town in Funing County 23308 1721160 1697853 1721160 0.010627195
Chapeng Town in Funing County 40425 1761585 1721161 1761585 0.018431627
Shenhe Town in Funing County 8251 1769836 1761586 1769836 0.003762012
Lulong Town in Lulong County 70591 1840427 1769837 1840427 0.032185701
Panzhuang Town in Lulong County 26088 1866515 1840428 1866515 0.011894726
Yanhe Town in Lulong County 35871 1902386 1866516 1902386 0.016355248
Shuangwang Town in Lulong County 31085 1933471 1902387 1933471 0.014173089
Shimen Town in Lulong County 44380 2023109 1978730 2023109 0.020234894
Xiazhai Town in Lulong County 21642 2044751 2023110 2044751 0.009867589
Liujiaying Town in Lulong County 17235 2061986 2044752 2061986 0.007858234
Chenguantun Town in Lulong County 28349 2090335 2061987 2090335 0.01292562
Yinzhuang Town in Lulong County 28856 2119191 2090336 2119191 0.013156785
Habo Town in Lulong County 29331 2148522 2119192 2148522 0.013373359
Mujing Town in Lulong County 44719 2193241 2148523 2193241 0.02038946
Determination of sample size
In the survey, the sample size of the survey is all at 95% confidence level, the target amount for each research domain absolute error limit does not exceed 5% of the premise determined.
The population census in 2010 as auxiliary variables, we use PPS systematic sampling.
Using the formula:
n
P
(
1
P
)
/
(
e
/
Z
P
(
1
P
)
/
N
)
2
+
−
−
=
Calculated sample size of Hebei Province, Chengde and Qinhuangda. Hebei Province-level sample size =475
Chengde municipal sample size =124 Qinhuangdao municipal sample size =55 Sampling ratio: 24.25%
Determine the estimated amount
In this paper, using traditional Hansen - Hurwitz (HH) estimator,
The overall amount was estimated:
∑
==
n i i i HHZ
Y
n
Y
11
ˆ
Sampling variance:
( )
( )
21
ˆ
1
1
ˆ
ˆ
∑
=
−
−
=
n i HH i i HHY
Z
y
n
n
Y
v
Confidence level of 95% confidence interval:
( )
HH aHH
Z
v
Y
Y
ˆ
ˆ
ˆ
2
±
The overall mean estimate of:
∑
==
n i i i PPSZ
y
Nn
Y
11
ˆ
Variance estimator is:
( )
( )
21 2
ˆ
1
1
ˆ
ˆ
∑
=
−
−
=
n i PPS i i PPSY
Z
y
n
n
N
Y
v
PROGRAM IMPLEMENT Progress of program implementStep one:Hebei general confer permanent random number. Using random starting point equidistant PPS sampling
method chooses the initial sample of Hebei Province, and calculates first-order inclusion probabilities.
Step two: The same sample using the above method to remove Chengde and Qinhuangdao City, in this selection, we need to remove selected samples in first step. And calculate the probability enrolled in the overall sample.
Step three: Chengde, Qinhuangdao selected samples combined with the first step as the final stage of the cell sample of the beginning of Hebei Province.
Step Five: Calculate the Chengde, Qinhuangdao, Hebei Province, the total estimated amount of food production and value of variance estimators.
Stratified sample survey
Detailed results of the various indicators are list:
Tables 2 2012 Hebei province's total grain output sample data
Unit: tonne
Chengde City Qinhuangdao City Hebei Province
Estimates 1310701 816959 32845843
Average variance estimates 123485 13177 820582
Actual statistics 1336367 786108 37889069
Test value 0.02702 0.01938 0.00365
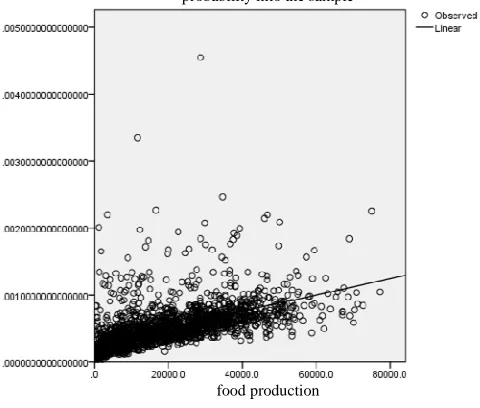
To illustrate the effectiveness of this sampling program, we will combine the province's grain output actual food production and the province with the kind of probability sampling and test for comparison chart(Fig1, Fig2, Fig3):
probability into the sample
[image:6.595.163.449.156.211.2]food production
Fig. 1: Actual food production
probability into the sample
food production
[image:6.595.172.412.264.468.2]Blue point:probability into the sample- food production of sample estimates
[image:7.595.192.423.80.320.2]Green point:probability into the sample- food production of sample
Fig. 3: Test for comparison chart
Figure 1 for the province in which the actual food production in the scatter diagram into a kind of total probability, figurer 2 for the province's grain output sample distribution probability samples in total income. By comparing the two figures can be found the sample roughly match the actual number of distribution. Figure 3 is scatter plot in which the sample under the same probability sample estimate of actual food production and food production sample comparison. This figure can be observed that the estimated value and the actual value of roughly the same, but there are some differences. In order to more accurately estimate the reliability of the samples obtained, we further analyzed.
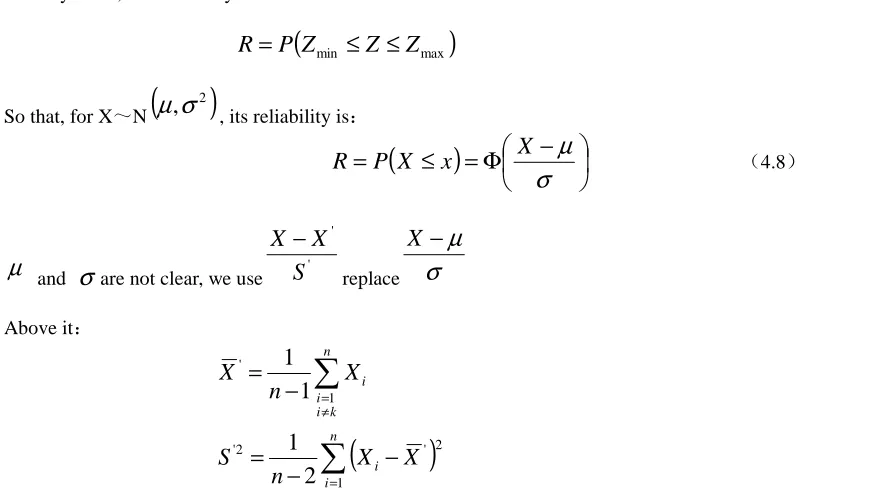
In many cases, the reliability is defined:
R
=
P
(
Z
min≤
Z
≤
Z
max)
So that, for X~N
(
)
2
,
σ
µ
, its reliability is:
(
)
−
Φ
=
≤
=
σ
µ
X
x
X
P
R
(4.8)µ
andσ
are not clear, we use ' 'S
X
X
−
replace
σ
µ
−
X
Above it:
∑
≠ =
−
=
nk i i
i
X
n
X
1 '
1
1
(
)
∑
=
−
−
=
ni
i
X
X
n
S
1
2 ' 2
'
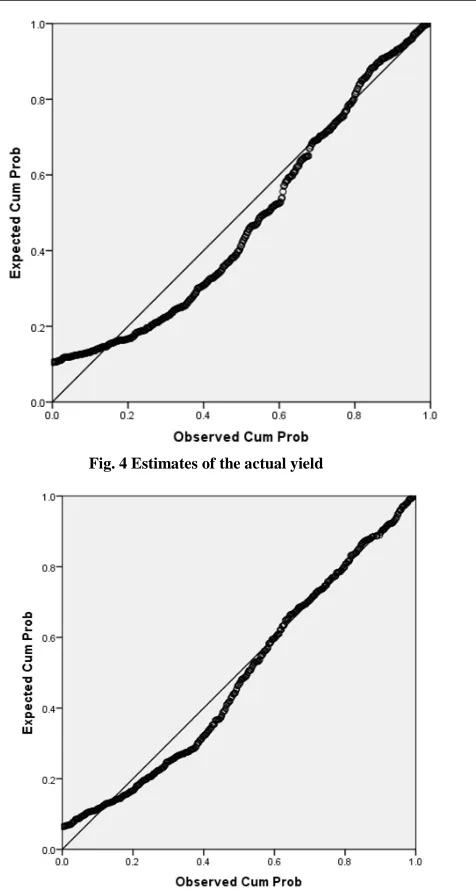
[image:7.595.70.510.473.722.2]
Fig. 4 Estimates of the actual yield
Fig. 5 Estimates of the grain samples
R=0.789。After calculation, the reliability of the findings R = 0.789, which proves the credibility of the findings
between 75% and 80%. The result has some representation, but its accuracy needs improving.
PROGRAM IMPROVING
Improvement program using Hajek estimator method[14] instead of variance estimator method.
The total estimated amount is:
∑
∈ −
=
s i
i i
y
T
ˆ
π
1Variance estimator is:
( )
−
−
=
∑
∈
− −
s i
i
i
d
G
y
n
n
2 1 1 22
ˆ
ˆ
1
ˆ
π
π
σ
Among it:
(
)
∑
∈
−
=
s i
i
d
ˆ
1
π
∑
(
)
∈
−
−
=
s i
i i i
y
d
G
1
1ˆ
1
Where S is the sample collection,
y
i is statistical variables,π
i is a first-order inclusion probabilities.Table 3: Improved statistical results and actual statistical results table
Unit: tonne
Hebei Province Chengde City Qinhuangdao City
Estimates 39975816 1306819 660034
Average variance estimates 1835920.84 110074.33 32643.52
Actual statistics 37889069 1336367 786108
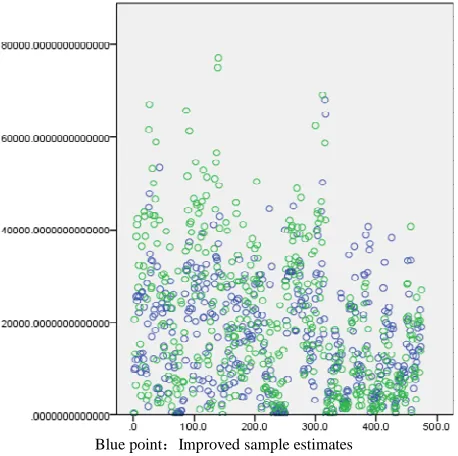
Using Hajek estimation method the improved sample food production estimates and actual food production sample comparison chart (figure 6) and sample food production estimates figure (figure 7) are as follows:
Blue point:Improved sample estimates
Green point:Improved food production of sample
[image:9.595.194.427.216.697.2]Fig. 6: Comparison chart
Fig. 7: Sample food production estimates
[image:9.595.206.434.466.706.2]CONCLUSION
Through statistical results, the conclusions were as follows:
All the survey results were within the permissible error range, which explained that additional PPS sampling method of random sample was feasible.
The conclusion that when using HH estimation sampling the results of its reliability was 75% to 80% was obtained through reliability analysis of the samples. While when estimating the reliability of estimated amount by using Hajek the reliability was 80% to 85%. The precision was slightly higher.
Acknowledgement
Supported by National Science Fund of China (NO.61370168), National Science Fund of Hebei Province China (NO.A2012209030)
REFERENCES
[1]Zhou Q Y. Statistics and Decision, Vol 1, 14-15, 2014.
[2]You X M. Science and Technology Information, Vol 20, 191-213, 2007.
[3]Liu H Y. On Multi-objective Stratified Sampling Method and Its Application. Xi’an: Xi'an University of Finance,
2010: 7-13.
[4]Jin Y J,Zhao X H. Statistical Research, Vol 12, 55-56, 2003.
[5]Fan H K, Zhang F M. A. Journal of Nankai University. v 37, n 4, 44-47, 2004.
[6]Lu Z H, He C Y, Tao H. Number of Economic Research Technology, vol 4, 60-65, 2005.
[7]Zhang Y, Zeng Y P, Wang F X. National Bureau of Statistics Education Center, v 20, n 2, 28-29, 2005. [8]Jin Y J. Non-sampling Errors’ Analysis. China Statistics Press, 1996: 228-233.
[9]Feng S Y, Sample Survey Theory and Methods, China Statistics Press, 1998:25-30. [10]Lv P. Statistics and Decision. 2012: 9-11.
[11]Cao Z G, Yang J X, Niu J L. Hebei Rural Statistical Yearbook, 2013.
[12]Lin C S. Complex Multi-objective Hierarchical Sampling Design Research. Xiamen: Xiamen University,
2006.47-57.
[13]Zhao J K. Survey Sampling Theory and Methods. China Statistics Press, 2002:212-236. [14]Hajek, Ann. Math. Statist. Vol 35, 1491-1523, 1964.