R E S E A R C H A R T I C L E
Open Access
A systematic review of the clinical
application of data-driven population
segmentation analysis
Shi Yan
1, Yu Heng Kwan
2, Chuen Seng Tan
3, Julian Thumboo
4and Lian Leng Low
5*Abstract
Background:Data-driven population segmentation analysis utilizes data analytics to divide a heterogeneous
population into parsimonious and relatively homogenous groups with similar healthcare characteristics. It is a promising patient-centric analysis that enables effective integrated healthcare interventions specific for each segment. Although widely applied, there is no systematic review on the clinical application of data-driven population segmentation analysis.
Methods:We carried out a systematic literature search using PubMed, Embase and Web of Science following
PRISMA criteria. We included English peer-reviewed articles that applied data-driven population segmentation analysis on empirical health data. We summarized the clinical settings in which segmentation analysis was applied, compared and contrasted strengths, limitations, and practical considerations of different segmentation methods, and assessed the segmentation outcome of all included studies. The studies were assessed by two independent reviewers.
Results:We retrieved 14,514 articles and included 216 articles. Data-driven population segmentation analysis was
widely used in different clinical contexts. 163 studies examined the general population while 53 focused on specific population with certain diseases or conditions, including psychological, oncological, respiratory, cardiovascular, and gastrointestinal conditions. Variables used for segmentation in the studies are heterogeneous. Most studies (n= 170)
utilized secondary data in community settings (n= 185). The most common segmentation method was latent
class/profile/transition/growth analysis (n= 96) followed by K-means cluster analysis (n= 60) and hierarchical analysis (n= 50), each having its advantages, disadvantages, and practical considerations. We also identified key criteria to evaluate a segmentation framework: internal validity, external validity, identifiability/
interpretability, substantiality, stability, actionability/accessibility, and parsimony.
Conclusions: Data-driven population segmentation has been widely applied and holds great potential in
managing population health. The evaluations of segmentation outcome require the interplay of data analytics and subject matter expertise. The optimal framework for segmentation requires further research.
Keywords: Systematic review, Population segmentation, Data analytics, Population health, Public health,
Health policy, Health services research
* Correspondence:[email protected]
5Family Medicine and Continuing Care, Singapore General Hospital, Outram
Road, Bowyer Block, Block A, Level 2, Singapore 169608, Singapore Full list of author information is available at the end of the article
Background
Globally, there has been a growing interest in population health and integrated health systems, which aim to organize health services across the care continuum around the needs of individuals, with the ultimate goal to improve the overall health of population by more
tar-geted, effective, and coordinated healthcare services [1–
3]. This patient-centered approach empowers healthcare
systems to have a deeper understanding of population heath needs, prioritize health intervention programs, and facilitate effective and targeted healthcare resource
planning [4]. Given the global trend of rapidly aging
populations and mounting chronic disease burden, the management of population health becomes challenging in view of increasing healthcare services utilization and escalating health-related expenditure, making healthcare
resources increasingly strained [5–7]. Therefore, it is
im-perative to develop more effective healthcare models with health initiatives that are tailored to the specific
healthcare needs of a population [8–10].
While it is practically prohibitive, at population health
policy level, to address each individual’s widely different
care needs in a heterogeneous population, they can be segmented into distinct subgroups, each of which has relatively homogeneous health characteristics and
phys-ical, psychologphys-ical, and social needs [8]. This concept of
population segmentation allows population health pol-icies to develop and organize around these population segments, with different care programs tailored to each
segment [11]. In a healthcare system, population
seg-mentation analysis can facilitate more effective health-care resource planning and evidenced-based policy
making [12]. A recent study that followed 200 patients
in a program that used segmentation to deliver highly tailored health interventions for one year showed a 32% reduction in the utilization of emergency care with high
level of patient satisfaction [13].
Broadly, two major approaches for population segmenta-tion have emerged over the years. Expert-driven approaches segment a population by a-priori, experts-defined criteria based on literature review and consensus, while data-driven
approaches utilizepost-hoc statistical analysis such as
clus-tering analysis and latent class analysis on empirical data. For example, the Clinical Risk Group system by 3 M classi-fies patient population into one of over 200 mutually exclu-sive risk groups based on an expert-defined hierarchical system of classification where greater weightage is given to
patients’highest morbidity diseases [14]. Senior
Segmenta-tion Algorithm developed by Kaiser Permanente for elderly persons is another example of expert-driven population
segmentation whereby population is divided into “robust
seniors without chronic conditions”, “seniors with one or
more chronic conditions”, “seniors with advanced illness
and end-organ failure”,“seniors with advanced frailty or at
the end of life”groups [12]. As expected, there is no widely
generalizable expert-defined criteria on determining the op-timal number of segments, selecting the variables to be used for segmentation, and defining the segments for differ-ent populations of interest.
More recently, the wide adoption of electronic health re-cords (EHRs) in healthcare systems, coupled with the advancement in big data analytics, makes rich healthcare data more accessible and provides opportunities to utilize
empirical data for population segmentation analysis [8].
Data-driven population segmentation is increasingly gaining interest as it generates detailed and quantitative insights from large volumes of population healthcare data that support
evidence-based policy decisions on population health [6]. For
example, Van der Laan et al. applied latent class analysis on self-reported biological, psychological, functional and social variables to segment a general elderly population and dem-onstrated differential healthcare service utilization patterns
across segments [7]. A recent paper by Vuik et al. also
dem-onstrated the utility of data-driven clustering analysis to seg-ment a general patient population using healthcare
utilization data from administrative databases [6].
Given that the data-driven population segmentation is gaining more popularity and its potential value is increas-ingly appreciated, more studies are expected to emerge in the field of population health in the near future. However, there is little consensus, if any, on the optimal segmenta-tion approach or framework. This paper aims to systemat-ically retrieve and review the existing literature on the clinical application of data-driven population segmenta-tion analysis and summarize the populasegmenta-tions of interest subject to segmentation analysis, the variables used for segmentation and their data sources, the various segmen-tation objectives and methods, and the evaluation of de-rived segmentation outcome.
Methods
Study design
We performed a systematic review in accordance to the Preferred Reporting Items for Systematic review and Meta-Analysis (PRISMA) checklist. Our study did not involve human subjects and is exempted from Institu-tional Review Board approval.
Search strategies
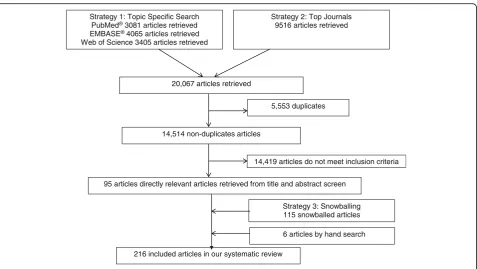
We employed three arm search strategies to obtain a com-prehensive capture of potentially relevant articles for this systematic review: literature databases, top journals, and
snowballing (Fig.1). First, the PubMed, Embase, and Web
of Science databases were searched from 1965 up to 15th November 2017. In our search strategy, we included the key terms typolog* OR stratif* OR segment* OR categor*
OR“cluster analysis”OR cluster* OR pattern* OR profil*
search terms in the PubMed® Topic Specific Query
“Population Health”category (Additional file1). The same
search strategy was adapted for Embase and Web of Science. As a second search strategy, we searched amongst top 50 journals in public health and top 3 journals in popula-tion health (top journals) according to impact factors in 2016 by SCImago Scientific Journal Rankings and InCites Journal
Citation Reports (Additional file 2). Thirdly, we manually
reviewed the bibliographies of all eligible full-text studies from the first two search strategies to identify additional or missing studies (snowballing). Further hand searches were also conducted.
Eligibility criteria
The inclusion criteria were full-text original studies pub-lished in English that used data-driven population seg-mentation analysis on empirical data. An important inclusion criterion to meet is that the segmentation methods had to be applied to real-life datasets and not theoretical, hypothetical, or simulated ones. Meta-analysis, case series, case reports and reviews were excluded. Arti-cles that were not in English, not on human subjects, and articles that are solely expert-driven were also excluded.
Selection of studies
After duplicate articles were removed using the End-Note, version X8, two independent researchers (S.Y. and Y.H.K.) reviewed the abstracts of retrieved studies for in-clusion and discussed when discrepancies arose. Next,
the full-text studies were independently read and assessed for eligibility by the two researchers. In the case of disagreement in the selection process, any discord was resolved by discussion with an independent re-searcher (L.L.L.).
Data extraction
Once the article was deemed to be eligible, data from eligible articles were extracted independently by two re-searchers (S.Y. and Y.H.K.) using a standardized data ex-traction format. The following data were extracted from the included studies: title, year of publication, popula-tions studied (including population size and country), segmentation objectives, variables used for segmentation (including data sources and settings of study), segmenta-tion methods used, number of segments derived and variables used for external validation of segmentation outcome.
Data presentation
We summarized the characteristics of target populations in the included articles, including population inclusion cri-teria, sample size, and geographical region. This gave an overview of populations on which data-driven segmenta-tion analysis has been applied. We also presented the data sources (primary data or secondary) and settings (commu-nity-based or from healthcare institutions) to facilitate fu-ture research data acquisition for population segmentation. We identified themes of segmentation objectives to present Strategy 1: Topic Specific Search
PubMed®3081 articles retrieved
EMBASE®4065 articles retrieved
Web of Science 3405 articles retrieved
20,067 articles retrieved
95 articles directly relevant articles retrieved from title and abstract screen 5,553 duplicates
14,514 non-duplicates articles
14,419 articles do not meet inclusion criteria
216 included articles in our systematic review
Strategy 3: Snowballing 115 snowballed articles Strategy 2: Top Journals
9516 articles retrieved
6 articles by hand search
an overview of the clinical application and utility of data-driven segmentation. We summarized the major ad-vantages and disadad-vantages of commonly used statistical methods for population segmentation (used by more than 10 studies included in this systematic review) to aid future researchers in the selection of these methods. Finally, we presented a set of criteria useful to evaluate the quality of segmentation results of the included articles.
Data availability statement
All data generated or analysed during this study are cluded in this published article and its supplementary in-formation files.
Results
As shown in Fig. 1, 14,514 articles were retrieved from
Search Strategy 1 and 2 after removing 5553 duplicates. After an abstract screen, 14,419 articles that do not ful-fill inclusion criteria were removed, yielding 95 articles. Snowballing was carried out for the 95 articles identified, which yielded 115 additional articles. The hand search added 6 more articles. The final number of articles in-cluded for full text review was 216. The percentage agreement between S.Y. and Y.H.K. was 90%. The infor-mation on populations of interest subject to segmenta-tion analysis, includes populasegmenta-tion size, country/region, data sources and study settings are summarized in
(Add-itional file 3). The objective of segmentation, variables
used for segmentation, statistical methods and software packages, number of derived segments and their names
are presented in (Additional file4).
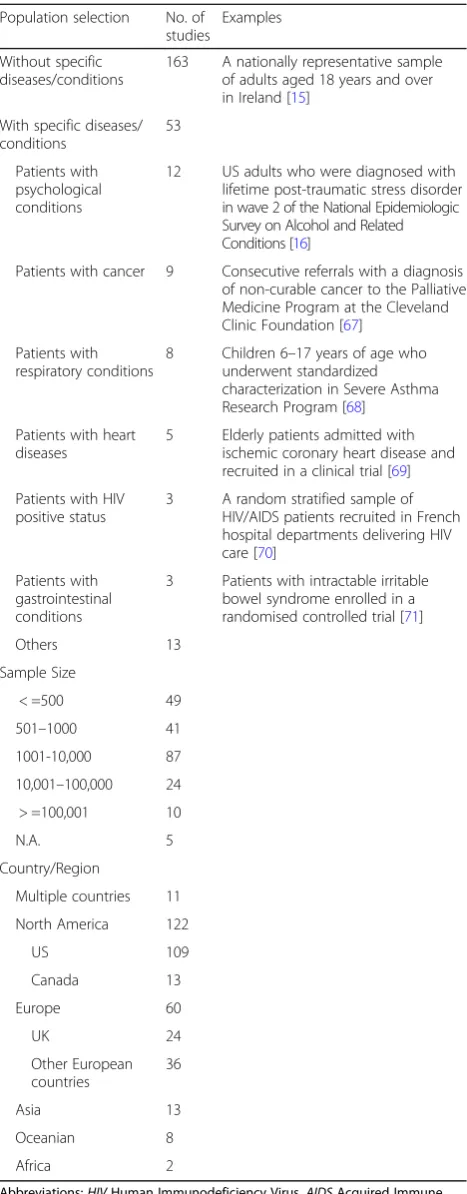
Population studied
As shown in Table 1, the studies can be broadly
clas-sified into those that segment the general population and those that target specific populations with certain diseases or conditions (e.g. individuals who have respira-tory conditions such as asthma patients). Majority of the
studies (n= 163) included general population as the target
population for segmentation. For example, Conry et al. segmented a cross-sectional, nationally representative sample of individuals aged 18 years and over by their
health behaviors [15]. Other studies (n= 53) restricted the
populations to the individuals with specific diseases or conditions. These studies can be further categorized into those that included individuals that have psychological
problems (n= 12), cancer (n= 9), respiratory conditions
(n= 8), heart diseases (n = 5), gastrointestinal conditions
(n= 3), HIV infections (n = 3), and other diseases and
con-ditions (n= 13). As an example, Pietrzak et al. only
in-cluded adults with the diagnosis of post-traumatic stress disorder from the US National Epidemiologic Survey on
Alcohol and Related Conditions [16].
Table 1Characteristics of target population subjected to
data-driven segmentation (n= 216)
Population selection No. of studies
Examples
Without specific diseases/conditions
163 A nationally representative sample of adults aged 18 years and over in Ireland [15]
With specific diseases/ conditions
53
Patients with psychological conditions
12 US adults who were diagnosed with lifetime post-traumatic stress disorder in wave 2 of the National Epidemiologic Survey on Alcohol and Related Conditions [16]
Patients with cancer 9 Consecutive referrals with a diagnosis of non-curable cancer to the Palliative Medicine Program at the Cleveland Clinic Foundation [67]
Patients with respiratory conditions
8 Children 6–17 years of age who underwent standardized characterization in Severe Asthma Research Program [68]
Patients with heart diseases
5 Elderly patients admitted with ischemic coronary heart disease and recruited in a clinical trial [69]
Patients with HIV positive status
3 A random stratified sample of HIV/AIDS patients recruited in French hospital departments delivering HIV care [70]
Patients with gastrointestinal conditions
3 Patients with intractable irritable bowel syndrome enrolled in a randomised controlled trial [71]
Others 13
Sample Size
< =500 49
501–1000 41
1001-10,000 87
10,001–100,000 24
> =100,001 10
N.A. 5
Country/Region
Multiple countries 11
North America 122
US 109
Canada 13
Europe 60
UK 24
Other European countries
36
Asia 13
Oceanian 8
Africa 2
The smallest number of sample is 42 by Simons-Morton et al. who divided a small group of teenagers into two
clus-ters by their risks of being involved in risky driving [17]. The
largest study has 492,306 individuals who participated in
NIH–AARP Diet and Health Study [18]. In terms of the
lo-cation of the studies, majority were conducted in North
America and Europe with US (n= 109) and UK (n= 27)
hav-ing the most number of the studies.
Segmentation variables, data sources and settings
Additional file4 summarized variables used for
segmen-tation analysis in the included studies. They are hetero-geneous depending on the segmentation objectives. To illustrate, Keel et al. segmented a population of patients with eating disorders using their symptom variables (e.g. self-induced vomiting) in order to empirically define
eat-ing disorder phenotypes [19]. Some used behavioral
vari-ables (e.g. tobacco use) to identify meaningful patterns
of health related behaviors [20–23]. Environment
fea-tures (e.g. public park density) were used by some au-thors to examine patterns of environment features and explore whether the environmental patterns explained health related behaviors and indicators (e.g. physical
ac-tivity and body mass index) in the neighborhood [24–
27]. Vuik et al. retrieved health service utilization data
(e.g. number of non-elective inpatient admissions) from administrative databases to segment a general patient population into homogenous groups with distinct
healthcare utilization patterns [6]. Many studies used
self-reported dietary intake variables (e.g. fiber intake) to
derive dietary patterns [28–34]
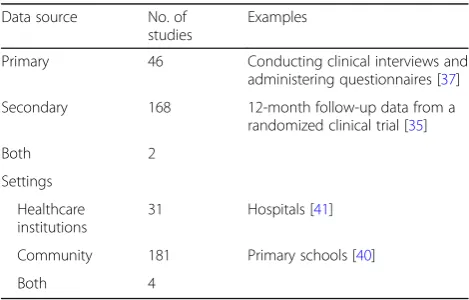
As for the sources of data, as shown in Table2, majority
(n= 170) utilized secondary data originally collected for
other research purposes or by someone other than the user (e.g. censuses, administrative databases, other studies with open datasets). One study by Fukuoka et al. retrieved 12-month follow-up data of a randomized clinical trial to identify patient subgroups based on cardiac symptoms after
cardiac events [35]. As an another example, Héroux et al.
utilized a subset of data on health behaviors from a pro-spective, observational study to observe the clustering of unhealthy diet, fitness, smoking, and excessive alcohol
con-sumption in adults [36]. 48 studies collected primary data
for the purpose of segmentation. To illustrate, researchers in a study conducted clinical interviews and administered questionnaires on post-traumatic stress disorder (PTSD) symptoms in order to identify subtypes of PTSD by
seg-mentation analysis [37]. Another study collected data by
telephone interviews of a sample of adults [38].
Most study settings are in the community (n= 185).
Gjelsvik et al. studied a sample of women who were re-cruited in a national survey by landline phone numbers
[39]. Another study was based on secondary data from a
school-based health intervention programs [40]. Some
studies were conducted in healthcare institutions. For example, Penrod et al. examined hip fracture patients
re-cruited from five hospitals in the US [41].
Objectives of segmentation
The recurring themes of population segmentation objectives in the included studies are: 1) Resource Allocation, 2) Health /Prognostic Index, 3) Health Grouping / Profiling, and 4)
Delivery of healthcare interventions (Table3). These themes
are overlapping and not mutually exclusive. Studies that
looked into Resource Allocation (n= 12) focused on
popula-tion’s overall medical utilization patterns, trends, and
expen-ditures. Those that aimed at Health/Prognostic Index (n=
17) generated health states that represented a person’s risk
profile (e.g. for inpatient admission days and mortality). Con-sistent with overarching theme of population segmentation,
all included articles (n= 216) focused on Health Grouping /
Profiling of their targeted population. Finally, many studies
also aimed at Delivery of healthcare interventions (n= 50)
that are specific and tailored for each population segment.
An example for each them is provided in Table 4. Many
studies addressed more than one of the above themes as
seen in (Additional file4).
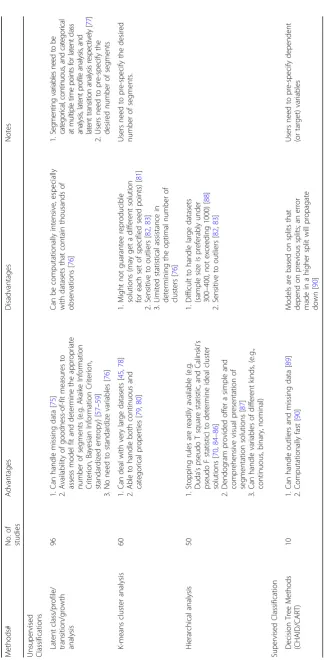
Segmentation methods
As seen in Table 4, the commonly used statistical
tech-niques are broadly divided into: 1) unsupervised classifica-tion whereby all independent (predictor or explanatory) variables are simultaneously considered, and there is no a-prior dependent (target) variables; and 2) supervised classification for which users need to pre-specify
dependent, or target variables [42] To illustrate, Hearty et
al. derived dietary patterns in an adult population using dietary intake as input segmenting variables by K-means cluster analysis which simultaneously considered all input variables to generate 6 dietary patterns (hence
inter-dependent segmentation) [43]. On the other hand, Leclerc
et al. performed a dependent segmentation - classification
Table 2Features of data used for data-driven population segmentation
Data source No. of studies
Examples
Primary 46 Conducting clinical interviews and administering questionnaires [37]
Secondary 168 12-month follow-up data from a randomized clinical trial [35]
Both 2
Settings
Healthcare institutions
31 Hospitals [41]
Community 181 Primary schools [40]
and regression tree analysis (CART) - which recursively splits a group of elderly into two subgroups between which a pspecified dependent variable (incidence of re-current faller) is distinct and independent variables (his-tory of falls in the past 3 months, Berg balance score, type of housing, alcohol consumption in the past 6 months
etc.) are homogeneous [44]. Unsupervised classification is
further categorized into: 1) algorithmic methods which
as-signs cluster membership to an individual using
distance-based approaches (e.g. K-means and hierarchical analysis) and 2) parametric methods (e.g, latent class ana-lysis and its extensions such as latent profile anaana-lysis) which assigns an individual to a cluster with, for example, the maximum posterior probability of membership.
The most widely used technique is latent class/profile/
transition/growth analysis (n= 96) followed by K-means
cluster analysis (n= 60) and hierarchical analysis (n=
50). The segmentation methods were not mutually ex-clusive; some used combined approaches (e.g. hierarch-ical cluster analysis first to determine the optimal number of clusters followed by K means clustering ana-lysis). Some, but not all included studies explicitly ex-plained the choice of a specific segmentation methods over the others. For instance, Croezen et al. explained K-means cluster analysis is the more suitable method when there are a large number of subjects as in their
study [45]. The major advantages and disadvantages of
commonly used statistical methods (used by more than 10 studies included in this systematic review) are listed
in Table3.
Segmentation outcome
The segmentation outcome of each study was assessed
and summarized in (Additional file5). The following
cri-teria adapted from consumer market segmentation were
used: internal validity(the fit between the cluster
struc-ture and data was assessed by data themselves. For ex-ample, one can split a sample into two random subsamples to both of which a cluster analysis is applied independently and the agreement between the two
clus-ter solutions is then assessed [46]), external validity(the
performance of segmentation was measured by matching a cluster structure to exogenous information). For ex-ample, segmentation analysis of dietary intake was vali-dated by demonstrating that individuals in different dietary pattern clusters had significant different body
mass index and serum total cholesterol level [47]),
iden-tifiability/interpretability (segments should be
recog-nized and interpreted easily), substantiality (each
segment should have sufficient size), stability(each
seg-ment should be relatively stable over time),
actionabil-ity/accessibility(each segment should be easily addressed and targeted with distinctive heath intervention
strat-egies) [48, 49]. As summarized in Table 5, most studies
fulfilled internal validity, identifiability/interpretability,
substantiality,and actionability/accessibility. 138 studies have assessed the external validity of the segmentation outcome by variables other than segmenting variables. For instance, Freeman et al. segmented patients with sleep disordered breathing in early childhood by symp-toms (e.g. snoring) and validated the segmentation out-come by demonstrating that the risks of tonsillectomies and wheezing frequency differed significantly across the
derived segments [50]. Another study divided a
popula-tion of adolescents using their physical activity and sed-entary behavioral variables by segmentation analysis, which was validated by its discriminative ability for the likelihood of meeting national activity recommendations
later in adulthood in each segment [51]. However, very
few studies (n= 10) assessed stability. We also included
parsimony as an additional criterion as the number of
segments should be reasonably small to facilitate policy planning and facilitate practical adoption of a segmenta-tion framework. Most studies derived less than 10 seg-ments. For example, Griffin et al. used data on health related behaviors (e.g. exercise, smoking, alcohol con-sumption, diet and cancer screening behaviors) to
clus-ter a cohort into 6 groups: “smokers”, “non-screeners”,
“higher risk ex-smokers” (did not exercise at
recom-mended levels and consumed with alcohol consumption
Table 3Objectives of segmentation
Objective (themes) No. of studies
Examples
Resource Allocation 12 Patients were grouped into segments with distinct care utilization, based on six utilization variables: non-elective inpatient admissions, elective inpatient admissions, outpatient visits, GP practice visits, GP home visits, and prescriptions, creating eight distinct care user types [6].
Health /Prognostic Index
17 Patients were divided into groups that will have similar risk of atrial fibrillation after coronary artery bypass graft, facilitating informed decision making regarding aggressive prophylaxis of atrial fibrillation [72].
Health Grouping / Profiling
216 Individuals were divided into groups based on their dietary patterns: ‘traditional fish eaters’,‘healthy eaters’, ‘average, less fish, less healthy’,‘Western’, ‘traditional bread eaters’, and‘alcohol users’[73].
Delivery of Healthcare Interventions
50 Participants in the Wellington Respiratory Survey were divided based on five distinct clinical phenotypes of airflow obstruction which may form the basis of a modified taxonomy for the disorders of airways obstruction and treatment specifically targeted at defined phenotypic groups, rather than asthma or COPD in general, which represents the current management approach [74].
above the sample mean and fruit and vegetable intake
below the mean)“lower risk ex-smokers”(engaged in
rec-ommended levels of exercise, undertook cancer screening, and consumed above average amounts of fruit and
vegeta-bles),“sedentary non-smokers”(did not exercise, had
aver-age fruit and vegetable intake, engaver-aged in cancer screening, and consumed the lowest amount of alcohol),
and “active non-smokers” (engaged in recommended
levels of exercise, undertook cancer screening, consumed more fruit and vegetables than other groups and relatively
less alcohol.) [52]. Newby et al. segmented a sample of
population into 5 clusters based on data on dietary intake:
“healthy”, “white-bread”, “alcohol”, “sweets”, and “
mea-t-and-potatoes”patterns [53].
Discussion
Data-driven segmentation analysis is widely used in health-care research. The 216 original research papers included in this systematic review covered various disciplines including respiratory medicine, psychiatry, gastroenterology, dietetics, oncology, cardiology, and public health. It was applied in various populations and clinical settings with difference population characteristics across the globe. The variables used for segmentation analysis vary substantially, depending on the availability of data, the objective of segmentation, and how researchers intend to measure individuals in the study sample. Clustering solutions depend on input variables. Therefore, researchers need to be particularly cognizant of the variables to be used for segmentation purposes, which
Table 5Segmentation outcome evaluations
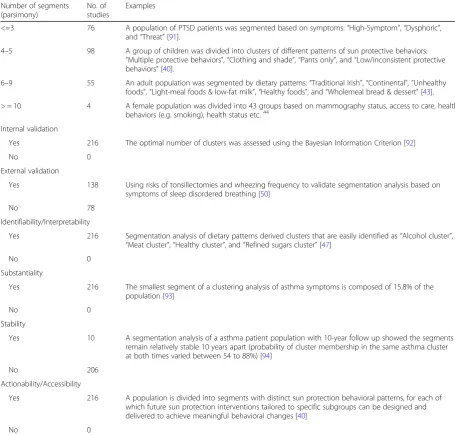
Number of segments (parsimony)
No. of studies
Examples
<=3 76 A population of PTSD patients was segmented based on symptoms:“High-Symptom”,“Dysphoric”, and“Threat”[91].
4–5 98 A group of children was divided into clusters of different patterns of sun protective behaviors: “Multiple protective behaviors”,“Clothing and shade”,“Pants only”, and“Low/inconsistent protective behaviors”[40].
6–9 55 An adult population was segmented by dietary patterns:“Traditional Irish”,“Continental”,“Unhealthy foods”,“Light-meal foods & low-fat milk”,“Healthy foods”, and“Wholemeal bread & dessert”[43].
> = 10 4 A female population was divided into 43 groups based on mammography status, access to care, health behaviors (e.g. smoking), health status etc.44
Internal validation
Yes 216 The optimal number of clusters was assessed using the Bayesian Information Criterion [92]
No 0
External validation
Yes 138 Using risks of tonsillectomies and wheezing frequency to validate segmentation analysis based on symptoms of sleep disordered breathing [50]
No 78
Identifiability/Interpretability
Yes 216 Segmentation analysis of dietary patterns derived clusters that are easily identified as“Alcohol cluster”, “Meat cluster”,“Healthy cluster”, and“Refined sugars cluster”[47]
No 0
Substantiality
Yes 216 The smallest segment of a clustering analysis of asthma symptoms is composed of 15.8% of the population [93]
No 0
Stability
Yes 10 A segmentation analysis of a asthma patient population with 10-year follow up showed the segments remain relatively stable 10 years apart (probability of cluster membership in the same asthma cluster at both times varied between 54 to 88%) [94]
No 206
Actionability/Accessibility
Yes 216 A population is divided into segments with distinct sun protection behavioral patterns, for each of which future sun protection interventions tailored to specific subgroups can be designed and delivered to achieve meaningful behavioral changes [40]
requires clinical experience, contextual knowledge,
conceptual support, adjustment and iterations [54]. It
was also observed that data used for segmentation can come from various sources, with some from pri-mary data collection by questionnaires or interviews and others using secondary data from large random-ized clinical trials, cohort studies, and administrative databases. This further adds to the potential of seg-mentation analysis as more EHRs become increasingly visible.
There are a large number of statistical techniques and software packages available for data-driven population segmentation analysis. Each technique is different and has specific properties, which may lead different
inter-pretations of the underlying structure of the data [55].
Different segmentation solutions may be derived even
given the same set of input variables [56]. Explaining in
technical terms on how each method works is beyond the scope of this review. Researchers should consider
each methods’assumptions and requirement, unique
ad-vantages and disadad-vantages when conducting segmenta-tion analysis. For example, latent class analysis has goodness-of-fit measures available to help users deter-mine model fit and the statistically optimal number of segments (e.g. Akaike Information Criterion, Bayesian Information criterion, standardized entropy, and boot-strapped likelihood ratio test) but can only accept
cat-egorical data [57–59]. The choice between the
techniques (or combinations of different methods, if de-sired) depends on the data properties, sample size, re-search questions, aims of rere-search and the expertise of
researchers [60].
After segments are derived by segmentation analysis, the next step is for researchers to assess the quality of the
seg-mentation outcome [61]. Like any other data analysis,
seg-mentation analysis is an iterative process with many potential variations, including input data for segmentation, statistical techniques employed, different number of
clus-ters and profiles [62]. The criteria for optimal segmentation
outcome of healthcare data are not well-established [56]. In
the field of consumer market segmentation, the following criteria were proposed to assess the segmentation
effective-ness:internal validity, external validity,
identifiability/inter-pretability, substantiality, stability, and actionability/ accessibility[48,49]. In this systematic review, only 10
stud-ies evaluatedstability. In general, individuals in a
popula-tion need to have stable segment membership over time to allow for long-term healthcare interventions and policy making. It is thus important to have longitudinal studies to
assess thestabilityof a segmentation framework. Another
challenge is to interpret and name the derived segment. They involve subjective examination to identify characteris-tics within each cluster and distinguish substantial
differ-ences between clusters. For example, a “healthy” segment
in one study on dietary patterns was named because this segment has high consumption in vegetables, fruits, fish, whole grains, and low-fat dairy while in another study, a segment characterized by high dietary intake of brown bread, low-fat spreads, low-fat milk, and fruit was given the
same label“healthy”[63–65]. Therefore, the characteristics
of each cluster and the differences between clusters should be carefully evaluated with theoretical expertise or clinical
experience [66]. Thus, to assess the segmentation outcome
requires a combination of statistical reasoning, clinical judgment, policy implications, and many other quantitative and qualitative criteria. While the above criteria from mar-ket segmentation seem to be relevant to population seg-mentation in the context of healthcare, it is imperative to develop a conceptual framework with comprehensive cri-teria for evaluation of segmentation outcome specific to healthcare studies.
This study is the first systematic review of data-driven population segmentation analysis. We summarized the commonly used segmentation methods, the evaluations of segmentation outcomes, and various clinical settings to which the segmentation analysis was applied, includ-ing both adult and pediatric population, general popula-tion and those with specific diseases or condipopula-tions. It is also the first to compare and contrast the strengths, lim-itations, and practical considerations for commonly used segmentation methods to guide future research that used data-driven population segmentation analysis. This study also provides directions on how to assess the segmenta-tion results. Nonetheless, our study is limited by exclud-ing non-English literature.
Conclusions
Data-driven population segmentation holds great poten-tial in managing population health and has been widely applied in various clinical contexts. Many segmentation analysis methods are available to derive population clus-ters. The evaluations of segmentation outcome require statistical criteria and clinical experience. The optimal framework for assessment of segmentation results re-quire further research.
Additional files
Additional file 1:Search terms in the PubMed® Topic Specific Query
“Population Health”category. This file includes the search terms used in the
PubMed® Topic Specific Query“Population Health”category (DOCX 118 kb)
Additional file 2:Top Journals. This file includes top 50 journals in
public health and top 3 journals in population health according to impact factors in 2016 by SCImago Scientific Journal Rankings and InCites Journal Citation Reports (DOCX 111 kb)
Additional file 3:Table S1.The population of interest in studies included
Additional file 4:Table S2.Segmentation details in studies included for this systematic review. This file includes the details of the segmentation results in studies included in this systematic review, including the objectives of segmentation, segmentation variables, statistical methods used, software, number and names of segments. (DOCX 229 kb)
Additional file 5:Table S3.Evaluation of segmentation outcome in
studies included for this systematic review. This files includes the detailed assessment of segmentation outcome in studies included for this systematic review, including their internal validation, external validation and validation variables used, identifiability/interpretability, substantiality, stability, and actionability/accessibility (DOCX 160 kb)
Abbreviations
AIDS:Acquired immune deficiency syndrome; CART: Classification and regression tree; CHAID: Chi-square automatic interaction detector; COPD: Chronic obstructive pulmonary diseases; EHRs: Electronic health records; HIV: Human immunodeficiency virus; N.A.: Not available;
PRISMA: Preferred reporting items for systematic reviews and meta-analyses; PTSD: Post-traumatic stress disorder; UK: The United Kingdom; US: The United States of America
Acknowledgements
We would like to thank Librarian Dr. Amy Chou at National University of Singapore Medical Library for her advice on the search strategies.
Funding Not applicable
Availability of data and materials
All data generated or analysed during this study are included in this published article and its supplementary information files.
Authors’contributions
SY, YHK, JT and LLL conceived and co-designed the work. SY, YHK and CST and LLL developed and conducted the search and analytical methods. JT and LLL supervised this work. SY, YHK, CST, JT and LLL discussed the results and contributed to the drafting and revising of the manuscript. All authors read and approved the final manuscript.
Ethics approval and consent to participate Not applicable
Consent for publication Not applicable
Competing interests
The authors declare that they have no competing interests.
Publisher’s Note
Springer Nature remains neutral with regard to jurisdictional claims in published maps and institutional affiliations.
Author details
1Duke-NUS Medical School, 8 College Road, Singapore 169857, Singapore. 2
Program in Health Services and Systems Research, Duke-NUS Medical School, 8 College Road, Singapore 169857, Singapore.3Saw Swee Hock School of Public Health, National University of Singapore, 12 Science Drive 2, Singapore 117549, Singapore.4Rheumatology and Immunology, Singapore General Hospital, 16 College Road, Block 6 Level 9, Singapore 169854, Singapore.5Family Medicine and Continuing Care, Singapore General Hospital, Outram Road, Bowyer Block, Block A, Level 2, Singapore 169608, Singapore.
Received: 27 February 2018 Accepted: 19 October 2018
References
1. Kodner DL, Spreeuwenberg C. Integrated care: meaning, logic, applications,
and implications--a discussion paper. Int J Integr Care [Internet]. 2002;2:e12.
Available from:https://www.ncbi.nlm.nih.gov/pmc/articles/PMC1480401/.
2. Department of Health Policy Paper: 2010 to 2015 government policy: health
and social care integration - GOV.UK [Internet]. [cited 2017 Nov 11].
Available from:
https://www.gov.uk/government/publications/2010-to-2015-government-policy-health-and-social-care-integration
3. Stine Nw CDAGMN. Improving population health in us cities. JAMA
[Internet] 2013;309:449–450. Available from:https://doi.org/10.1001/jama.
2012.154302
4. LYNN J, STRAUBE BM, BELL KM, JENCKS SF, KAMBIC RT. Using population
segmentation to provide better health Care for all: the“bridges to health”
model. Milbank Q [Internet]. 2007;85:185–208 Available from:https://
onlinelibrary.wiley.com/doi/abs/10.1111/j.1468-0009.2007.00483.x.
5. Beard JR, Officer AM, Cassels AK. The world report on ageing and health.
Gerontologist. 2016. p. S163–6.
6. Vuik SI, Mayer E, Darzi A. A quantitative evidence base for population
health: applying utilization-based cluster analysis to segment a patient
population. Popul Health Metr [Internet]. 2016;14:44. Available from:https://
pophealthmetrics.biomedcentral.com/articles/10.1186/s12963-016-0115-z
7. van der Laan MR E, van MAG O, Broekhuis H, JPJ S. A person-centred
segmentation study in elderly care: Towards efficient demand-driven care.
Soc Sci Med. 2014;113:68–76.
8. Vuik SI, Mayer EK, Darzi A. Patient segmentation analysis offers significant
benefits for integrated care and support. Health Aff. 2016;35:769–75.
9. NHS England London Better Health for London: One Year On [Internet].
[cited 2017 Nov 11]. Available from:https://www.england.nhs.uk/london/
2015/10/30/better-health-for-london/
10. Choose Health Delaware - Delaware’s State Health Care Innovation Plan
[Internet]. Choose Heal. Delaware. 2013. Available from:https://www.dhss.
delaware.gov/dhcc/cmmi/files/choosehealthplan.pdf
11. Chong JL, Matchar DB. Benefits of Population Segmentation Analysis for
Developing Health Policy to Promote Patient-Centred Care. Ann Acad Med
Singapore [Internet]. 2017 [cited 2017 Sep 30];46. Available from:https://
www.annals.edu.sg/pdf/46VolNo7Jul2017/V46N7p287.pdf
12. Zhou Y. Improving Care for Older Adults: A Model to Segment the Senior
Population. Perm J [Internet]. 2014;18–21. Available from:https://www.
thepermanentejournal.org/issues/2014/summer/5695-care-for-older-adults.html
13. Mira-Solves JJ, Orozco-Beltrán D, Sánchez-Molla M, Jesús J, García S.
Evaluación de la satisfacción de los pacientes crónicos con los dispositivos de telemedicina y con el resultado de la atención recibida. Programa
ValCrònic Atención primaria [Internet]. 2014;46:16–23 [cited 2017 Nov 11].
Available from:
http://www.elsevier.es/es-revista-atencion-primaria-27-estadisticas-S0212656714700617.
14. 3M Health Information Systems 3M™Clinical Risk Groups: Frequently Asked
Questions Q: What are the 3M Clinical Risk Groups (CRGs)?. Accessed 11 Nov 2017.
15. Conry MC, Morgan K, Curry P, McGee H, Harrington J, Ward M, et al. The
clustering of health Behaviours in Ireland and their relationship with mental health, self-rated health and quality of life. BMC Public Health [internet]. 2011;
11:692 Available from:https://bmcpublichealth.biomedcentral.com/articles/10.
1186/1471-2458-11-692.
16. Pietrzak RH, El-Gabalawy R, Tsai J, Sareen J, Neumeister A, Southwick SM.
Typologies of posttraumatic stress disorder in the U.S. adult population. J
Affect Disord. 2014;162:102–6.
17. Simons-Morton BG, Cheon K, Guo F, Albert P. Trajectories of kinematic risky
driving among novice teenagers. Accid Anal Prev. 2013;51:27–32.
18. Reedy J, Wirfält E, Flood A, Mitrou PN, Krebs-Smith SM, Kipnis V, et al.
Comparing 3 dietary pattern methods-cluster analysis, factor analysis, and
index analysis-with colorectal cancer risk. Am J Epidemiol. 2010;171:479–87.
19. Keel PK, Fichter M, Quadflieg N, Bulik CM, Baxter MG, Thornton L, et al.
Application of a latent class analysis to empirically define eating disorder
phenotypes. Arch Gen Psychiatry. 2004;61:192–200.
20. Verger P, Lions C, Ventelou B. Is depression associated with health
21. Laska MN, Pasch KE, Lust K, Story M, Ehlinger E. Latent class analysis of lifestyle characteristics and health risk behaviors among college youth. Prev
Sci. 2009;10:376–86.
22. Boone-Heinonen J, Gordon-Larsen P, Adair LS. Obesogenic clusters:
Multidimensional adolescent obesity-related behaviors in the U.S. Ann
Behav Med. 2008;36:217–30.
23. Iannotti RJ, Wang J. Patterns of physical activity, sedentary behavior, and
diet in U.S. adolescents. J Adolesc Health. 2013;53:280–6.
24. Adams MA, Ding D, Sallis JF, Bowles HR, Ainsworth BE, Bergman P, et al.
Patterns of neighborhood environment attributes related to physical activity across 11 countries: a latent class analysis. Int J Behav Nutr Phys Act
[Internet]. 2013;10:34 Available from:https://ijbnpa.biomedcentral.com/
articles/10.1186/1479-5868-10-34.
25. Adams MA, Sallis JF, Conway TL, Frank LD, Saelens BE, Kerr J, et al.
Neighborhood environment profiles for physical activity among older
adults. Am J Health Behav. 2012;36:757–69.
26. Adams MA, Sallis JF, Kerr J, Conway TL, Saelens BE, Frank LD, et al.
Neighborhood environment profiles related to physical activity and weight
status: A latent profile analysis. Prev Med (Baltim). 2011;52:326–31.
27. Adams MA, Todd M, Kurka J, Conway TL, Cain KL, Frank LD, et al. Patterns of
walkability, transit, and recreation environment for physical activity. Am J
Prev Med. 2015;49:878–87.
28. Lo Siou G, Yasui Y, Csizmadi I, McGregor SE, Robson PJ. Exploring statistical
approaches to diminish subjectivity of cluster analysis to derive dietary
patterns. Am J Epidemiol. 2011;173:956–67.
29. Wirfält E, Midthune D, Reedy J, Mitrou P, Flood A, Subar AF, et al.
Associations between food patterns defined by cluster analysis and
colorectal cancer incidence in the NIH–AARP diet and health study. Eur J
Clin Nutr. 2009;63:707–17.
30. Newby PK, Muller D, Tucker KL. Associations of empirically derived eating
patterns with plasma lipid biomarkers: a comparison of factor and cluster
analysis methods. Am J Clin Nutr. 2004;80:759–67.
31. Harrington JM, Dahly DL, Fitzgerald AP, Gilthorpe MS, Perry IJ. Capturing
changes in dietary patterns among older adults: a latent class analysis of an
ageing Irish cohort. Public Health Nutr [Internet]. 2014;17:2674–86 Available
from:https://www.ncbi.nlm.nih.gov/pubmed/24564930.
32. Bailey RL, Gutschall MD, Mitchell DC, Miller CK, Lawrence FR,
Smiciklas-Wright H. Comparative strategies for using cluster analysis to assess dietary
patterns. J Am Diet Assoc. 2006;106:1194–200.
33. Pryer JA, Nichols R, Elliott P, Thakrar B, Brunner E, Marmot M. Dietary
patterns among a national random sample of British adults. J Epidemiol
Community Health [Internet]. 2001;55:29–37. Available from:https://www.
ncbi.nlm.nih.gov/pubmed/11112948.
34. Bamia C, Orfanos P, Ferrari P, Overvad K, Hundborg HH, Tjønneland A, et al.
Dietary patterns among older Europeans: the EPIC-Elderly study. Br J Nutr
[Internet]. 2005;94:100 Available from:https://www.cambridge.org/core/
journals/british-journal-of-nutrition/article/dietary-patternsamong-older-europeans-the-epicelderly-study/197D81C2C99BD4949D58F29F01131337.
35. Fukuoka Y, Lindgren TG, Rankin SH, Ba C, Carroll DL. Cluster analysis: a
useful technique to identify elderly cardiac patients at risk for poor quality
of life. Qual Life Res [Internet]. 2007;16:1655–63 Available from:https://www.
ncbi.nlm.nih.gov/pubmed/17955345.
36. Héroux M, Janssen I, Lee D c, Sui X, Hebert JR, Blair SN. Clustering of
unhealthy behaviors in the aerobics center longitudinal study. Prev Sci.
2012;13:183–95.
37. Wolf EJ, Miller MW, Reardon AF, Ryabchenko KA, Castillo D, Freund R.
A latent class analysis of dissociation and posttraumatic stress disorder: evidence for a dissociative subtype. Arch Gen Psychiatry
[Internet]. 2012;69:698–705 Available from:https://www.ncbi.nlm.nih.
gov/pubmed/22752235.
38. Norman GJ, Velicer WF. Developing an empirical typology for regular
exercise. Prev Med (Baltim). 2003;37(6):635–45.
39. Gjelsvik A, Rogers ML, Clark MA, Ombao HC, Rakowski W. Continuum of
mammography use among US women: classification tree analysis. Am J
Health Behav. 2014;38:492–500.
40. Miller KA, Huh J, Unger JB, Richardson JL, Allen MW, Peng DH, et al. Patterns
of sun protective behaviors among Hispanic children in a skin cancer prevention intervention. Prev Med (Baltim). 2015;81:81.
41. Penrod JD, Litke A, Hawkes WG, Magaziner J, Koval KJ, Doucette JT, et al.
Heterogeneity in hip fracture patients: age, functional status, and
comorbidity. J Am Geriatr Soc. 2007;55:407–13.
42. Love BC. Comparing supervised and unsupervised category learning.
Psychon Bull Rev. 2002;9:829–35.
43. Hearty ÁP, Gibney MJ. Comparison of cluster and principal component
analysis techniques to derive dietary patterns in Irish adults. Br J Nutr
[Internet]. 2009;101:590 Available from:https://www.cambridge.org/core/
journals/british-journal-of-nutrition/article/comparison-ofcluster-and- principal-component-analysis-techniques-to-derive-dietary-patterns-in-irishadults/2130E0404EA1C0AC9CF4382839DE3498.
44. Ledere BS, Bégin C, Cadieux É, Goulet L, Allaire JF, Meloche J, et al. A
classification and regression tree for predicting recurrent falling among community-dwelling seniors using home-care services. Can J Public Heal.
2009;100:263–7.
45. Croezen S, Haveman-Nies A, Alvarado VJ, Van’t Veer P, De Groot CPGM.
Characterization of different groups of elderly according to social
engagement activity patterns. J Nutr Heal Aging. 2009;13:776–81.
46. Milligan GW. In: Max M, editor. Clustering validation: results and implications
for applied analyses. Columbus: Fisher College of Business, Ohio State University; 1996.
47. Huijbregts PP, Feskens EJ, Kromhout D. Dietary patterns and cardiovascular
risk factors in elderly men: the Zutphen elderly study. Int J Epidemiol
[internet]. 1995;24:313–20 Available from:https://www.ncbi.nlm.nih.gov/
pubmed/7635591.
48. Jadczaková V. Review of segmentation process in consumer markets. Acta
Univ Agric Silvic Mendelianae Brun. 2013;61(4):1215–24.
49. Wedel M, Kamakura WA. Market Segmentation - Conceptual and
Methodological Foundations [Internet]. 2nd ed. New York City: Springer US;
2000. Available from:https://www.springer.com/gp/book/9780792386353
50. Freeman K, Bonuck K. Snoring, mouth-breathing, and apnea trajectories in a
population-based cohort followed from infancy to 81 months: a cluster
analysis. Int J Pediatr Otorhinolaryngol. 2012;76:122–30.
51. Nelson MC, Gordon-Larsen P, Adair LS, Popkin BM. Adolescent physical
activity and sedentary behavior: patterning and long-term maintenance. Am
J Prev Med. 2005;28:259–66.
52. Griffin B, Sherman KA, Jones M, Bayl-Smith P. The clustering of health
Behaviours in older Australians and its association with physical and psychological status, and sociodemographic indicators. Ann Behav Med.
2014;48:205–14.
53. Newby PK, Muller D, Hallfrisch J, Qiao N, Andres R, Tucker KL. Dietary
patterns and changes in body mass index and waist circumference in
adults. Am J Clin Nutr. 2003;77:1417–25.
54. Mooi E, Sarstedt M. Cluster Analysis. A Concise Guid to Mark Res [Internet].
2011:237–84 Available from:https://www.springerlink.com/index/10.1007/
978-3-642-12541-6.
55. Eshghi A, Haughton D. Identifying Groups: A Comparison of Methodologies.
J Data Sci [Internet]. 2011;9(2):271–91. [cited 2017 Nov 14] Available from:
www.jds-online.com/file_download/308/JDS-679.pdf.
56. Erlich Z, Gelbard R, Spiegler I. Evaluating a positive attribute clustering
model for data mining. J Comput Inf Syst. 2003;43:100–8.
57. Lanza ST, Collins LM, Lemmon DR, Schafer JL. PROC LCA: A SAS procedure
for latent class analysis. Struct Equ Model A Multidiscip J [Internet]. 2007;14:
671–94 Available from:https://www.tandfonline.com/doi/abs/10.1080/
10705510701575602.
58. Nylund KL, Asparouhov T, Muthén BO. Deciding on the number of
classes in latent class analysis and growth mixture modeling: a Monte
Carlo simulation study. Struct Equ Model [Internet]. 2007;14:535–69
Available from:https://www.tandfonline.com/doi/abs/10.1080/
10705510701575396.
59. Collins LM, Lanza ST. Latent class and latent transition analysis: with
applications in the social, behavioral, and health sciences [internet]. Sci York.
2010;122–23 Available from:https://www.wiley.com/enus/Latent+Class+and
+Latent+Transition+Analysis%3A+With+Applications+in+the+Social%2C +Behavioral%2C+and+Health+Sciencesp-9780470228395.
60. Hofstetter H, Dusseldorp E, van Empelen P, Paulussen TWGM. A primer on
the use of cluster analysis or factor analysis to assess co-occurrence of risk
behaviors. Prev Med (Baltim). 2014;67:141–6.
61. Jain AK, Murty MN, Flynn PJ. Data clustering: a review. ACM Comput Surv
[Internet]. 1999;31:264–323 Available from:https://portal.acm.org/citation.
cfm?doid=331499.331504.
62. Cluster Analysis and Segmentation [Internet]. [cited 2017 Nov 14]. Available
from:https://inseaddataanalytics.github.io/INSEADAnalytics/CourseSessions/
63. Newby PK, Tucker KL. Empirically derived eating patterns using factor or
cluster analysis: a review. Nutr Rev. 2004;62:177–203.
64. Pryer JA, Cook A, Shetty P. Identification of groups who report similar
patterns of diet among a representative national sample of British adults
aged 65 years of age or more. Public Health Nutr. 2001;4:787–95.
65. Terry P, Hu FB, Hansen H, Wolk A. Prospective study of major dietary patterns
and colorectal cancer risk in women. Am J Epidemiol [internet]. 2001;154:
1143–9 Available from:https://www.ncbi.nlm.nih.gov/pubmed/11744520.
66. Low LL, Yan S, Kwan YH, Tan CS, Thumboo J. Assessing the validity of a
data driven segmentation approach: A 4 year longitudinal study of healthcare utilization and mortality. PloS one. 2018;13(4):e0195243.
67. Walsh D, Rybicki L. Symptom clustering in advanced cancer. Support Care
Cancer. 2006;14:831–6.
68. Fitzpatrick AM, Teague WG, Meyers DA, Peters SP, Li X, Li H, et al.
Heterogeneity of severe asthma in childhood: confirmation by cluster analysis of children in the National Institutes of Health/National Heart, Lung, and Blood Institute severe asthma research program. J Allergy Clin
Immunol. 2011;127:382–89.
69. Lindgren TG, Fukuoka Y, Rankin SH, Cooper BA, Carroll D, Munn YL. Cluster
analysis of elderly cardiac patients’prehospital symptomatology. Nurs Res
[Internet]. 2008;57:14–23 Available from:https://www.ncbi.nlm.nih.gov/
pubmed/18091288.
70. Peretti-Watel P, Spire B, Lert F, Obadia Y. Drug use patterns and
adherence to treatment among HIV-positive patients: evidence from a large sample of French outpatients (ANRS-EN12-VESPA 2003). Drug
Alcohol Depend. 2006;82:S71–79.
71. Guthrie E, Creed F, Fernandes L, Ratcliffe J, Van Der Jagt J, Martin J, et al.
Cluster analysis of symptoms and health seeking behaviour differentiates subgroups of patients with severe irritable bowel syndrome. Gut [Internet].
2003;52:1616–22 Available from:https://www.ncbi.nlm.nih.gov/pubmed/
14570732.
72. Sedrakyan A, Zhang H, Treasure T, Krumholz HM. Recursive
partitioning-based preoperative risk stratification for atrial fibrillation after coronary artery
bypass surgery. Am Heart J [Internet]. 2006;151:720–4. Available from:
https://www.ncbi.nlm.nih.gov/pubmed/16504639.
73. Engeset D, Alsaker E, Ciampi A, Lund E. Dietary patterns and lifestyle factors
in the Norwegian EPIC cohort: the Norwegian women and Cancer
(NOWAC) study. Eur J Clin Nutr. 2005;59:675–84.
74. Weatherall M, Travers J, Shirtcliffe PM, Marsh SE, Williams MV, Nowitz MR, et
al. Distinct clinical phenotypes of airways disease defined by cluster analysis.
Eur Respir J. 2009;34:812–8.
75. Berlin KS, Parra GR, Williams N a. An introduction to latent variable mixture
modeling (part 1): overview and Cros-sectional latent class and latent profile
analyses. J Pediatr Psychol [internet]. 2014;39:174–87 Available from:https://
www.ncbi.nlm.nih.gov/pubmed/24277770.
76. Magidson J, Vermunt JK. Latent class models for clustering: a comparison
with K-means. Can J Mark Res. 2002;20:37–44.
77. Hickendorff M, Edelsbrunner PA, McMullen J, Schneider M, Trezise K.
Informative tools for characterizing individual differences in learning: latent class, latent profile, and latent transition analysis. Learn Individ Differ. 2017;
4–15.
78. Chawla S. k-means: A unified approach to clustering and outlier detection.
[cited 2017 Nov 14]; Available from:http://pmg.it.usyd.edu.au/outliers.pdf
79. Bittmann RM, Gelbard RM. Decision-making method using a visual
approach for cluster analysis problems; indicative classification algorithms
and grouping scope. Expert Syst. 2007;24:171–87.
80. Gelbard R, Goldman O, Spiegler I. Investigating diversity of clustering
methods: an empirical comparison. Data Knowl Eng. 2007;63:155–66.
81. Huang A. Similarity Measures for Text Document Clustering. New Zeal
Comput Sci Res Student Conf. 2008:49–56.
82. Everitt BS, Landau S, Leese M, Stahl D. Cluster analysis [internet]. Qual
Quant. 2011;332 Available from:https://www.springerlink.com/index/10.
1007/BF00154794.
83. Tucker KL, Chen H, Hannan MT, Adrienne Cupples L, Wilson PWF, Felson D,
et al. Bone mineral density and dietary patterns in older adults: the
Framingham osteoporosis study. Am J Clin Nutr. 2002;76:245–52.
84. Finch H. Comparison of distance measures in cluster analysis with
dichotomous data. J Data Sci. 2005;3:85–100.
85. Duda RO, Hart PE. Pattern classification and scene analysis [internet]. Leonardo
1973;97–99. Available from:https://www.jstor.org/stable/1573081?origin=
crossref
86. Calinski T, Harabasz J. A dendrite method for cluster analysis. Commun Stat
- Theory Methods [Internet]. 1974;3:1–27 Available from:https://www.
tandfonline.com/doi/abs/10.1080/03610927408827101.
87. Yim O, Ramdeen KT. Hierarchical cluster analysis: comparison of three
linkage measures and application to psychological data. Quant Methods
Psychol. 2015;11:8–21.
88. Hair JF, Black WC, Babin BJ, Anderson RE. Multivariate Data Analysis. Vectors.
2010;6:816.
89. Rokach L, Maimon O. Decision trees. Data Min Knowl Discov Handb [internet].
2010:165–92 Available from:https://doi.org/10.1007/0-387-25465-X_9.
90. Buskirk TD. Surveying the forests and sampling the trees: an overview of
classification and regression trees and random forests with applications in survey research. Surv Pract. 2018;11:2709.
91. Horn SR, Pietrzak RH, Schechter C, Bromet EJ, Katz CL, Reissman DB, et al.
Latent typologies of posttraumatic stress disorder in world trade center
responders. J Psychiatr Res. 2016;83:151–9.
92. Kang J, Ciecierski CC, Malin EL, Carroll AJ, Gidea M, Craft LL, et al. A latent
class analysis of cancer risk behaviors among U.S. college students. Prev
Med (Baltim). 2014;64:121–5.
93. Siroux V, Basagana X, Boudier A, Pin I, Garcia-Aymerich J, Vesin A, et al.
Identifying adult asthma phenotypes using a clustering approach. Eur Respir
J [Internet]. 2011;38:310–7 Available from:https://erj.ersjournals.com/cgi/doi/
10.1183/09031936.00120810.
94. Boudier A, Curjuric I, Basagaña X, Hazgui H, Anto JM, Bousquet J, et al. Ten-year
follow-up of cluster-based asthma phenotypes in adults a pooled analysis of