SYSTEMATIC REVIEW PROTOCOL
Response of chlorophyll
a
to total
nitrogen and total phosphorus concentrations
in lotic ecosystems: a systematic review protocol
Micah G. Bennett
*, Kate A. Schofield, Sylvia S. Lee and Susan B. Norton
Abstract
Background: Eutrophication of freshwater ecosystems resulting from nitrogen and phosphorus pollution is a major stressor across the globe. Despite recognition by scientists and stakeholders of the problems of nutrient pollution, rigorous synthesis of scientific evidence is still needed to inform nutrient-related management decisions, especially in streams and rivers. Nutrient stressor-response relationships are complicated by multiple interacting environmental factors, complex and indirect causal pathways involving diverse biotic assemblages and food web compartments, legacy (historic) nutrient sources such as agricultural sediments, and the naturally high spatiotemporal variability of lotic ecosystems. Determining nutrient levels at which ecosystems are affected is a critical first step for identify-ing, managidentify-ing, and restoring aquatic resources impaired by eutrophication and maintaining currently unimpaired resources. The systematic review outlined in this protocol will compile and synthesize literature on the response of chlorophyll a to nutrients in streams, providing a state-of-the-science body of evidence to assess nutrient impacts to one of the most widely-used measures of eutrophication. This review will address two questions: “What is the response of chlorophyll a to total nitrogen and total phosphorus concentrations in lotic ecosystems?” and “How are these relation-ships affected by other factors?”
Methods: Searches for published and unpublished articles (peer-reviewed and non-peer-reviewed) will be con-ducted using bibliographic databases and search engines. Searches will be supplemented with bibliography searches and requests for material from the scientific and management community. Articles will be screened for relevance at the title/abstract and full text levels using pre-determined inclusion criteria; 10% (minimum 50, maximum 200) of screened papers will be examined by multiple reviewers to ensure consistent application of criteria. Study risk of bias will be evaluated using a questionnaire developed from existing frameworks and tailored to the specific study types this review will encounter. Results will be synthesized using meta-analysis of correlation coefficients, as well as narrative and tabular summaries, and will focus on the shape, direction, strength, and variability of available nutrient-chlorophyll relationships. Sensitivity analysis and meta-regression will be used to evaluate potential effects of study quality and modifying factors on nutrient-chlorophyll relationships.
Keywords: Nutrients, Pollution, Water quality, Stressor-response, Stream, River, Primary production, Eutrophication
© The Author(s) 2017. This article is distributed under the terms of the Creative Commons Attribution 4.0 International License (http://creativecommons.org/licenses/by/4.0/), which permits unrestricted use, distribution, and reproduction in any medium, provided you give appropriate credit to the original author(s) and the source, provide a link to the Creative Commons license, and indicate if changes were made. The Creative Commons Public Domain Dedication waiver (http://creativecommons.org/ publicdomain/zero/1.0/) applies to the data made available in this article, unless otherwise stated.
Background
Nutrient pollution by nitrogen (N) and phosphorus (P)—defined here as nutrient concentrations higher than background or natural levels—is a major stressor
of freshwater ecosystems, both across the United States and globally [1–6]. Nutrients and resulting stressors (e.g. oxygen depletion) degrade ecosystem services worth more than $2.2 billion annually in the United States alone [7]. Despite recognition by scientists and stake-holders that nutrient pollution and resulting eutrophi-cation (increased ecosystem metabolism) are problems in fresh waters [1, 4, 5, 8, 9], rigorous synthesis of scien-tific evidence is still needed to inform nutrient-related
Open Access
*Correspondence: [email protected]
management decisions and policies, particularly in streams and rivers [10]. There are several factors that complicate nutrient stressor-response relationships in lotic systems. Several potential nutrient constituents (e.g. nitrate, ammonia) can act as stressors. Causal pathways between nutrients stressors and biological effects are complex and include many indirect effects. These path-ways also involve diverse assemblages (e.g. algae, mac-roinvertebrates, fishes) and food web compartments (e.g. “green” pathways involving primary producers, “brown” pathways involving heterotrophic bacteria and fungi [11, 12]); and many interacting environmental factors are also involved, such as land use, flooding, and stream size, affect stressor-response relationships [13–15]. Temporal factors also complicate relationships, with legacy (his-toric) nutrient sources contributing to stressors [3, 16, 17]. Finally, high spatiotemporal variability of both nutri-ent concnutri-entrations [18] and lotic systems more gener-ally [19] can complicate evaluation of stressor-response relationships in these systems. The effects of nutrient increases on biota have been documented in streams and rivers with a variety of biological, chemical, and physi-cal conditions; however, to our knowledge, a synthesis of links between nutrient increases and impacts on stream biota that also addresses the influence of differing condi-tions across a breadth of lotic systems is lacking [20].
Biota integrate impacts over time and so can better rep-resent ecological condition compared to snapshot water quality measurements [21–24]. Environmental managers often use this biological information to evaluate impacts of chronic pollution (e.g. [25]). However, high spatiotem-poral variability and other factors (e.g. those mentioned above) can mask links between nutrients and biota [26]. A synthesis of nutrient stressor-response relationships and how these relationships are modified by other factors could aid the setting of regulatory limits and identifica-tion impacted systems based on biota (e.g. [27]).
Algae are the main primary producers in lotic sys-tems, and algal biomass is expected to be one of the first ecological endpoints to respond to nutrient pollution [28]. Increases in algal biomass are also associated with many of the negative human health and ecological con-sequences of eutrophication, such as reduced drinking water quality [29, 30] and altered species composition [4]. Chlorophyll a (chl-a) is a photosynthetic pigment used to measure algal biomass [31]. In streams and riv-ers, researchers may sample benthic chl-a from hard sub-strates or sestonic chl-a from the water column [31, 32] to determine chl-a concentrations.
This systematic review will compile and synthesize lit-erature on chl-a responses to nutrients in streams and rivers, to provide a state-of-the-science body of evi-dence for assessing nutrient impacts. The review focuses
on total nitrogen (TN) and total phosphorus (TP) con-centrations in the water column. These constituents were selected for both ecological and practical reasons. Although dissolved nutrient forms may be more available for immediate uptake by biota, total nutrient forms are often more highly correlated with chl-a [28]. Dissolved forms may undergo rapid uptake and release by primary producers, such that concentrations of dissolved nutri-ents in the water column may not represent true avail-ability [33, 34]. In contrast, total nutrient forms may best represent trophic state and nutrient limitation in most lotic ecosystems because TN and TP account for N and P held within algae and sediment particles and thus rep-resent integrated measures of biologically available nutri-ents [26, 34, 35]. TN and TP are also the most common nutrient measures used by environmental managers in the United States and around the globe to assess eutroph-ication of lotic ecosystems [36].
This review was motivated by a need for comprehen-sive information on stressor-response relationships to aid water quality scientists at the U.S. Environmental Protec-tion Agency (USEPA) and state environmental agencies in better understanding the effects of nutrient pollution. In several meetings held during 2016–2017, these poten-tial end users helped refine the scope, specific questions and objectives (including the relevant population, expo-sure, and outcome) of the systematic review, and the modifying factors of interest.
Objective of the review
The primary question addressed by this review is: What is the response of chl-a to TN and TP concentrations in lotic ecosystems? The nutrient stressor (TN or TP) and biotic response (chl-a) were chosen based on measures commonly used by U.S. state agencies to evaluate and make regulatory decisions about impairment of lotic eco-systems due to eutrophication. This question consists of the following components:
Population: Lotic fresh waters, or mesocosms that mimic these systems, in any geographic location.
Exposure: Concentration of TN or TP. We define TN as the sum of ammonia N, nitrate N, nitrite N, and organic nitrogen forms; we define TP as the sum of dissolved and particulate phosphorus forms.
Comparator: Control group (no added TN or TP, or low exposure to TN or TP) (for experimental studies), or comparison to lower or higher TN or TP concentrations across a gradient (for observational studies).
“Potential effect modifiers and reasons for heterogene-ity”); others may be added as studies are examined in more detail.
Methods Search strategy Search terms and filters
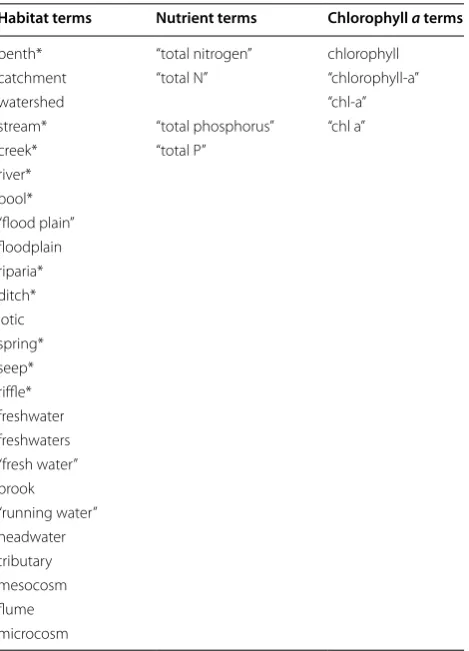
Bibliographic databases will be searched using a combi-nation of terms representing the nutrient stressors (TN or TP), the biological response (chl-a), and habitat- or study-specific terms (e.g. terms associated with types of lotic fresh waters and experimental stream stud-ies) (Table 1). Databases vary in how they handle search strings, so searches will be adapted as needed for each search. An appendix of search strings used for each data-base will be provided in the full systematic review (see Additional file 1 for an example based on the Web of Sci-ence™ database). Books, book chapters, pamphlets and conference abstracts will be excluded from consideration unless they are submitted through calls for additional
information (see “Supplemental searches”), because they generally do not have sufficient relevant primary data and results to extract, and non-electronic library resource limitations prevent a full evaluation of these resources. No language restrictions will be applied to database searches, and any other filters used for specific databases (e.g. excluding full text search to limit irrelevant litera-ture) will be detailed in the full systematic review.
Databases
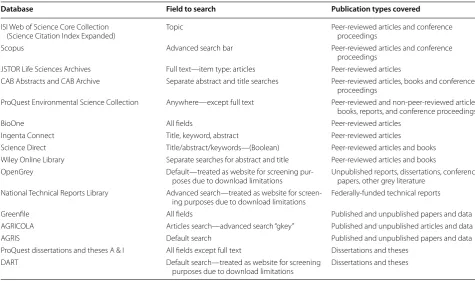
At least 16 bibliographic databases, representing peer-reviewed, non-peer-peer-reviewed, and unpublished mate-rial, will be searched to obtain articles for the review (Table 2). When databases limit the search results that can be viewed or downloaded, results will be filtered by year, when possible, to obtain subsets for viewing and download. Due to limitations on batch downloading of citations, three databases (DART, National Technical Reports Library, and OpenGrey) will be treated similarly to website searches and the first 50 items returned (for separate searches for TN and TP) will be examined (see below) (Table 2).
Specialist websites
Websites of the following organizations will be searched for relevant literature:
• U.S. Environmental Protection Agency
• U.S. state- and territory-level environmental agency websites (56 total entities)
• U.S. Department of Agriculture
• U.S. Forest Service
• U.S. Fish and Wildlife Service
• U.S. Geological Survey
• U.S. National Oceanic and Atmospheric Administra-tion (NOAA)
• NOAA Fisheries
• National Park Service
• World Wildlife Fund
• American Rivers
• International Rivers
• The Nature Conservancy
• United Nations Environment Program
• European Environment Agency
• European Commission Joint Research Center
• Environment and Climate Change Canada (http:// ec.gc.ca/default.asp?lang=En&n=FD9B0E51-1)
• Fisheries and Oceans Canada
• Canadian Council of Ministers of the Environment
The first 50 items returned, sorted by relevance, will be examined for each search. For websites without a search Table 1 Search terms to be used for database searches
Terms within each of the three categories are combined with “OR” and the three categories are combined with “AND” for Boolean searches
Habitat terms Nutrient terms Chlorophyll a terms
benth* “total nitrogen” chlorophyll catchment “total N” “chlorophyll-a”
watershed “chl-a”
stream* “total phosphorus” “chl a”
creek* “total P”
function, relevant “publications” sections will be exam-ined to find documents. Because many websites do not accept Boolean search strings, separate searches will be conducted for TN and TP, and a smaller set of terms will be used each of these searches. All website searches will be documented in a spreadsheet that will include the search date, the specific web URL and search terms used for each site, any website sub-sections used, the total number of items returned, and the number of items deemed relevant. Although the specialist website list is biased toward western countries, resource constraints limit our ability to search more broadly in non-English speaking countries. The “Supplemental searches” will be used to increase capture of relevant articles from other countries.
Search engines
Searches using Google and Google Scholar will be con-ducted, and the first 50 search results will be examined for relevance as with website searches. Separate searches will be conducted for TN and TP, and search terms used for each search will be documented.
Supplemental searches
To supplement these searches, additional resources will be requested from colleagues with disciplinary
knowledge and through ECOLOG-L, Twitter, and ResearchGate. “Snowball” searches will also be con-ducted: references that cite or are cited by a small set of highly relevant literature (see below) will be compiled and any novel references not found during database searches will be evaluated.
Reference management
Articles returned by the search strategy will be stored in an EndNote library. Duplicate entries will be removed, and an initial title screen within EndNote will be used to remove entries that are clearly not relevant (e.g. Front Matter, Meeting Programs and Abstracts, Books Reviewed). The number of entries removed will be recorded. The remaining articles will be imported into the Rayyan software [37] (http://rayyan.qcri.org/) for title/abstract screening.
Assessing search comprehensiveness
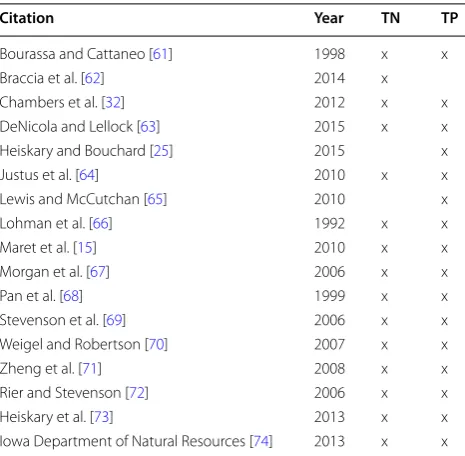
Comprehensiveness of the search strategy will be assessed by: (1) determining whether all articles in a pre-determined “test set” of approximately 15 relevant papers per stressor-response relationship (i.e., TN—chl-a, TP— chl-a; Table 3) are found with the search strategy; and (2) examining bibliographies of these “test set” papers, and papers that cite the “test set” papers, to determine Table 2 Bibliographic databases and relevant information
Database Field to search Publication types covered
ISI Web of Science Core Collection
(Science Citation Index Expanded) Topic Peer-reviewed articles and conference proceedings
Scopus Advanced search bar Peer-reviewed articles and conference
proceedings JSTOR Life Sciences Archives Full text—item type: articles Peer-reviewed articles
CAB Abstracts and CAB Archive Separate abstract and title searches Peer-reviewed articles, books and conference proceedings
ProQuest Environmental Science Collection Anywhere—except full text Peer-reviewed and non-peer-reviewed articles, books, reports, and conference proceedings
BioOne All fields Peer-reviewed articles
Ingenta Connect Title, keyword, abstract Peer-reviewed articles
Science Direct Title/abstract/keywords—(Boolean) Peer-reviewed articles and books Wiley Online Library Separate searches for abstract and title Peer-reviewed articles and books OpenGrey Default—treated as website for screening
pur-poses due to download limitations Unpublished reports, dissertations, conference papers, other grey literature National Technical Reports Library Advanced search—treated as website for
screen-ing purposes due to download limitations Federally-funded technical reports
Greenfile All fields Published and unpublished papers and data
AGRICOLA Articles search—advanced search “gkey” Published and unpublished articles and data
AGRIS Default search Published and unpublished papers and data
ProQuest dissertations and theses A & I All fields except full text Dissertations and theses DART Default search—treated as website for screening
whether relevant citations are captured in our search. If articles are missed, the search strategy will be evaluated and revised accordingly. The “test set” was created by searching the authors’ personal libraries for highly rele-vant articles until at least 15 papers per stressor-response relationship were obtained, and includes both journal articles and reports (Table 3).
Article screening and study inclusion criteria Screening process
Before screening all articles, consistency in applying inclusion criteria will be evaluated on a subset of arti-cles using the kappa statistic (ranging from 0 to 1, with 1 indicating complete agreement [38]). Two to four reviewers will assess the same randomly-selected set of 10% of studies to be screened (minimum 50, maximum 200) at the title/abstract level. Kappa will be calculated, using modifications for more than two raters if necessary [39]. If kappa is low (<0.50) [40], reviewers will examine inconsistencies and clarify inclusion criteria; if kappa is moderate or high (>0.50) [40], one to four reviewers will proceed to screen all retrieved articles at the title/abstract
level and, subsequently, all relevant articles at the full text level. Consistency during full text screening will be addressed by frequently convening reviewers to discuss the strategy and discuss and resolve any questions.
The inclusion criteria (see below) will be applied to systematically exclude articles that are topically irrel-evant or do not contain relirrel-evant data, based on review of the title and abstract. Any article for which there is uncertainty about whether to include or exclude it based on title/abstract screening will be included for full text screening. Following evaluation of all titles and abstracts, full text screening will occur simultaneously with data extraction and quality assessment: as full text articles are examined for data extraction and quality assessment, any article judged to be irrelevant will be excluded and added to the appendix of excluded references, along with the justification based on inclusion criteria. Articles obtained through website searches will be screened dur-ing those searches by examindur-ing title/abstract/summary and full text when necessary, and information on the number of returns and relevant articles will be recorded separately.
Inclusion criteria
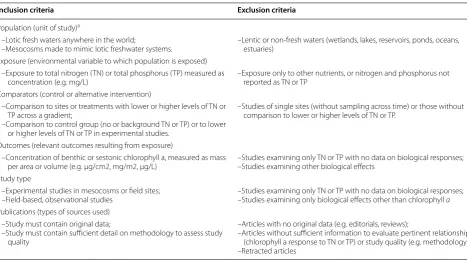
The following inclusion criteria will be used to determine relevant studies (see also Table 4):
Relevant population: Lotic freshwaters anywhere in the world or mesocosms made to mimic these systems.
Relevant exposure: Exposure to total nitrogen (TN) or total phosphorus (TP) measured as concentration (e.g. mg/L).
Relevant comparator: Comparison to sites or treat-ments with lower or higher levels of TN or TP across a gradient, or comparison to a control group (no or back-ground TN or TP) or to lower or higher concentrations of TN or TP in experimental studies.
Relevant outcome: Concentration of benthic or ses-tonic chl-a, measured as mass per area or volume (e.g. µg/cm2, mg/m2, µg/L).
Relevant study type(s): Experimental studies in meso-cosms or field sites, or field-based observational studies.
Relevant publication type(s): Study must contain origi-nal data and sufficient detail on methodology to assess study quality. Book chapters and conference abstracts will be excluded unless specifically suggested by outside experts.
Language: No language restrictions will be applied. Date: No date restrictions will be applied.
Table 3 ”Test set” of sources used to test search strat-egy comprehensiveness and trial study quality and data extraction approaches
TN and TP columns indicate the nutrient(s) for which each citation reports a relationship with chl-a
Citation Year TN TP
Bourassa and Cattaneo [61] 1998 x x
Braccia et al. [62] 2014 x
Chambers et al. [32] 2012 x x
DeNicola and Lellock [63] 2015 x x
Heiskary and Bouchard [25] 2015 x
Justus et al. [64] 2010 x x
Lewis and McCutchan [65] 2010 x
Lohman et al. [66] 1992 x x
Maret et al. [15] 2010 x x
Morgan et al. [67] 2006 x x
Pan et al. [68] 1999 x x
Stevenson et al. [69] 2006 x x
Weigel and Robertson [70] 2007 x x
Zheng et al. [71] 2008 x x
Rier and Stevenson [72] 2006 x x
Heiskary et al. [73] 2013 x x
Multiple studies using same datasets
For cases in which multiple studies use the same or simi-lar datasets (e.g. a dissertation and one or more published articles from that dissertation), the following criteria (listed in order of priority) will be used to select a single source: the study with the more complete dataset, the version published as a peer-reviewed journal article, or the most recent version. The excluded duplicative study or studies may be used to fill in gaps in methodology or contextual information. These decisions will be docu-mented in an appendix.
Unobtainable articles
Attempts to obtain full text of all articles not excluded during the screening process will be made using avail-able library resources or by contacting authors. Articles for which full text is not obtainable will be listed in an appendix. Abstracts of non-English language articles will be translated using Google Translate to assess relevance. Every effort will be made to obtain translations of any highly relevant, non-English language papers; however, this will depend on available resources. All non-Eng-lish articles considered relevant based on title/abstract screening but not fully translated will be listed in an appendix.
Potential effect modifiers and reasons for heterogeneity One motivation for this review is the apparent vari-ability in nutrient stressor-response relationships in lotic ecosystems. Factors that potentially modify stressor-response relationships will be extracted from relevant studies when these factors were examined in the original study. Based on evaluation of highly relevant studies and consultation with stakeholders and experts, the modifiers considered include:
• ecoregion;
• latitude;
• altitude;
• land cover/land use;
• stream size;
• watershed area;
• geographic location;
• date/season/duration of sampling;
• stream gradient;
• flood stage/flow regime/flow permanence;
• nutrient concentration range (lowest and highest TN and/or TP);
• existing background nutrient concentrations;
• temperature;
• canopy cover/light availability;
Table 4 Detailed inclusion and exclusion criteria used to determine study inclusion in the systematic review
a We included some search terms that may capture studies in lentic habitats related to flowing systems (e.g. floodplain, riparian) in an attempt to obtain relevant
studies that might otherwise be missed. We recognize that there is some uncertainty with the lotic/lentic distinction (e.g. flowing freshwater springs) and will liberally include such articles at the title/abstract screening if otherwise relevant
Inclusion criteria Exclusion criteria
Population (unit of study)a
–Lotic fresh waters anywhere in the world;
–Mesocosms made to mimic lotic freshwater systems. –Lentic or non-fresh waters (wetlands, lakes, reservoirs, ponds, oceans, estuaries) Exposure (environmental variable to which population is exposed)
–Exposure to total nitrogen (TN) or total phosphorus (TP) measured as
concentration (e.g. mg/L) –Exposure only to other nutrients, or nitrogen and phosphorus not reported as TN or TP Comparators (control or alternative intervention)
–Comparison to sites or treatments with lower or higher levels of TN or TP across a gradient;
–Comparison to control group (no or background TN or TP) or to lower or higher levels of TN or TP in experimental studies.
–Studies of single sites (without sampling across time) or those without comparison to lower or higher levels of TN or TP.
Outcomes (relevant outcomes resulting from exposure)
–Concentration of benthic or sestonic chlorophyll a, measured as mass
per area or volume (e.g. µg/cm2, mg/m2, µg/L) –Studies examining only TN or TP with no data on biological responses;–Studies examining other biological effects Study type
–Experimental studies in mesocosms or field sites;
–Field-based, observational studies –Studies examining only TN or TP with no data on biological responses;–Studies examining only biological effects other than chlorophyll a
Publications (types of sources used) –Study must contain original data;
–Study must contain sufficient detail on methodology to assess study quality
–Articles with no original data (e.g. editorials, reviews);
• pH;
• alkalinity;
• sediment/turbidity;
• conductivity;
• dominant algal species/groups; and
• grazing (primary consumer) pressure.
Other relevant modifying factors will be recorded as they are encountered during screening and data extrac-tion. Existing geographic information system (GIS) layers and tools that summarize important landscape and envi-ronmental factors (e.g. StreamCat [41], Google Earth) may be used to obtain relevant modifying factors (e.g. lat-itude, flow regime, land use/land cover, watershed area) for studies that do not report this information. If any out-side data are associated with studies, care will be taken so as not to combine data from disparate sources (e.g. if the National Land Cover Dataset is used to estimate land cover, it will be used for all studies). Methodologi-cal modifiers, such as extraction method, measurement method, or sampling location (benthic, sestonic) for chl-a [31, 42], or fraction of water sample used for nutrient measurement (filtered, unfiltered), will also be recorded.
Study quality assessment
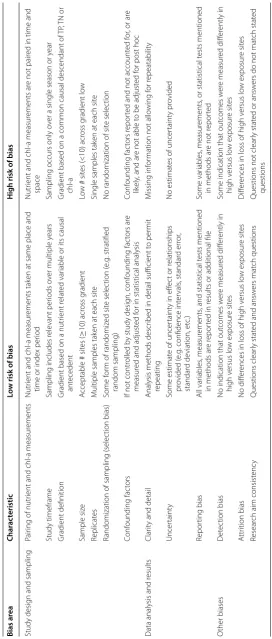
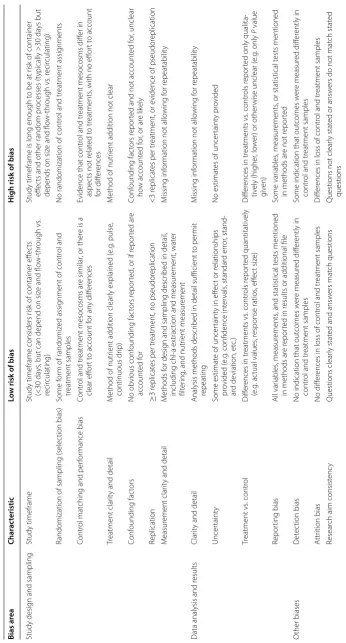
Studies from articles included after title/abstract screen-ing that are still categorized as relevant upon full text screening will be assessed for quality and risk of bias. Aspects of quality and risk of bias from published critical appraisal frameworks in environmental science and med-icine [43–45] were examined to develop a quality assess-ment approach specific to this review, similar to [46] (Tables 5, 6 and 7). For each study, aspects of study qual-ity contributing to a “low” or “high” risk of bias will be rated, based on specific criteria for three different study designs: (1) observational field studies, which typically sample chl-a along a gradient of nutrient concentrations; (2) mesocosm experiments; and (3) field experiments (e.g. Before-After-Control-Impact designs [47]) (Tables 5, 6 and 7). An overall risk of bias estimate for each study will be generated by dividing the number of “high” scores by the number of questions. Results of the systematic review will be discussed and analyzed in the context of this study quality assessment. All relevant studies will undergo quality assessment. To assess accuracy in quality assessment, a reviewer not involved in the initial quality assessment will independently assess quality for 25% of the studies evaluated by other reviewers, and reviewers will discuss and resolve any differences.
Data extraction
Data will be extracted from studies found in articles that are considered relevant after full text screening. The
majority of studies of nutrient stressor-response rela-tionships examine biotic responses across field sites with varying nutrient concentrations, although some com-pare “reference” to “impacted” sites or experimentally manipulate nutrient concentrations. Most studies will thus use correlation or regression to assess relationships between nutrients and chl-a. The shape and direction (e.g. linear—increasing, linear—decreasing, logarithmic, exponential, sigmoidal) and strength of these relation-ships will form the basis for meta-analysis and narra-tive summary of the review results. In most instances, Pearson’s correlation coefficient or Spearman’s rho (r) between TN or TP and chl-a will be used as the effect size. Other effect size measures (e.g. standardized slope coefficients: change in standard deviations of y associ-ated with a change of one standard deviation of x [47– 50]) will also be extracted and explored; however, the correlation coefficient was the most widely used and easily calculable from the example studies examined. Sample sizes will also be extracted for each effect size to estimate effect size variances using meta-analysis models (see “Data synthesis and presentation”). For experimen-tal studies that manipulate nutrient concentrations and report differences in chl-a concentration between con-trol and treatment groups, we will extract or calculate an appropriate “standardized mean difference” effect statis-tic such as Cohen’s d [50, 51].
Authors will be contacted if a study indicates that an effect size was calculated, but not reported (e.g. for nega-tive associations). For studies not reporting effect sizes, raw data will be extracted from figures using image anal-ysis software when possible and effect sizes will be cal-culated. If no effect size is reported and raw data are not presented (e.g. only site means are provided in a table), these studies will not be use in meta-analysis. The initial “test set” of relevant literature will be used to refine the data extraction fields as needed.
One to six reviewers will participate in data extrac-tion from all relevant studies. To assess accuracy in data extraction, a reviewer not involved in initial data extrac-tion will independently extract data for 25% of stud-ies, and any differences will be discussed and resolved. Extracted data from relevant studies will be provided as an appendix or in a publicly-available USEPA data repository.
Data synthesis and presentation
Table 5 S tudy qualit y assessmen t fr ame w or k f or obser va tional
, field studies
Bias ar ea Char ac teristic Lo
w risk of bias
H
igh risk of bias
Study desig
n and sampling
Pair
ing of nutr
ient and chl-a measur
ements
Nutr
ient and chl-a measur
ements tak
en at same place and
time or index per
iod
Nutr
ient and chl-a measur
ements ar
e not pair
ed in time and
space
Study timeframe
Sampling includes r
ele
vant per
iods o
ver multiple y
ears
Sampling occurs only o
ver a single season or y
ear
Gradient definition
Gradient based on a nutr
ient r
elat
ed var
iable or its causal
ant
ecedent
Gradient based on a common causal descendant of
TP
, TN or
chl-a
Sample siz
e
A
cceptable # sit
es ( ≥ 10) acr oss g radient Lo
w # sit
es (<10) acr
oss g radient lo w Replicat es M
ultiple samples tak
en at each sit
e
Single samples tak
en at each sit
e
Randomization of sampling (selec
tion bias)
Some f
or
m of randomiz
ed sit e selec tion ( e.g . stratified random sampling)
No randomization of sit
e selec
tion
Conf
ounding fac
tors
If not contr
olled b
y study desig
n, conf
ounding fac
tors ar
e
measur
ed and adjust
ed f
or in statistical analysis
Conf
ounding fac
tors r
epor
ted and not account
ed f
or
, or ar
e
lik
ely
, and ar
e not able t
o be adjust
ed f
or post hoc
Data analysis and r
esults
Clar
ity and detail
Analysis methods descr
ibed in detail sufficient t
o per mit repeating M issing inf or
mation not allo
wing f or r epeatabilit y Uncer taint y Some estimat
e of uncer
taint
y in eff
ec
t or r
elationships
pr
ovided (
e.g
. confidence int
er vals , standar d er ror , standar d de viation, et c.) No estimat
es of uncer
taint y pr ovided Repor ting bias All var iables , measur ements
, and statistical t
ests mentioned
in methods ar
e r
epor
ted in r
esults or additional file
Some var
iables
, measur
ements
, or statistical t
ests mentioned
in methods ar
e not r
epor ted O ther biases D et ec tion bias
No indication that out
comes w er e measur ed diff er ently in high v ersus lo w exposur e sit es
Some indication that out
comes w er e measur ed diff er ently in high v ersus lo w exposur e sit es A ttr ition bias No diff er
ences in loss of high v
ersus lo w exposur e sit es Diff er
ences in loss of high v
ersus lo
w exposur
e sit
es
Resear
ch aim consist
enc
y
Questions clear
ly stat
ed and answ
ers mat
ch questions
Questions not clear
ly stat
ed or answ
ers do not mat
ch stat
ed
Table 6 S tudy qualit y assessmen t fr ame w or k f or e xp erimen tal meso cosm studies Bias ar ea Char ac teristic Lo
w risk of bias
H
igh risk of bias
Study desig
n and sampling
Study timeframe
Study timeframe considers r
isk of container eff
ec
ts
(<30
da
ys
, but can depend on siz
e and flo
w-thr
ough vs
.
recir
culating)
Study timeframe is long enough t
o be at r
isk of container
eff
ec
ts and other random pr
ocesses (t
ypically >30
da
ys but
depends on siz
e and flo
w-thr ough vs . r ecir culating) Randomization of sampling (selec tion bias) Some f or
m of randomiz
ed assig
nment of contr
ol and
tr
eatment samples
No randomization of contr
ol and tr
eatment assig
nments
Contr
ol mat
ching and per
for
mance bias
Contr
ol and tr
eatment mesocosms ar
e similar
, or ther
e is a
clear eff
or
t t
o account f
or an
y diff
er
ences
Evidence that contr
ol and tr
eatment mesocosms diff
er in
aspec
ts not r
elat
ed t
o tr
eatments
, with no eff
or t t o account for diff er ences Tr eatment clar
ity and detail
M
ethod of nutr
ient addition clear
ly explained (
e.g . pulse , continuous dr ip) M
ethod of nutr
ient addition not clear
Conf ounding fac tors No ob vious conf ounding fac tors r epor ted
, or if r
epor ted ar e account ed f or Conf ounding fac tors r epor
ted and not account
ed f or , unclear ho w account ed f or
, or ar
e lik ely Replication ≥ 3 r eplicat
es per tr
eatment, no pseudor
eplication
<3 r
eplicat
es per tr
eatment, or e
vidence of pseudor
eplication
M
easur
ement clar
ity and detail
M
ethods f
or desig
n and sampling descr
ibed in detail
,
including chl-a ex
trac
tion and measur
ement, wat
er
filt
er
ing
, and nutr
ient measur
ement
M
issing inf
or
mation not allo
wing f
or r
epeatabilit
y
Data analysis and r
esults
Clar
ity and detail
Analysis methods descr
ibed in detail sufficient t
o per mit repeating M issing inf or
mation not allo
wing f or r epeatabilit y Uncer taint y Some estimat
e of uncer
taint
y in eff
ec
t or r
elationships
pr
ovided (
e.g
. confidence int
er vals , standar d er ror , stand -ar d de viation, et c.) No estimat
es of uncer
taint y pr ovided Tr eatment vs . contr ol Diff er
ences in tr
eatments vs . contr ols r epor ted quantitativ ely (e .g . ac tual values , r esponse ratios , eff ec t siz e) Diff er
ences in tr
eatments vs
. contr
ols r
epor
ted only qualita
-tiv
ely (higher
, lo
w
er) or other
wise unclear (
e.g . only P value giv en) Repor ting bias All var iables , measur ements
, and statistical t
ests mentioned
in methods ar
e r
epor
ted in r
esults or additional file
Some var
iables
, measur
ements
, or statistical t
ests mentioned
in methods ar
e not r
epor ted O ther biases D et ec tion bias
No indication that out
comes w er e measur ed diff er ently in contr
ol and tr
eatment samples
Some indication that out
comes w er e measur ed diff er ently in contr
ol and tr
eatment samples A ttr ition bias No diff er
ences in loss of contr
ol and tr
eatment samples
Diff
er
ences in loss of contr
ol and tr
eatment samples
Resear
ch aim consist
enc
y
Questions clear
ly stat
ed and answ
ers mat
ch questions
Questions not clear
ly stat
ed or answ
ers do not mat
ch stat
ed
Table 7 S tudy qualit y assessmen t fr ame w or k f or e xp erimen
tal field studies
Bias ar ea Char ac teristic Lo
w risk of bias
H
igh risk of bias
Study desig
n and sampling
Study t ype Bef or e-A ft er -C ontr ol-I mpac t desig n Bef or e-A ft
er or C
ontr ol-I mpac t desig n Tr eatment r eplication Tr
eatment is applied or studied at multiple independent sites
Tr
eatment not r
eplicat
ed at multiple sit
es
Study timeframe
Sampling occurs o
ver multiple y
ears
Sampling occurs only o
ver a single season or y
ear
Pair
ing of nutr
ient and chl-a measur
ements
Nutr
ient and chl-a measur
ements ar
e tak
en at the same
place and time or index per
iod
Nutr
ient and chl-a measur
ements ar
e not pair
ed in time and
space
Contr
ol mat
ching and per
for
mance bias
Contr
ol and tr
eatment syst
ems ar
e similar and ther
e is a
clear eff
or
t t
o account f
or an
y diff
er
ences
Evidence that contr
ol and tr
eatment syst
ems diff
er in aspec
ts not r elat ed t o tr eatments
, with no eff
or
t t
o account f
or diff er ences Tr eatment clar
ity and detail
M
ethod of nutr
ient addition clear
ly explained (
e.g . pulse , continuous dr ip) M
ethod of nutr
ient addition not clear
Conf ounding fac tors Sample desig n minimiz es eff ec
t of ob
vious conf
ounding
fac
tors; or if not contr
olled b
y sample desig
n, the
y ar
e
measur
ed and adjust
ed f
or in statistical analysis
Conf
ounding fac
tors r
epor
ted and not account
ed f
or
, or ar
e
lik
ely
, and ar
e not able t
o be adjust
ed f
or post hoc
Temporal r eplication >1 r eplicat e bef or
e and af
ter tr eatment 1 r eplicat e bef or
e and af
ter tr
eatment
Spatial r
eplication
>1 sit
e per contr
ol/impac
t
1 sit
e per contr
ol/impac
t
M
easur
ement clar
ity and detail
M
ethods f
or desig
n and sampling descr
ibed in detail
, includ
-ing chl-a ex
trac
tion and measur
ement, wat er filt er ing , and nutr ient measur ement M issing inf or
mation not allo
wing f
or r
epeatabilit
y
Data analysis and r
esults
Clar
ity and detail
Analysis methods descr
ibed in detail sufficient t
o per mit repeating M issing inf or
mation not allo
wing f or r epeatabilit y Uncer taint y Some estimat
e of uncer
taint
y in eff
ec
t or r
elationships pr
o-vided (
e.g
. confidence int
er vals , standar d er ror , standar d de viation, et c.) No estimat
es of uncer
taint y pr ovided Tr eatment vs . C ontr ol Diff er
ences in tr
eatments vs . contr ols r epor ted quantitativ ely (e .g . ac tual values , r esponse ratios , eff ec t siz e) Diff er
ences in tr
eatments vs
. contr
ols r
epor
ted only qualita
-tiv
ely (higher
, lo
w
er) or ar
e other
wise unclear (
e.g
. only P
value g iv en) Repor ting bias All var iables , measur ements
, and statistical t
ests mentioned
in methods ar
e r
epor
ted in r
esults or additional file
Some var
iables
, measur
ements
, or statistical t
ests mentioned
in methods ar
e not r
epor ted O ther biases D et ec tion bias
No indication that out
comes w er e measur ed diff er ently in contr
ol and tr
eatment samples
Some indication that out
comes w er e measur ed diff er ently in contr
ol and tr
eatment samples A ttr ition bias No diff er
ences in loss of contr
ol and tr
eatment samples
Diff
er
ences in loss of contr
ol and tr
eatment samples
Resear
ch aim consist
enc
y
Questions clear
ly stat
ed and answ
ers mat
ch questions
Questions not clear
ly stat
ed or answ
ers do not mat
ch stat ed questions O ther bias No e
vidence of other sour
ces of bias
Evidence of bias fr
om a sour
ce not consider
ed abo
stream size, chl-a or nutrient measurement method). For studies with sufficient information, effect sizes (see “Data extraction”) and variance within and among stud-ies will be examined across studstud-ies using a random effects model. Random effects models assume that the true effect size differs among studies and treat this het-erogeneity as random, and are appropriate for making unconditional inferences about a set of studies of which the obtained studies are assumed to be a random sample [51–54]. Pearson’s correlation coefficient or Spearman’s rho (r) between TN or TP and chl-a will be used as the effect size in most instances. A Fisher’s z-transformation of r will likely be necessary to improve normality and variance [55, 56], although other effect size measures (e.g. standardized slope coefficients) will be explored. Equations in Nakagawa and Cuthill [50], Lajeunesse [51] and meta-analysis packages in the R environment [57] (e.g. ‘MAc’ [58] and citations therein) will be used to convert other effect sizes (e.g. multiple regression coef-ficients) to Pearson’s r. For analysis and presentation, results for TN and TP will be analyzed separately.
Effects of modifying factors (e.g. canopy cover) or sub-groupings (e.g. ecoregion) will be assessed using mixed-effects models or meta-regression. Effect size variation and mean effect size will be visualized using forest plots. Analyses will be conducted using several R packages, including ‘metafor’ [53] and ‘MAc’ [58]. Quality assess-ment scores will be used as factors in sensitivity analy-sis to explore the impact of study quality on overall effect sizes and response shapes [40]. Publication bias will be assessed using funnel plots comparing study effect sizes with standard error [59, 60].
Authors’ contributions
This systematic review protocol was initiated and scoped by all authors. MGB drafted the protocol with substantial edits and improvements by SSL, SBN, and KAS. All authors read and approved the final manuscript.
Acknowledgements
We thank D. Gibbs, M. Lassiter, and A. Shields for helpful feedback on an earlier draft of the manuscript. D. Gibbs helped develop background information on meta-analysis. S. Jackson, L. Yuan, J. Alers-Garcia, R. Mitchell, G. Kaufman, B. Walsh, S. Santell, T. Crawford, N. Spear, T. Gardner, and J. Linn provided indis-pensable feedback for initiating and scoping the systematic review protocol. Disclaimer: The U.S. EPA, through its Office of Research and Development, funded and managed the research described here. The views expressed in this article are those of the authors and do not necessarily represent the views or policies of the U.S. EPA. Any mention of trade names, products, or services does not imply an endorsement by the U.S. Government or the U.S. EPA. Additional file
Additional file 1. Search string for Web of Science™ advanced search.
This search string will be adapted for use with other databases and sources (e.g. websites, search engines). “TS” refers to topic search for Web of Science advanced search.
Competing interests
The authors declare that they have no competing interests. Reviewers involved in this review that are also authors of relevant articles will not be included in the decisions connected to inclusion and quality assessment of their articles.
Availability of data and materials
All data associated with the review will be made publicly available as appendi-ces to the publication or in a U.S. EPA data repository.
Funding
The U.S. EPA, through its Office of Research and Development, funded and managed the systematic review protocol described here.
Publisher’s Note
Springer Nature remains neutral with regard to jurisdictional claims in pub-lished maps and institutional affiliations.
Received: 4 April 2017 Accepted: 11 July 2017
References
1. Dubrovsky NM, Hamilton P. Nutrients in the Nation’s streams and groundwater: National Findings and Implications. Nattional Water-Quality Assessment Program. Fact Sheet, United States Geological Survey. 2010. 2. Cao D, Cao W, Fang J, Cai L. Nitrogen and phosphorus losses from
agricul-tural systems in China: a meta-analysis. Mar Pollut Bull. 2014;85:727–32. 3. Jarvie HP, Sharpley AN, Spears B, Buda AR, May L, Kleinman PJ. Water
qual-ity remediation faces unprecedented challenges from “legacy phospho-rus”. Environ Sci Technol. 2013;47:8997–8.
4. Smith V. Eutrophication of freshwater and coastal marine ecosystems a global problem. Environ Sci Pollut Res. 2003;10:126–39.
5. Conley DJ, Paerl HW, Howarth RW, Boesch DF, Seitzinger SP, Havens KE, et al. Controlling eutrophication: nitrogen and phosphorus. Science. 2009;323:1014–5.
6. Compton JE, Harrison JA, Dennis RL, Greaver TL, Hill BH, Jordan SJ, et al. Ecosystem services altered by human changes in the nitrogen cycle: a new perspective for US decision making. Ecol Lett. 2011;14:804–15. 7. Dodds WK, Bouska WW, Eitzmann JL, Pilger TJ, Pitts KL, Riley AJ, et al.
Eutrophication of US freshwaters: analysis of potential economic dam-ages. Environ Sci Technol. 2009;43:12–9.
8. Beauvais J. Renewed call to action to reduce nutrient pollution and support for incremental actions to protect water quality and public health. Washington, DC: U.S. Environmental Protection Agency; 2016. p. 6. https://www.epa.gov/sites/production/files/2016-09/documents/ renewed-call-nutrient-memo-2016.pdf. Accessed 15 June 2017. 9. Stoner N. Working in partnership with states to address phosphorus
and nitrogen pollution through use of a framework for state nutrient reductions. Washington, DC: U.S. Environmental Protection Agency; 2011. p. 6.
10. Dodds WK, Smith VH, Lohman K. Nitrogen and phosphorus relationships to benthic algal biomass in temperate streams. Can J Fish Aquat Sci. 2002;59:865–74.
11. Rosemond AD, Benstead JP, Bumpers PM, Gulis V, Kominoski JS, Manning DWP, et al. Experimental nutrient additions accelerate terrestrial carbon loss from stream ecosystems. Science. 2015;384:318–21.
12. Dodds WK, Smith VH. Nitrogen, phosphorus, and eutrophication in streams. Inland Waters. 2016;6:155–64.
13. Biggs BJF. Eutrophication of streams and rivers: dissolved nutrient-chloro-phyll relationships for benthic algae. J N Am Benthol Soc. 2000;19:17–31. 14. Biggs BJ. The contribution of flood disturbance, catchment geology and land use to the habitat template of periphyton in stream ecosystems. Freshw Biol. 1995;33:419–38.
16. Van Meter KJ, Basu NB, Veenstra JJ, Burras CL. The nitrogen legacy: emerg-ing evidence of nitrogen accumulation in anthropogenic landscapes. Environ Res Lett. 2016;11:1–12.
17. Sharpley A, Jarvie HP, Buda A, May L, Spears B, Kleinman P. Phosphorus legacy: overcoming the effects of past management practices to miti-gate future water quality impairment. J Environ Qual. 2013;42:1308. 18. Pellerin BA, Bergamaschi BA, Gilliom RJ, Crawford CG, Saraceno J,
Frederick CP, et al. Mississippi River nitrate loads from high frequency sensor measurements and regression-based load estimation. Environ Sci Technol. 2014;48:12612–9.
19. Poff NL, Ward JV. Physical habitat template of lotic systems: recovery in the context of historical pattern of spatiotemporal heterogeneity. Environ Manag. 1990;14:629–45.
20. Smith VH. Effects of eutrophication on maximum algal biomass in lake and river ecosystems. Inland Waters. 2016;6:147–54.
21. Barbour MT, Gerritsen J, Snyder BD, Stribling JB. Rapid bioassessment protocols for use in streams and wadeable rivers: periphyton, benthic macroinvertebrates and fish. 2nd ed. Washington, DC: U.S. Environmental Protection Agency Offices Water. 1998. https://archive.epa.gov/water/ archive/web/html/index-14.html. Accessed 15 June 2017.
22. Nichols SJ, Barmuta LA, Chessman BC, Davies PE, Dyer FJ, Harrison ET, et al. The imperative need for nationally coordinated bioassessment of rivers and streams. Mar Freshw Res. 2017;68:599–613.
23. Hering D, Borja A, Carstensen J, Carvalho L, Elliott M, Feld CK, et al. The European Water Framework Directive at the age of 10: a critical review of the achievements with recommendations for the future. Sci Total Environ. 2010;408:4007–19.
24. Karr JR. Defining and measuring river health. Freshw Biol. 1999;41:221–34. 25. Heiskary SA, Bouchard RW, Heiskary SA. Development of eutrophication
criteria for Minnesota streams and rivers using multiple lines of evidence. Freshw Sci. 2015;34:574–92.
26. Dodds WK, Welch EB. Establishing nutrient criteria in streams. J N Am Benthol Soc. 2000;19:186–96.
27. Sutula M. Review of indicators for development of nutrient numeric endpoints in California estuaries. Costa Mesa: Southern California Coastal Water Research Project; 2011.
28. Dodds WK. Trophic state, eutrophication and nutrient criteria in streams. Trends Ecol Evol. 2007;22:669–76.
29. Smith DR, King KW, Williams MR. What is causing the harmful algal blooms in Lake Erie? J Soil Water Conserv. 2015;70:27A–9A.
30. Otten TG, Paerl HW. Health effects of toxic cyanobacteria in U.S. drinking and recreational waters: our current understanding and proposed direc-tion. Curr Environ Heal Rep. 2015;70:75–84.
31. Steinman AD, Lamberti GA, Leavitt PR. Biomass and pigments of benthic algae. In: Hauer FR, Lamberti GE, editors. Methods in stream ecology. Burlington: Academic Press; 2006. p. 357–79.
32. Chambers PA, McGoldrick DJ, Brua RB, Vis C, Culp JM, Benoy GA. Devel-opment of environmental thresholds for nitrogen and phosphorus in streams. J Environ Qual. 2012;41:7–20.
33. Dodds WK. What controls levels of dissolved phosphate and ammonium in surface waters? Aquat Sci. 1993;55:132–42.
34. Dodds WK, Smith VH, Zander B. Developing nutrient targets to control benthic chlorophyll levels in streams: a case study of the Clark Fork River. Water Res. 1997;31:1738–50.
35. Dodds WK. Misuse of inorganic N and soluble reactive P concentra-tions to indicate nutrient status of surface waters. J N Am Benthol Soc. 2003;22:171–81.
36. Bennett MG, Lee SS. Lotic ecosystem responses to nutrients: a research-to-policy gap in experimental studies. Environ Sci Technol Submitt. 37. Ouzzani M, Hammady H, Fedorowicz Z, Elmagarmid A. Rayyan—a web
and mobile app for systematic reviews. Syst Rev. 2016;5:210. 38. Cohen J. A coefficient of agreement for nominal scales. Educ Psychol
Meas. 1960;20:37–46.
39. Fleiss JL. Measuring nominal scale agreement among many raters. Psy-chol Bull. 1971;76:378–82.
40. Collaboration for environmental evidence. Guidelines for systematic review and evidence synthesis in environmental management. Version 4.2. 2013.
http://www.environmentalevidence.org/wp-content/uploads/2014/06/ Review-guidelines-version-4.2-final.pdf. Accessed 15 June 2017.
41. Hill RA, Weber MH, Leibowitz SG, Olsen AR, Thornbrugh DJ. The Stream-Catchment (StreamCat) dataset : a database of watershed metrics for the coterminous United States. JAWRA J Am Water Resour Assoc. 2016;52:120–8.
42. Hagerthey SE, William Louda J, Mongkronsri P. Evaluation of pigment extraction methods and a recommended protocol for periphyton chlorophyll a determination and chemotaxonomic assessment. J Phycol. 2006;42:1125–36.
43. Mupepele A-C, Walsh JC, Sutherland WJ, Dormann CF. An evidence assessment tool for ecosystem services and conservation studies. bioRxiv Prep. 2015;26:1295–301.
44. Bilotta GS, Milner AM, Boyd IL. Quality assessment tools for evidence from environmental science. Environ Evid. 2014;3:14.
45. Higgins J, Green S, editors. Cochrane handbook for systematic reviews of interventions. Version 5. The Cochrane Collaboration; 2011. http://www. handbook.cochrane.org. Accessed 15 June 2017.
46. Haddaway NR, Burden A, Evans CD, Healey JR, Jones DL, Dalrymple SE, et al. Evaluating effects of land management on greenhouse gas fluxes and carbon balances in boreo-temperate lowland peat systems. Environ. Evid. 2014;3:5.
47. Underwood AJ. Beyond BACI—the detection of environmental impacts on poulations in the real, but variable, world. J Exp Mar Biol Ecol. 1992;161:145–78.
48. Te Morenga L, Mallard S, Mann J. Dietary sugars and body weight: systematic review and meta-analyses of randomised controlled trials and cohort studies. BMJ. 2013;346:e7492.
49. Johnson PI, Sutton P, Atchley DS, Koustas E, Lam J, Sen S. The navigation guide—evidence-based medicine meets environmental health: system-atic review of human evidence for PFOA effects on fetal growth. Environ Heal Perspect. 2014;122:1028–39.
50. Nakagawa S, Cuthill IC. Effect size, confidence interval and statistical significance: a practical guide for biologists. Biol Rev. 2007;82:591–605. 51. Lajeunesse M. Recovering missing or partial data from studies: a survey
of conversions and imputations for meta-analysis. In: Gurevitch J, Mengersen K, editors. Handbook of meta-analysis ecology evolution. Princeton: Princeton University Press; 2013. p. 195–206.
52. Hedges LV, Vevea JL. Fixed- and random-effects models in meta-analysis. Psychol Methods. 1998;3:486–504.
53. Viechtbauer W. Conducting meta-analyses in R with the meta for pack-age. J Stat Softw. 2010;36:1–48.
54. Gurevitch J, Hedges LV. Statistical issues in ecological meta-analysis. Ecol-ogy. 1999;80:1142–9.
55. Worm B, Myers RA. Meta-analysis of cod-shrimp interactions revels top-down control in ocean food webs. Ecology. 2003;84:162–73. 56. Lassauce A, Paillet Y, Jactel H, Bouget C. Deadwood as a surrogate for
forest biodiversity: meta-analysis of correlations between deadwood volume and species richness of saproxylic organisms. Ecol Indic. 2011;11:1027–39.
57. R Core Team. R: a language and environment for statistical computing. Vienna, Austria: R Foundation for Statistical Computing; 2016. https:// www.r-project.org. Accessed 15 June 2017.
58. Del Re A, Hoyt WT. Package “MAc”: meta-analysis with correlations. 2015.
https://cran.r-project.org/web/packages/MAc/MAc.pdf. Accessed 15 June 2017.
59. Palmer AR. Datecting publication bias in meta-analyses: a case study of fluctuating asymmetry and sexual selection. Am Nat. 1999;154:220–33. 60. Egger M, Davey Smith G, Schneider M, Minder C. Bias in meta-analysis
detected by a simple, graphical test. BMJ. 1997;315:629–34. 61. Bourassa N, Cattaneo A. Control of periphyton biomass in Laurentian
streams (Québec). J N Am Benthol Soc. 1998;17:420–9.
62. Braccia A, Eggert SL, King N. Macroinvertebrate colonization dynamics on artificial substrates along an algal resource gradient. Hydrobiologia. 2014;727:1–18.
63. DeNicola DM, Lellock AJ. Nutrient limitation of algal periphyton in streams along an acid mine drainage gradient. J Phycol. 2015;51:739–49. 64. Justus BG, Petersen JC, Femmer SR, Davis JV, Wallace JE. A comparison
• We accept pre-submission inquiries
• Our selector tool helps you to find the most relevant journal • We provide round the clock customer support
• Convenient online submission • Thorough peer review
• Inclusion in PubMed and all major indexing services • Maximum visibility for your research
Submit your manuscript at www.biomedcentral.com/submit
Submit your next manuscript to BioMed Central
and we will help you at every step:
65. Lewis WM, Mccutchan JH. Ecological responses to nutrients in streams and rivers of the Colorado mountains and foothills. Freshwater Biology 2010;55:1973–83.
66. Lohman K, Jones JR, Perkins BD. Effects of nutrient enrichment and flood frequency on periphyton biomass in northern Ozark streams. Can J Fish Aquat Sci. 1992;49:1198–205.
67. Morgan AM, Royer TV, David MB, Gentry LE. Relationships among nutrients, chlorophyll-a, and dissolved oxygen in agricultural streams in Illinois. J Environ Qual. 2006;35:1110–7.
68. Pan Y, Stevenson RJ, Hill BH, Kaufmann PR, Herlihy AT. Spatial patterns and ecological determinants of benthic algal assemblages in mid-Atlantic streams, USA. J Phycol. 1999;35:460–8.
69. Stevenson RJ, Rier ST, Riseng CM, Schultz RE, Wiley MJ. Comparing effects of nutrients on algal biomass in streams in two regions with different dis-turbance regimes and with applications for developing nutrient criteria. Hydrobiologia. 2006;561:149–65.
70. Weigel BM, Robertson DM. Identifying biotic integrity and water chem-istry relations in nonwadeable rivers of Wisconsin: toward the develop-ment of nutrient criteria. Environ Manag. 2007;40:691–708.
71. Zheng L, Gerritsen J, Beckman J, Ludwig J, Wilkes S. Land use, geology, enrichment, and stream biota in the Eastern Ridge and Valley ecoregion: implications for nutrient criteria development. J Am Water Resour Assoc. 2008;44:1521–36.
72. Rier ST, Stevenson RJ. Response of periphytic algae to gradients in nitrogen and phosphorus in streamside mesocosms. Hydrobiologia. 2006;561:131–47.