ORIGINAL ARTICLE
Penetration Estimation of GMA Backing
Welding Based on Weld Pool Geometry
Parameters
Junfen Huang, Long Xue
*, Jiqiang Huang, Yong Zou and Ke Ma
Abstract
Penetration estimation is a prerequisite of the automation of backing welding based on vision sensing technology. However, the arc interference in welding process leads to the difficulties of extracting the weld pool characteristic information, which brings great challenges to the penetration estimation. At present, most researches focus on the extraction of weld pool geometry parameters, and the visual sensing systems are complex in structure and com-plicated in the image processing algorithms. The research of penetration estimation based on weld pool geometry parameters is still in the exploratory stage. The purpose of this paper is to research the relationship between the weld pool geometry parameters and the penetration during backing welding and to estimate penetration using the weld pool geometry parameters. A passive vision sensing test system for gas metal arc (GMA) backing welding was established. An image processing algorithm was developed to extract the weld pool geometry parameters, namely, the area, maximum width and length, half-length, length-width ratio and advancing contact angle (simplified as AWP, MWWP, MLWP, HLWP, LWR and ACA, respectively). The corresponding relationships between the weld pool geom-etry parameters and the penetration state were explored by analysing their changes with the welding current and speed. The distribution of the weld pool geometry parameters corresponding to penetration was determined. When the AWP of the weld pool is within a certain range and the values of LWR and ACA are close to their maximum and minimum respectively, the penetration is in good condition. A mathematical model with the weld pool geometry parameters as independent variables and the back-bead width (the indicator of the penetration state) as a dependent variable was established based on multivariable linear regression analysis, and relevant statistical tests were carried out. Multivariable linear regression equations for the weld pool geometry parameters and the back-bead width were deduced according to the variations in the current and speed, and the equations can be used to estimate the pen-etration of backing welding. The study provides a solution to penpen-etration estimation of GMA backing welding based on automatic vision sensing.
Keywords: Welding automation, Passive vision sensing, Weld pool geometry parameters, Penetration state, Mathematical model
© The Author(s) 2019. This article is distributed under the terms of the Creative Commons Attribution 4.0 International License (http://creat iveco mmons .org/licen ses/by/4.0/), which permits unrestricted use, distribution, and reproduction in any medium, provided you give appropriate credit to the original author(s) and the source, provide a link to the Creative Commons license, and indicate if changes were made.
1 Introduction
With the development of industrial automation, intelli-gent and digital technology, automatic welding technol-ogy is now widely used in the petrochemical industry [1], construction machinery [2], shipbuilding [3], marine engineering [4], aerospace [5], rail transportation and
Open Access
*Correspondence: [email protected]
Opto-Mechatronic Equipment Technology Beijing Area Major Laboratory, Beijing Institute of Petrochemical Technology, Beijing 102617, China
other industries. The key technology of welding auto-mation, such as mechanical technology [6], sensor tech-nology [7, 8] and automatic control technology [9], has become a hot research topic. Weld quality and automatic welding performance are followed with interest.
popularization and promotion of automatic welding. Automatic extraction of penetration information is a prerequisite of backing welding automation, and related research work mainly on arc sound-, temperature field-, oscillation frequency-, ultrasonic-, infrared- and vision-based sensing methods has been carried out. The vision sensing method has attracted extensive attention globally because abundant weld pool information can be obtained with little effect on the welding process [11, 12].
Vision sensing technology is usually divided into two modes: active vision and passive vision. For active vision, the weld pool images are acquired with specific light sources, such as lasers [13]; for passive vision, the weld pool images are acquired with arc and reflection of weld pool on arc as light sources. Compared with active vision, the passive vision method is more consistent with the vision system of welders, and the image acquisition device is relatively simple, providing more flexibility in the welding field [14].
Many studies on active vision sensing technology have been carried out. Kovacevic et al. [15] proposed a sensing mechanism to detect the free weld pool sur-face. The stripes reflected from the weld pool were detected, and the reflection pattern and pool boundary were related to the weld penetration. Researchers at the University of Kentucky carried out a series of studies on monitoring the weld pool surface [16]. A laser pattern was projected on the weld pool surface, and the laser reflected from the specular surface was intercepted at a distance from the arc [17]. The reflection law has been used to analytically calculate the weld pool surface in real time [18]. Related research has also been carried out at the Lanzhou University of Technology, where Zhang et al. [19] proposed a laser vision method using a low-power fractional laser to cover the entire pool sur-face and a high-speed camera to capture the laser image reflected from the molten metal surface. The geometry feature parameters of the three-dimensional free sur-face of the weld pool are obtained off-line and are in good agreement with the measured values. However, to estimate the penetration state from any top-side meas-urements, including the weld pool surface, models are needed. Empirical modelling has been studied to cer-tain extent [20, 21]. Unfortunately, for the most prom-ising top-side measurement (3D weld pool surface), success in empirical modelling has been limited.
Meanwhile, studies on extraction of the weld pool information by passive vision methods have been per-formed in recent years [22]. Fan [23] designed a multi-light-source vision-based sensing subsystem to capture weld pool images from the top-back, top-front and back directions simultaneously according to the requirements for an aluminium alloy gas tungsten arc welding (GTAW)
control system. A narrowband composite filter system was developed, and an image acquisition scheme for the weld pool was determined. Clear and stable images of the weld pool were obtained, and an image processing algorithm was developed to extract the width and half-length of the weld pool. Shen et al. [24] proposed a two-window passive vision sensing technique for tungsten argon arc welding of an aluminium alloy, and geometry parameters such as the weld pool width and weld gap can be clearly observed. The geometric characteristics of the image can be extracted stably through image processing technology and can be used as the diagnostic informa-tion for the welding quality and seam tracking technol-ogy. Wang et al. [25] determined the acquisition time of the CCD camera and accurately found the exposure time of the CCD camera at the moment of short-circuiting transfer for visual detection of the weld pool in the pro-cess of gas metal arc (GMA) short-circuiting welding. An image acquisition method with a small angle at the front and a large angle at the back was proposed, and an image processing algorithm was designed to extract the edge of the weld pool. Gao et al. [26] designed a visual sensor composed of an ordinary CCD camera and a filter lens, and weld pool images were observed from the front of the specimen. The brightness of the images was adjusted by software according to the current in the welding pro-cess, and a clear TIG welding pool image was obtained. The geometry parameters of the weld pool were detected by the image processing algorithm. Liu et al. [27] pre-sented a real-time passive machine vision system for weld pool sensing in robotic arc welding and proposed a detection algorithm to extract the geometrical profile of the weld pool. Since the weld pool is dynamic and its image is affected by the arc, reliable extraction of geom-etry parameters is a major research focus [28]. Some researchers proposed 3D weld pool reconstruction algo-rithms based on the shape-from-shading (SFS) method [29–31]. Zhao et al. [30] used the SFS algorithm to recon-struct the surface from one single weld pool image. Two-dimensional shape parameters were extracted from a 2D image processing algorithm. Finally, an SFS algorithm was implemented on a single weld pool image to recover the surface height. However, SFS algorithms are usually complex and are thus used for off-line reconstruction of the 3D weld pool surface.
welding (GMAW) weld pool was conducted with weld pool images captured by a passive visual sensing method, and the relationships between geometric parameters and the penetration state at different welding currents and speeds were analysed. Then, equations to predict the penetration state from the geometric parameters were determined based on statistical analysis.
2 Test System and Welding Parameters
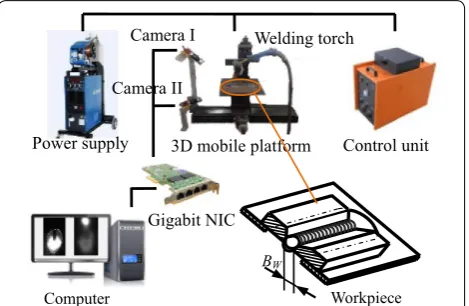
A test system for GMA backing welding was established and consisted of two parts: a welding test platform and an image acquisition system. The welding test platform comprises a welding power supply, a welding torch, a welding control unit and a 3D mobile platform, and the image acquisition system is mainly composed of a com-puter, two industrial CMOS cameras with narrowband composite filters, and a high-speed network card, as shown in Figure 1.
In the welding test platform, the welding power sup-ply (AoTai Pulse MIG-500) was used for welding, the welding control unit with PLC as the core was used to adjust the welding parameters and control the weld-ing process, and the 3D mobile platform was used for position adjustment and movement of the workpiece. The V-groove butt backing welding procedure was adopted in the tests, and the root face of the V-groove was 1 mm. The inclination angle between the welding torch and the workpiece surface was 75°, the diameter of welding wire was 1.2 mm, and the electrode exten-sion was within the range from 12 mm to 18 mm. The material for testing was a Q235 steel plate with a size of 260 mm × 90 mm × 12 mm, and CO2 was used as the shielding gas.
Two Mako G-192B/C (produced by Allied Vision, Germany) cameras were utilized for image acquisition of the front and back of the weld pool, and the camera was an industrial Gigabit Ethernet camera with a high
frame rate of 60 fps. The resolution of the camera was 1600 × 1200, and its cell size was 4.5 µm. The camera was equipped with a Computar M7528-MP lens, which had a focal length of 75 mm. Image data transmission
was achieved by an Intel PCI-E 4× Gigabit Ethernet
card, which can meet the transmission speed require-ment. Since the arc and welding spatter caused strong interference with the weld pool image in the GMA welding process, a narrowband filter with an optical attenuation film was installed at the front of the lens. A filter with a central wavelength of 650 nm and a band-width of ± 10 nm was selected, and according to image acquisition tests, the light transmittance of the optical attenuation film was 10%.
Automatic GMA backing welding tests were conducted using the test system. The welding torch and CMOS cameras for image acquisition remained stationary, and the workpiece was moved at a uniform speed during the welding process. The relationship between the weld pool geometry parameters and the penetration state was studied at different welding currents and speeds, and the welding parameters adopted are shown in Table 1.
3 Test Results and Analysis
Image acquisition of the weld pool was carried out dur-ing the welddur-ing process, and the geometric characteris-tics were extracted by an image processing algorithm. The variation trends of geometry parameters with the welding current and speed were analysed, and the dis-tribution of the geometry parameters corresponding to penetration was determined.
3.1 Image Acquisition and Processing
Image acquisition and processing were achieved using HALCON software, a set of standard machine vision algorithms developed by MVtec Company in Germany. This software has an extensive machine vision integrated development environment for rapid development of machine vision and image analysis applications.
BW
Workpiece
Power supply
Computer
Control unit 3D mobile platform
Gigabit NIC
Welding torch
Camera II Camera I
Figure 1 Backing welding test system
Table 1 Welding parameters Welding
current
I (A)
Welding speed v (cm/ min)
Diameter of welding wire
d (mm)
Groove angle αg
(°)
Root opening b
(mm)
110 15
120 20
130 25 1.2 60 1.6
140 30
150 35
To determine the relationship between each geometric parameter of the weld pool surface and its corresponding pixels in the image, camera calibration was carried out using HALCON software. The width of each pixel cor-responded to 0.025 mm, the length of each pixel corre-sponded to 0.0417 mm.
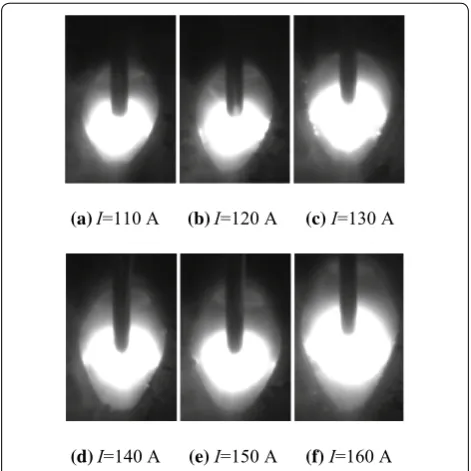
Welding tests and image acquisition were carried out according to the test scheme. Weld pool images obtained at currents from 110 A to 160 A with a step size of 10 A and a welding speed of 20 cm/min are shown in Figure 2.
The weld pool geometry parameters are shown in Fig-ure 3, where W and L represent the maximum width and length of the weld pool (MWWP and MLWP), W=W1+W2, and Lh is the half-length of the weld pool (HLWP). α is defined as the advancing contact angle
(ACA), and a, b, and c indicate lines connecting the local extreme points of the weld pool profile. The area of the weld pool (AWP), length-width ratio (LWR), ACA, MLWP and MWWP are discussed in this paper. The AWP is cal-culated by counting all the pixels included in the profile of the weld pool, denoted S; the LWR of the weld pool is expressed by R, where R=L/W; and the ACA can be com-puted by Eq. (1):
where
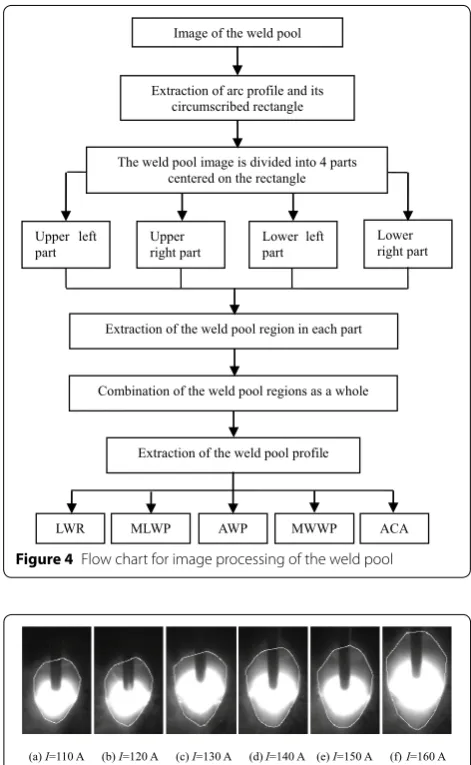
An image processing algorithm was developed to extract the profile of the weld pool and calculate AWP, MLWP, MWWP, LWR and ACA. Observing the weld pool image shows that the arc region was superimposed on the weld pool region and that the greyscale of the arc was much larger than that of the weld pool. Therefore, the arc region was first recognized by binarization, and the region around the weld pool was divided into four parts centred on the arc region. Then, the weld pool in each part was obtained by binarization, and the four parts, combined with the arc region, constituted the whole weld pool region. The profile of the weld pool was extracted, and the geometric param-eters AWP, MLWP, MWWP, LWR and ACA were calcu-lated. The flow chart for image processing of the weld pool is shown in Figure 4. The extracted weld pool profiles at currents from 110 A to 160 A are shown in Figure 5.
3.2 Relationship between Weld Pool Geometry Parameters and Penetration at Different Currents
The welding parameters were as follows: the welding cur-rent was changed from 110 A to 160 A with a step size of 10 A, the welding speed was 20 cm/min, the groove angle was 60°, and the groove gap was 1.6 mm. The backs of welds are shown by Figure 6. The penetration state is usually characterized by the bead width, and a back-bead width between 2 mm and 3 mm indicates that com-plete penetration is achieved for the V-groove workpieces used in the tests. It can be concluded that incomplete penetration of the weld root appears at a current of 100 A or 120 A (the back-bead width is less than 2 mm), that the penetration is good at a current of 130 A or 140 A, and that excessive penetration occurs when the welding current is set to 150 A or 160 A (the back-bead width is greater than 3 mm).
(1)
α= arc cosa2+b2−c2/2ab,
(2)
a=
L2h+W12,
(3)
b=
L2h+W22.
(a) I=110 A (b)I=120 A (c) I=130 A
(d)I=140 A (e) I=150 A (f)I=160 A Figure 2 Weld pool images of GMAW at different currents
W
W1 W2
L
Lh a b
c
α
We
lding directio
n
The weld pool images were captured continuously dur-ing backdur-ing welddur-ing, and the geometric parameters AWP, MLWP, MWWP, HLWP, LWR and ACA were calculated.
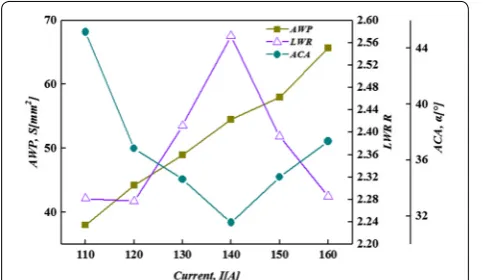
To improve the reliability of the geometry parameters, the mean value of the same geometry parameter in more than 100 weld pool images was calculated to represent the weld pool geometry parameter under a set of dif-ferent welding parameters. The geometry parameters AWP, LWR and ACA vary with the current as shown in Figure 7.
As seen from Figure 7, with the increase in welding cur-rent, the AWP keeps increasing, the LWR first increases and then decreases with a maximum value at the 140 A current, and the ACA has a variation trend opposite to the LWR. Complete penetration of the weld is achieved when the values of LWR and ACA are near their maxi-mum and minimaxi-mum respectively and the value of AWP is in a certain range.
The AWP is affected by the heat input to the weldment and the propagation velocity of the heat in the weldment. The greater the welding current is, the more heat is input into the weldment per unit time, which results in a higher temperature of the weldment and a greater tempera-ture range above the melting point. Therefore, the AWP increases with the welding current, and the MLWP (L) and MWWP (W) also increase with the current at differ-ent slopes, as shown in Figure 8. On the other hand, the HLWP (Lh) has a local maximum at 140 A in the process of increase. The variation trends of MLWP, MWWP and HLWP lead to the inflection points of the LWR and ACA observed in Figure 7.
3.3 Relationship between Weld Pool Geometry Parameters and Penetration at Different Welding Speeds
The backing welding tests were carried out while chang-ing the weldchang-ing speed from 15 cm/min to 40 cm/min. The welding current was set to 140 A, the groove angle was 60°, and the root opening was 1.6 mm. The back of each weld is shown in Figure 9. It can be concluded that excessive penetration appears at a speed of 15 cm/min
Image of the weld pool
Extraction of arc profile and its circumscribed rectangle
The weld pool image is divided into 4 parts centered on the rectangle
Upper left
part Upper right part Lower leftpart Lower right part
Extraction of the weld pool region in each part
Combination of the weld pool regions as a whole
Extraction of the weld pool profile
AWP MWWP
MLWP
LWR ACA
Figure 4 Flow chart for image processing of the weld pool
(a) I=110 A (b) I=120 A (c) I=130 A (d) I=140 A (e) I=150 A (f) I=160 A Figure 5 Weld pool profiles at different currents
(a) I=110 A (b) I=120 A (c) I=130 A
(the back-bead width is greater than 3 mm), that the penetration is good at speeds of 20 cm/min, 25 cm/min and 30 cm/min, and that incomplete penetration occurs
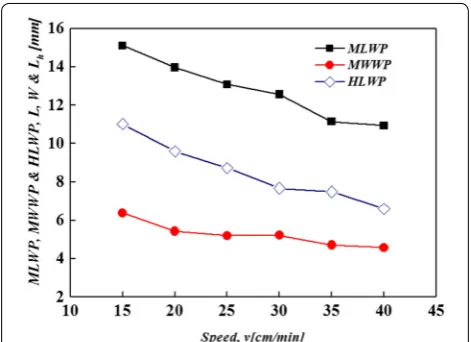
when the welding speed is set to 35 cm/min or 40 cm/ min (the back-bead width is less than 2 mm). The varia-tion in the geometry parameters with the welding speed is shown in Figure 10.
Figure 10 shows that with the increase in the welding speed, the AWP decreases; the LWR first increases and then decreases with a maximum value at the 20 cm/min welding speed; and the minimum value of the ACA also appears at the 20 cm/min welding speed. The penetration is in good condition when the value of AWP is in a cer-tain range with the LWR close to the maximum and the ACA close to the minimum.
As the welding speed increases, the time within which the arc acts on the groove per unit length becomes shorter, and the welding heat input decreases, which leads to a decrease in the AWP. Meanwhile, the geometry parameters MWWP (W), MLWP (L) and HLWP (Lh) all decrease, but each parameter has a different descend-ing gradient, as shown in Figure 11, which leads to the changes in the LWR and ACA with the speed shown in Figure 10.
Figure 7 Variation trends of AWP, LWR and ACA with the current
Figure 8 Variation trends of MLWP, MWWP and HLWP with the current
(a) v=15 cm/min (b) v=20 cm/min (c) v=25 cm/min
(d) v=30 cm/min (e) v=35 cm/min (f) v=40 cm/min
Figure 9 Back of welds at different speeds
It can be deduced from the above test data that com-plete penetration of the weld corresponds to a certain range of AWP values. Furthermore, referring to the val-ues of the LWR and ACA is necessary to determine the penetration state more accurately.
4 Estimation of Penetration from Weld Pool Geometry Parameters
The above test results show that the AWP, MLWP and MWWP increase monotonically with the welding cur-rent and decrease monotonically with the welding speed. Meanwhile, the back-bead width, which is used to char-acterize the penetration state, increases with the cur-rent and decreases with the speed gradually. Therefore, there may be a linear relationship between the penetra-tion state and the three geometry parameters. Multi-variable linear regression analysis is used to determine the relationship between the three geometry parameters and the penetration state. Multivariable linear regres-sion is a statistical analysis method that studies the linear relationship between a dependent variable and multi-ple independent variables, and the basic purpose of this method is to estimate the dependent variable with the values of multiple independent variables. A multivari-able linear regression model is established to determine the strength and significance of the influence of the AWP, MLWP and MWWP on the penetration state and to esti-mate the penetration.
4.1 Establishment of a Multivariable Linear Regression Model and Statistical Tests
The independent variables are the AWP, MLWP and MWWP, which are represented by S, L and W, respec-tively, and the dependent variable is the back-bead width,
represented by Bw. The multivariable linear regression
model is as follows:
where ε is an error term used to explain the part of a change in a dependent variable that cannot be completely explained by the independent variables, ε is independ-ent and idindepend-entically distributed with zero mean. βj (j= 0,
1, 2, 3) is an undetermined parameter with an estimated value βˆ
j calculated by the least-squares method using
the experimental sample data. Then, a multivariable lin-ear regression model for predicting penetration can be obtained:
where β0ˆ is a constant term and β1ˆ , β2ˆ and β3ˆ are
regres-sion coefficients. β1ˆ is a partial regression coefficient of
S on Bw, i.e., the effect of one unit addition of S on Bw;
similarly, βˆ2 and βˆ3are the partial regression coefficients
of L and W on Bw.
The model, Eq. (5), needs to be checked by a goodness-of-fit test (R-square test), the regression equation sig-nificance test (F test) and the variable significance test (t test). In the goodness-of-fit test, the adjusted coefficient of determination R¯2 is as follows:
where RSS=
(Bwi− ˆBwi) 2
(RSS, residual sum of
squares), Bwi is the sample value of the dependent vari-able, Bˆ
wi is the linear regression value of the
depend-ent variable, TSS=
(Bwi− ¯Bw)2 (TSS, total sum of
squares), B¯
w is the sample mean of the dependent
vari-able, n is the number of samples, k is the number of independent variables (k= 3), n−k−1 is the degree of freedom of RSS, and n−1 is the degree of freedom of TSS. The value of R¯2
should be greater than 0.5, and the closer it is to 1, the better the fitting degree of the regres-sion line to the sample values. The F test is used to infer whether the linear relationship between the dependent variable and the independent variables is generally sig-nificant in the model, that is, whether the partial regres-sion coefficients of βˆ
j (j= 1, 2, 3) in the model, Eq. (5), are
significantly not 0. The statistic F is calculated as follows:
where ESS=
(Bˆwi− ¯Bw)2 (ESS, explained sum of squares). Given the significance level α, if F≥Fα (k,
n−k−1) is satisfied, then the linear regression model is
(4)
Bw=β0+β1S+β2L+β3W +ε, ε∼N(0, σ2),
(5)
ˆ
Bw= ˆβ0+ ˆβ1S+ ˆβ2L+ ˆβ3W,
(6)
¯
R2=1−RSS/(n−k−1)
TSS/(n−1) ,
(7)
F = ESS/k
RSS/(n−k−1), Figure 11 Variation trends of MLWP, MWWP and HLWP with the
significant. Otherwise, the linear regression model is not significant.
The F test can demonstrate that the overall linear rela-tionship of the linear regression equation is significant, but cannot show that each independent variable has a significant influence on the dependent variable. There-fore, each independent variable must be subjected to a significance test to determine whether the independent variable is retained in the model, which is done by the t test of the variable. The statistic t is calculated as follows:
where S(βˆj) is the standard deviation of βˆj . For the
hypothesis of each βj≠ 0 (j= 1, 2, 3), the significant
prob-ability Sig. < 0.05 of the t test indicates that a linear rela-tionship of S, L and W with Bw significantly accepts the
hypothesis; otherwise, the hypothesis is rejected.
4.2 Regression Equation between the Weld Pool Geometry Parameters and the Back‑Bead Width
Considering the close relationship between the back-bead width and the penetration state, the back-back-bead width is used to quantify the penetration. The method for determination of the back-bead width correspond-ing to each weld pool image was as follows: The image of the back side of weld pool was captured with the cam-era below the workpiece, which was synchronized with the camera above the workpiece for image acquisition of the weld pool surface. The information of the back-bead width was extracted by the image processing algorithm
(8)
t= ˆ
βj−βj
S(βˆj)
,
(see Figure 3) and then converted to the physical length by the camera calibration.
First, the regression equation between the geom-etry parameters and the back-bead width was estab-lished under the condition that the welding current was adjusted from 110 A to 160 A. The sample data (the AWP, MLWP, MWWP and back-bead width) under each set of welding parameters were no less than 50 groups. The sample data were handled by the least-squares fitting and the result obtained is shown in Table 2. The adjusted R squared is 0.767, which suggests that the regression equa-tion has a high goodness of fit. The F is 583.655, which is much larger than the Fα (3, m-3-1) value of 2.622
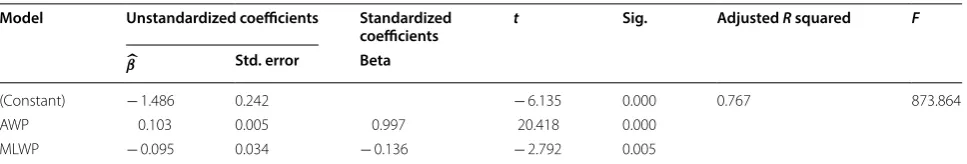
when the sample number m is 532 at a significance level α= 0.05. That is, the linear relationship of the established multivariable regression model is significant at the 95% level. However, for the hypothesis that the 3 regression coefficients are not equal to zero, the MWWP’s signifi-cance probability Sig. > 0.05 in the t test indicates that the linear relationship of the MWWP to the back-bead width of the weld pool does not accept the hypothesis significantly when the current changes. Therefore, only the AWP and MLWP were taken as the independent variables, and the corresponding relationship between them and the back-bead width was analysed. The result is shown in Table 3.
The standardized coefficients (Beta) in Table 3 are the regression coefficients calculated after the sample data are standardized (the difference between each sample and the mean is divided by the variance), which negates the influence of dimensions. According to the standard-ized coefficients, the AWP is the dominant factor in the
Table 2 Partial regression coefficients at different currents Model Unstandardized coefficients Standardized
coefficients t Sig. Adjusted R squared F
β Std. error Beta
(Constant) − 1.832 0.371 − 4.944 0.000 0.767 583.655
AWP 0.096 0.007 0.932 12.937 0.000
MLWP − 0.086 0.035 − 0.124 − 2.474 0.014
MWWP 0.103 0.084 0.06 1.233 0.218
Table 3 Partial regression coefficients without the MWWP at different currents Model Unstandardized coefficients Standardized
coefficients t Sig. Adjusted R squared F
β Std. error Beta
(Constant) − 1.486 0.242 − 6.135 0.000 0.767 873.864
AWP 0.103 0.005 0.997 20.418 0.000
linear relationship between the geometry parameters and the back-bead width, and the MLWP plays an auxiliary role.
As shown in Table 3, the regression equation between the weld pool geometry parameters and the back-bead width at different welding currents is
Eq. (9) shows the coupling relationship between the geometry parameters and the back-bead width.
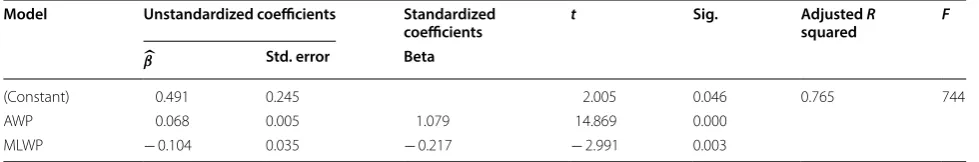
Similarly, multivariable linear regression analysis was used to analyse the relationship between the AWP, MLWP, and MWWP and the back-bead width with the increase in welding speed. Since the MWWP’s signifi-cance probability Sig. (equal to 0.259) was greater than
0.05 in the t test, the MWWP was removed from the
independent variables and the relationship between the AWP, MLWP and the back-bead width was analysed. As shown in Table 4, the regression equation is
According to the standardized coefficients in Table 4, the AWP plays a dominant role in the linear relationship with back-bead width and the MLWP plays an auxiliary role.
4.3 Verification Tests of Backing Welding
To determine the reliability of regression equations Eq. (9) and Eq. (10), the above equations were verified by backing welding tests. The welding parameters for Eq. (9) verification were as follows: the welding current was varied from 110 A to 160 A with a step size of 10 A, the welding speed was 20 cm/min, the workpiece groove angle was 60°, the welding wire diameter was 1.2 mm,
(9) ˆ
Bw= −1.486+0.103S−0.095L.
(10) ˆ
Bw=0.491+0.068S−0.104L.
and the root opening was 1.6 mm. The backing welding tests were carried out, the images of the surface and back side of the weld pool were captured synchronously, and the geometry parameters of the weld pool were extracted and substituted into Eq. (9) to estimate the back-bead width. The actual back-bead width was determined based on the back-side images of the weld pool. The mean val-ues of the estimated back-bead width ( Bˆ
w ) and actual
back-bead width (Bw) at different currents are shown in
Table 5.
As seen from Table 5, the back-bead width estimated by Eq. (9) agrees well with the actual back-bead width with the increase in the current. The penetration is in good condition under the currents of 130 A and 140 A, and the estimated back-bead width is in the same range from 2 mm to 3 mm as the actual back-bead width with a small deviation. This result indicates that the relation-ship between the weld pool geometry parameters and the back-bead width determined by Eq. (9) is reliable.
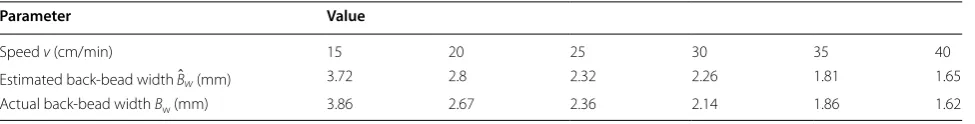
The welding parameters for Eq. (10) verification were as follows: the welding speed was varied from 15 cm/ min to 40 cm/min with a step size of 5 cm/min, the welding current was 140 A, the workpiece groove angle was 60°, the welding wire diameter was 1.2 mm, and the groove gap was 1.6 mm. The mean values of the back-bead width estimated by Eq. (10) ( Bˆ
w ) and the actual
back-bead width (Bw) determined based on the
back-side images of the weld pool are shown in Table 6. In Table 6, the estimated back-bead widths are essen-tially consistent with the actual back-bead widths, and the estimated back-bead width corresponding to pene-tration in good condition is in the 2 mm to 3 mm range at the speeds of 20 cm/min, 25 cm/min and 30 cm/ min, which is the same as the actual back-bead width.
Table 4 Partial regression coefficients at different speeds
Model Unstandardized coefficients Standardized
coefficients t Sig. Adjusted squared R F
β Std. error Beta
(Constant) 0.491 0.245 2.005 0.046 0.765 744
AWP 0.068 0.005 1.079 14.869 0.000
MLWP − 0.104 0.035 − 0.217 − 2.991 0.003
Table 5 Estimated and actual mean values of the back-bead width at different currents
Parameter Value
Current I(A) 110 120 130 140 150 160
Estimated back-bead width Bˆw (mm) 1.58 1.9 2.28 2.86 3.22 3.8
Therefore, the corresponding relationship between the geometry parameters and the back-bead width deter-mined by Eq. (10) is reasonable.
The above linear regression analysis and experimental verification show that the linear relationship between the weld pool geometry parameters and the back-bead width is feasible when the welding current or welding speed changes, that the AWP plays a leading role in the relationship with the back-bead width, and the MLWP plays an auxiliary role. The partial regression coeffi-cients and constant in Eq. (9) are different from those in Eq. (10) because the change in heat input caused by variation in welding current is different from that caused by variation in welding speed. Different changes in heat input lead to distinctions in the variation trends of the weld pool geometry parameters and back-bead width. When the welding current and speed change simultaneously, the coupling effects of two welding parameters in the welding process will lead to the non-monotonic variation trends of the AWP, MLWP and back-bead width, which does not meet the prerequisite of multivariable linear regression analysis. Therefore, the penetration estimation can not be achieved by com-bining the above two regression equations (Eq. (9) and Eq. (10)) into an equation in the case of simultaneous changes in the welding current and speed.
5 Conclusions
(1) With the increase in the welding current, the AWP, MLWP and MWWP increase monotonically, and the distributions of the LWR and ACA have inflec-tion points; with the increase in the welding speed, the AWP, MLWP and MWWP decrease monotoni-cally and the inflection points also appear in the distributions of LWR and ACA. When the AWP of the weld pool is within a certain range and the val-ues of LWR and ACA are close to their maximum and minimum respectively, the penetration is in good condition.
(2) Multivariable linear regression equations are estab-lished to determine the corresponding relationship between the geometry parameters AWP, MLWP and the back-bead width when the welding current
or welding speed changes. In the relationship, the AWP plays a leading role, and the MLWP plays an auxiliary role. The study provides basic data for the automation of backing welding with visual sensing.
Abbreviations
GMA: gas metal arc; AWP: area of the weld pool; MWWP: maximum width of the weld pool; MLWP: maximum length of the weld pool; HLWP: half-length of the weld pool; LWR: length-width ratio of the weld pool; ACA : advancing contact angle of the weld pool.
Authors’ Contributions
JFH was in charge of the whole trial and wrote the manuscript; LX assisted with the establishment of the welding test platform and trial data analyses; JQH assisted with the establishment of the image acquisition system and related tests; YZ assisted with the GMA backing welding tests; KM assisted with the image acquisition and backing welding tests. All authors read and approved the final manuscript.
Authors’ Information
Junfen Huang, born in 1975, is currently a teacher at Opto-Mechatronic Equip-ment Technology Beijing Area Major Laboratory, Beijing Institute of Petrochemical Technology, China. She received her PhD degree from Beijing University of Technology, China, in 2005. Her research interests include automation welding technology and underwater welding.
Long Xue, born in 1966, is currently a professor at Opto-Mechatronic Equip-ment Technology Beijing Area Major Laboratory, Beijing Institute of Petrochemi-cal Technology, China. He received his PhD degree from China University of Petroleum, China, in 2014. His research interests include man-machine system, welding robotics and ocean engineering.
Jiqiang Huang, born in 1971, is currently an associate professor at Opto-Mechatronic Equipment Technology Beijing Area Major Laboratory, Beijing Institute of Petrochemical Technology, China. He received his PhD degree from Beijing University of Technology, China, in 2004. His research interests include automation welding technology and underwater welding.
Yong Zou, born in 1976, is currently an associate professor at Opto-Mechatronic Equipment Technology Beijing Area Major Laboratory, Beijing Institute of Petrochemical Technology, China. He received his PhD degree from Beihang University, China, in 2016. His research interest is automation welding technology.
Ke Ma, born in 1993, is currently a master candidate at Opto-Mechatronic Equipment Technology Beijing Area Major Laboratory, Beijing Institute of Petrochemical Technology, China. His research interest is automation welding technology.
Competing Interests
The authors declare that they have no competing interests.
Funding
Supported by National Natural Science Foundation of China (Grant No. 51505035), Key Project of Science and Technology Plan of Beijing Municipal Education Commission of China (Grant No. KZ201810017022), National Key
Table 6 Estimated and actual mean values of the back-bead width at different speeds
Parameter Value
Speed v (cm/min) 15 20 25 30 35 40
Estimated back-bead width Bˆw (mm) 3.72 2.8 2.32 2.26 1.81 1.65
R&D Program of China (Grant No. 2017YFB1303300) and National Science and Technology Major Project of China (Grant No. 2018ZX04044001-009).
Received: 15 July 2018 Accepted: 22 May 2019
References
[1] Y Lei, X B Yuan, X N Sun. Application situation and prospect of automatic welding technology faced on pressure vessel. Pressure Vessel Technology, 2004, 21(10): 35–40. (in Chinese)
[2] G Q Hou, G F Liao, R Ma, et al. Research on improving the efficiency and welding quality of welding robot for construction machinery struc-ture. Journal of Shanghai Jiao Tong University, 2016, 50(Sup.): 40–43. (in Chinese)
[3] G J Li, C H Wu, B D Xu, et al. Ship curved plate column welding automa-tion. Marine Technology, 2017, (2): 68–72. (in Chinese)
[4] L Xue, J M Wu, J F Huang, et al. Welding polarity effects on weld spatters and bead geometry of hyperbaric dry GMAW. Chinese Journal of Mechani-cal Engineering, 2016, 29(2): 351–356.
[5] Y Z Rong, R P Liu, Y H Wei. Welding database and expert system for aviation. Aeronautical Manufacturing Technology, 2017, (12): 43–47. (in Chinese)
[6] L Xue, Y Zou, J Q Huang, et al. Constant speed control for complex cross-section welding using robot based on angle. Chinese Journal of Mechani-cal Engineering, 2014, 27(2): 260–268.
[7] J F Yue, L Y Li, F L Fan, et al. Welding pool adaptive vision detection for arc welding robot gas metal arc welding. Journal of Mechanical Engineering, 2008, 44(4): 206–210. (in Chinese)
[8] Y Zou, L P Jiang, Y H Li, et al. Welding deviation detection algorithm based on extremum of molten pool image. Chinese Journal of Mechanical Engineering, 2016, 29(1): 74–83.
[9] J Q Huang, L Xue, J F Huang, et al. Arc behavior and joints performance of CMT welding process in hyperbaric atmosphere. Acta Metallurgica Sinica, 2016, 52(1): 93–99. (in Chinese)
[10] Y K Liu, Y M Zhang. Supervised learning of human welder behaviors for intelligent robotic welding. IEEE Transactions on Automation Science and Engineering, 2017, 14(3): 1532–1541.
[11] A S Baskoro, R Tandian, Haikal, et al. Automatic tungsten inert gas (TIG) welding using machine vision and neural network on material SS304. Proceedings of International Conference on Advanced Computer Science and Information Systems, East Java, Indonesia, October 15–16, 2016: 427–432. [12] U Reisgen, P Lozano, S Mann, et al. Process control of gas metal arc weld-ing processes by optical weld pool observation with combined quality models. Proceedings of IEEE International Conference on Automation Science and Engineering, Gothenburg, Sweden, Aug 24–28, 2015: 407–410. [13] J S Chen, J Chen, Z L Feng, et al. Dynamic evolution of the weld pool
reflection during weld penetration development. Proceedings of IEEE International Conference on Advanced Intelligent Mechatronics (AIM), Banff, Alberta, Canada, July 12–15, 2016: 548–553.
[14] T F Comas, C L Diao, J L Ding, et al. A passive imaging system for geom-etry measurement for the plasma arc welding process. IEEE Transactions on Industrial Electronics, 2017, 64(9): 7201–7209.
[15] R Kovacevic, Y M Zhang. Real-time image processing for monitoring of free weld pool surface. Journal of Manufacturing Science and Engineering, 1997, 119(5): 161–169.
[16] Y K Liu, Y M Zhang. Dynamic control of 3D weld pool surface based on human response model. Proceedings of 19th World Congress of the Inter-national Federation of Automatic Control, Cape Town, South Africa, August 24-29, 2014: 10640–10645.
[17] H Song, Y M Zhang. Error analysis of a three-dimensional GTA weld pool surface measurement system. Welding Journal, 2009, 88(7s): 141–148. [18] W J Zhang, X W Wang, Y M Zhang. Analytical real-time measurement of a
three-dimensional weld pool surface. Measurement Science and Technol-ogy, 2013, 24(11): 5011–5028.
[19] G Zhang, Y Shi, C K Li, et al. Measurement of characteristic parameters of three dimensional weld pool surface in Tungsten Inert Gas arc welding based on laser-vision. Journal of Shanghai Jiao Tong University, 2015, 49(3): 301–305. (in Chinese)
[20] Y K Liu, W J Zhang, Y M Zhang. Estimation of weld joint penetration under varying GTA pools. Welding Journal, 2013, 92(11): 313s–321s.
[21] Y K Liu, Y M Zhang. Model-based predictive control of weld penetration in Gas Tungsten Arc Welding. IEEE Transactions on Control Systems Technol-ogy, 2014, 22(3): 955–966.
[22] F Gao, M L Lu, B L Xu, et al. Multi region segmentation algorithm based on edge preserving for molten pool image. Proceedings of International Conference on Control, Automation and Information Sciences, Ansan, Korea, October 27-29, 2016: 210–214.
[23] C J Fan. Weld pool characters extraction visual sensing and intelligent control during varied gap aluminum alloy pulsed GTAW process. Shanghai: Shang-hai Jiao Tong University, 2008. (in Chinese)
[24] H Y Shen, H B Chen, T Lin, et al. Passive visual technology in aluminum alloy welding. Journal of Shanghai Jiao Tong University, 2015, 49(3): 341–343. (in Chinese)
[25] D M Wang, J Q Gao, C S Wu, et al. Vision-based detection of weld pool in short-circuit gas metal arc welding. Transactions of The China Welding Institution, 2008, 29(10): 85–88. (in Chinese)
[26] J Q Gao, C S Wu. Vision-based measuring of weld pool geometry in TIG welding. Acta Metallurgica Sinica, 2000, 36(12): 1284–1288. (in Chinese) [27] J Liu, Z Fan, S I Olsen, et al. A real-time passive vision system for robotic
arc welding. Proceedings of the IEEE International Conference on Automa-tion Science and Engineering, Gothenburg, Sweden, 2015: 389–394. [28] A M Neill, J P H Steele. Modeling and simulation of three dimensional
weld pool reconstruction by stereo vision. Proceedings of IEEE Inter-national Conference on Advanced Intelligent Mechatronics (AIM), Banff, Alberta, Canada, July 12–15, 2016: 542–547.
[29] J Wang, W Wang, S Chen. Inspection of welding pool height from shad-ing in pulsed GTAW with wire filler. Industrial Robot: An International Journal, 2009, 36(3): 270–276.
[30] D B Zhao, J Q Yi, S B Chen, et al. Extraction of three-dimensional param-eters for weld pool surface in pulsed GTAW with wire filler. Journal of Manufacturing Science and Engineering, 2003, 125(3): 493–503. [31] L P Li, X Q Yang, F Y Zhang, et al. Research on surface recover of