This is the author's final version of the work, as accepted for publication following peer review but without the publisher's layout or pagination.
Davis, H. and Anderson, M. (2010) Developmental and individual differences in fluid intelligence: Evidence against the unidimensional hypothesis. British Journal of Developmental Psychology, 19 (2). pp. 181-206.
http://researchrepository.murdoch.edu.au/16905
Developmental and Individual Differences in Fluid Intelligence and Speed of
Processing: Evidence against the Unidimensional Hypothesis.
In this paper we wish to make two arguments which are in principle
independent but in practice intertwined. The first concerns the theoretical issue of
whether changes in speed of processing can account for developmental change in
intellectual performance. The second concerns the methodological problems with the
data commonly taken to have confirmed the speed theory. First, we shall deal with
the theoretical issue.
Over the past decade, the theory that increasing speed of information
processing plays a causal role in the age-related growth of intellectual ability observed
in children has gained some prominence (Fry & Hale, 1996; Hale, 1990; Kail, 1991a,
1991b, 1992; Kail & Park, 1994; Kail & Salthouse, 1994; Nettelbeck & Wilson,
1985). The main evidence for this theory centres around the robust finding that
children’s reaction time (RT) becomes faster with age, and this is true for a diversity
of tasks, suggesting that processing speed is a global causal factor in developmental
change. Further, it is argued that RT gains follow an exponential trajectory (Kail,
1991a), suggesting a biological (maturational) underpinning rather than learning
(Mazur & Hastie, 1978).
A parallel theory in the field of individual differences in intelligence holds that
differences between high- and low-IQ adults may be attributed to differences in their
speed of information processing (Jensen, 1985; Nettelbeck, 1987; Anderson, 1992).
show systematic differences in RT (Jensen, 1985) and also inspection time (IT),
another measure of speed of processing (Nettelbeck, 1987).
It would be parsimonious to unify these theories so that intellectual variation
between age groups (or mental age, MA, variance) and within age groups (or IQ
variance) are accounted for by the one common factor, speed of information
processing. We shall refer to this as the unidimensional model of intelligence. An
important consequence of this view is that, during the developmental period, MA is a
fundamental measure while IQ is a derivation from it -- there is no such thing as a
more or less intelligent child, only a more or less cognitively developed one.
Similarly, among adults, IQ must be considered a sort of MA at which intellectual
ability ceases to increase. This corollary, however, encounters empirical difficulties.
Firstly, if MA is a fundamental variable driven by increasing speed of
processing then we would expect that children of various chronological ages (CA)
matched for MA should be cognitively indistinguishable. In fact, such MA-matched
children display systematically different performance profiles on IQ subtests (Spitz,
1982) and on information processing tasks (Weiss, Weisz & Bromfield, 1986) with
younger high-IQ children performing better on tests involving abstract thought and on
a range of information processing tasks than their older MA-matched counterparts
(who perform better on tests which tap knowledge and experience). This implies that
children of the same MA are not, in fact, matched on information processing
efficiency if chronological age (and hence also IQ) is allowed to vary.
Secondly, under the unidimensional model there is no prima facie reason to
expect an individual’s IQ to show any continuity with age. If speed is responsible for
reasoning ability and it changes with age, then there is no obvious reason why a
(as it does, Hindley & Owen, 1978) since the unidimensional model specifies no
constant factor to account for the stability of IQ differences among children of the
same cohort.
It was partly the recognition of these shortcomings of the unidimensional
model that led Anderson (1992) to propose an alternative model in which cognitive
development and individual differences in intelligence represent two distinct
dimensions of intellectual ability. We shall refer to this as the multidimensional
model. Specifically, Anderson argues that speed of processing is responsible for
differences in intelligence within age groups, but that speed does not change with age.
Anderson attributes between-age differences in intellectual ability to the maturation of
modules and attentional processes.
Bjorklund and Harnishfeger (1990) argue that cognitive development is due to
the maturation of inhibitory processes orthogonal to the activatory processes
associated with cognitive speed or capacity increase. They argue that the ability to
prevent task-irrelevant information from consuming limited cognitive resources
increases overall efficiency of task-relevant information processing, and they present
evidence that inhibitory ability improves with age (see also Dempster, 1991). This
separation of inhibitory from activatory processing is consistent with Anderson’s
multidimensional view. Thus, the key difference between the unidimensional and
multidimensional models is that the former predicts that speed will be associated with
both within- and between-age differences in intelligence while the multidimensional
model predicts that speed will be associated with within-age differences in
intelligence only.
Turning now to the data and the methodological issue, empirical studies have
1978; Jensen, 1982; Kail, 1986) and inspection time (IT) (e.g., Nettelbeck, 1987;
Nettelbeck & Wilson, 1985) and have reported significant correlations with age and
also IQ. Such correlations are not, however, universally accepted as evidence for the
speed theory. The two main kinds of objection raised are, firstly, that rather than
speed causing differences in intellectual ability, intellectual ability might cause
differences in measured speed. That is, more intelligent individuals might apply more
efficient strategies to the speed task (e.g., Hunt, 1980; Sternberg, 1983 and see also
Fry & Hale, 1996), and secondly, RT and IT tasks might be measuring a host of
factors other than speed of information processing (e.g., Anderson, 1989; Longstreth,
1984). Thus, simple correlations between intellectual ability and RT or IT are
inadequate tests of the speed theory and a finer grained analysis is called for. Two
methods of analysis, which offer the opportunity at least to address some of the
objections raised above, are the Brinley plot and the partial correlation. We will
examine these in turn.
The Brinley Plot Method
The Brinley (1965) plot’s logic develops from Hick’s (1952) law, that RT
increases as a linear function of the amount of information to be processed (measured
in ‘bits’). The slope of this function assesses the amount of information processed per
unit time (i.e., speed of processing) while the intercept represents the amount of time
consumed by peripheral processes that are constant for an individual across all
information loads. Such processes would include perceptual and motoric speed and
general attentional factors responsible for keeping an individual on task. (Although
attentional factors are normally considered central rather than peripheral, for the sake
their effects would emerge in intercept rather than slope and would not be separable
from perceptual and motor speed.) So, for an individual, RT = P + C, where P is
peripheral processing time and C is central processing time. The RT of a slower
individual can be represented as RTslow = aP + bC, where a is the slowing coefficient
which applies to peripheral processing and b is the slowing coefficient which applies
to central processing.
The Brinley plot involves plotting the RT scores of one group of individuals
on a range of different tasks and conditions against the RT scores of another group of
individuals on the same tasks and conditions (Kail, 1991b; Myerson, Wagstaff, &
Hale, 1994). The groups most often compared are individuals of different ages
(children versus young adults or old versus young adults) in order to test the theory
that speed of processing increases with development and decreases again in old age.
In the present study we shall be focusing on children. By algebraic manipulation of
the equations above, children’s RT across task conditions can be expressed as a
function of the young adults’ RT, as shown in equation (1) (Cerella, 1990):
RTchild = bRTadult + P(a-b) (1)
(If the central and peripheral slowing factors are equal in magnitude, then this
equation reduces to a simple multiplicative model: RTchild = bRTadult.)
If the plot conforms to a linear function (R2 is approximately 1), this has traditionally
been taken as evidence that the change in speed of all central processes in all domains
is reducible to a single global factor (Kail, 1991b). However, recent simulation
studies indicate that R2 can produce both false positive and false negative results
(Fisk & Fisher, 1994; Perfect, 1994; Anderson, 1995) and it has been argued that
monotonicity rather than linear fit is a better indicator of unidimensionality (Dunn &
The slope of a linear Brinley plot can be interpreted as the difference between
the two groups’ slopes under the Hick function. Thus, a slope of one indicates that the
two groups do not differ in global speed, whereas a slope greater than one indicates a
difference in central processing speed between the two groups. The Brinley intercept
reflects the difference between peripheral and central slowing factors. Thus, an
intercept of zero indicates identical peripheral and central slowing, a positive intercept
indicates that peripheral slowing is greater than central slowing and a negative
intercept indicates that central slowing exceeds peripheral slowing (Cerella, 1990).
Thus, a monotonic Brinley plot suggests that group differences are
general while a non-monotonic plot indicates that group differences are
domain-specific (or a consequence of different strategies being used). The slope of a linear
plot reflects any central speed differences between the groups. The intercept of a
linear plot reflects the relative magnitude of central versus peripheral slowing
coefficients in RT task performance. While Brinley plots may not be ideal for
distinguishing between domain-general (linear) and domain-specific (non-linear)
differences in speed, given a linear plot, it should be possible to distinguish between
true speed differences (slope) and differences in RT task performance due to factors
other than central speed (intercept).
The Brinley plot technique has been used primarily to investigate differences
in speed of processing between young and old adults (e.g., Cerella, 1994; Cerella &
Hale, 1994; Fisk & Fisher, 1994; Smith, Poon, Hale, & Myerson, 1988) and also in
several studies comparing children to young adults (e.g., Fry & Hale, 1996; Hale,
1990; Kail, 1991b) but not yet to compare high and low IQ children. The studies
drives cognitive development, as indicated by Brinley slope decreasing with age, but
as we shall see, these conclusions may be premature.
General Requirements of the Brinley Plot
For the Brinley plot method to offer an adequate test of the speed theory in
general, and the unidimensional and multidimensional models in particular, several
requirements need to be met. Firstly, to avoid a bias toward linearity, it is necessary
that the RT tasks sampled invoke plausibly different cognitive systems and, wherever
possible, systems that might be expected to differ in their course of development.
Kail (1986, 1991b) and Hale (1990) use tasks to invoke both verbal and spatial
systems, which evidence suggests to be distinct from each other (e.g., Baddeley,
1981). Following Bjorklund & Harnishfeger’s (1990) theory, we will also include a
task to measure the efficiency of inhibitory processing.
A second requirement is that the different groups of individuals are in fact
using the same processes to perform the RT tasks (Fisk & Fisher, 1994). Failure to
meet this requirement could result in a non-linear plot even if cognitive processes
actually developed in synchrony. Although determining the component processes
involved in task performance is notoriously fraught with difficulties (Navon &
Gopher, 1979), tasks can at least be screened to check that different subject groups
show the same pattern of RT scores as each other across the task conditions. It is also
desirable that the same set of tasks be administered to all age groups so that the same
speed variable is measured for all subjects (cf Kail’s, 1991b meta-analysis).
RT tasks should also be as simple as possible since complex tasks not only
lead to higher error rates, rendering RT scores difficult to interpret (Salthouse, 1996;
that the resulting RT is highly unlikely to represent “speed” in any fundamental sense.
Although this point is well-recognised in the individual differences literature (e.g.
Nettelbeck, 1987; Anderson,1992; Jensen, 1982) it tends to be overlooked in
developmental studies.
It is also necessary, if the single global speed hypothesis is to be tested
seriously, that the participants’ ages cover a range where they might plausibly differ in
qualitative ways from young adults. This creates the problem that the most
theoretically interesting participants, namely, those who are the least developed
cognitively, are also the most difficult to extract meaningful RT data from. With the
exception of Kail (1991b), who included children as young as four years of age, all
Brinley studies to date have focused on relatively old children, no younger than eight
(Kail, 1986) and ten (Hale, 1990), respectively, with little in the way of qualitative
change left to distinguish them from adults (Piaget, 1953). The inclusion of younger
children would provide a more rigorous test of the unidimensional model, although
RT tasks will need to be modified to make them suitable for preschool children, and it
will be particularly important to establish the reliability of RT scores, as unreliable
data could result in spuriously non-monotonic plots (Myerson, Wagstaff, & Hale,
1994).
A further recurrent problem in the Brinley studies to date is the lack of
adequate consideration of the intellectual ability of the participant groups. In
particular, all studies to date use school children as their child groups and university
undergraduates as their young adult group for comparison. Thus, the young adult
group is not merely older, but also probably of higher IQ than the younger groups
(although Hale, 1990, reports no significant difference between scaled scores of her
multidimensional model of intelligence highlights the importance of controlling IQ
when age groups are compared and controlling age when IQ groups are compared so
that the effects of each can be isolated.
Methods of Calculating Lines of Best Fit
Previous studies have used two different methods for calculating lines of best
fit for Brinley plots. While Hale (1990) used a linear model estimating both slope and
intercept parameters, Kail (1991b) used a multiplicative model calculating lines
through the origin, so only slope was free to vary. As we have seen, the multiplicative
model is only appropriate if central and peripheral processing speed increase with age
at the same rate, but if this is not the case then the linear model is the more
appropriate. In light of Anderson, Nettelbeck and Barlow’s (1997) finding that on
Jensen’s RT task, which allows RT to be plotted as a function of information load,
children of different ages differed in intercept rather than slope, we might expect a
linear function to fit the data better.
Furthermore, using R2 values from the multiplicative model (which indexes
variance about the origin explained) may overestimate the least squares fit of the line
to the data points because RT scores necessarily fall in the first quadrant. Thus, Kail’s
(1991b) very high R2 values (ranging from .908 to .997) may be an artifact of the
method used to calculate lines of best fit. As his is the only study to date to include
preschool-aged children, this further highlights the need for comparing the
multiplicative model with a linear model.
With these methodological considerations in mind, we can proceed to the
predictions made by the unidimensional and multidimensional speed models with
regard to Brinley plots of different ability groups. The unidimensional model,
according to which speed underlies MA and IQ differences, predicts that Brinley plots
by age or IQ group should all conform well to the linear model and should all show
the same systematic pattern, with slope relative to the highest ability group decreasing
towards 1 as age or IQ increases. No systematic differences in intercept are predicted
for age or IQ groups.
Anderson’s (1992) version of the multidimensional model, on the other hand,
states that speed is responsible for IQ but not MA differences, whereas attentional
factors may be important contributors to MA. This model predicts that Brinley plots
will show systematic differences in slope but not intercept between IQ groups. Age
groups, however, should not differ systematically in slope, but intercept should
decrease towards zero as age increases, indicating that attentional factors develop with
age.
Correlation and Causality -- Partial Correlations
In addition to the Brinley plot analysis, this study will examine partial
correlations between age, speed and reasoning ability. We have seen that performance
on speeded tasks and reasoning tasks improves with age during childhood, but this
does not implicate speed as a causal mechanism underlying cognitive development
(although a consistent absence of correlation between reasoning ability and speed may
be reason enough to reject the speed hypothesis). Salthouse (1985) formulated a
method for testing whether speed was responsible for age-related changes in reasoning
ability observed with age then firstly, partialling speed out of the age/reasoning
correlation should reduce it to zero and, secondly, partialling age out of the
speed/reasoning correlation should leave it intact.
This partial correlation logic has also been applied to children by Nettelbeck &
Wilson (1994), in this case using IT as a speed measure and receptive vocabulary as a
measure of MA. Although, they found no support for either hypothesis, their choice
of measures may not offer solid grounds for rejecting the speed theory. In particular,
the authors point out that vocabulary is a measure of crystallised rather than fluid
intelligence (Cattell, 1963) so we might expect the relationship between speed and
vocabulary score to be mediated by age-related experiential factors. Thus, a measure
such as Raven’s Matrices would be a more direct measure of fluid ‘g’ (Raven, 1989).
The present study will re-examine the relationships between age, intellectual
ability and speed, evaluating the alternative theories that increasing speed causes
intellectual development, and that speed remains stable with age but accounts for IQ
differences. Both theories predict positive correlations between age, speed and
reasoning ability. However, if increasing speed causes reasoning ability to develop
with age then partialling age out of the speed/reasoning ability correlation will leave it
intact, while partialling speed out of the age/reasoning ability correlation will reduce it
to zero. (It is worth noting that this is the case even if the relationship between speed
and reasoning ability is itself mediated by speed’s effect on short-term memory as in
the “cascade” model adopted by Kail, 1992, and Fry & Hale, 1996 from Salthouse,
1985). If, on the other hand, speed is not the cause of the development of reasoning
ability, but underlies individual differences within age groups, then partialling age out
of the speed/reasoning ability correlation should leave it intact, and partialling speed
Isolating Cognitive Processing Time
In addition to separating central from peripheral processing speed for groups
of participants, the present study will attempt to refine RT as a measure of individuals’
central processing speed by using a subtractive method (cf Clark & Chase, 1972;
Jensen & Reed, 1990; Posner & Mitchell, 1967). By subtracting RT on the task
condition which contains the least amount of information to be processed from the
conditions which require more information to be processed, difference scores can be
obtained for each individual which are arguably better estimates of cognitive speed
because they eliminate most of the individual variation in peripheral factors. Under
the Hick (1952) paradigm, we have seen that these would correspond to an
individual’s intercept. Jensen and Reed (1990) demonstrated that, in adults,
individual variation in intercept (simple RT) was not merely unrelated to individual
differences in intelligence but, left uncontrolled, this source of variation partly
obscured the relationship between RT and intelligence. Although in the present study
we do not measure simple RT directly, we use an analogous task condition in which
children are presented with two identical pictures and indicate that they are identical
by pressing a single button. We argue that cognitive processing in this condition is
minimal compared to other task conditions while perceptual and motor response
requirements of the condition are similar to the other conditions, as are general
sustained attention factors. We will compare the results from this new speed measure
Method
Participants: One hundred and seven children ranging from four through to nine years
took part in the study. In the initial sample there were 19 4-year-olds, 18 5-year-olds,
16 6-year-olds, 15 7-year-olds, 22 8-year-olds and 17 9-year-olds. Due to
unacceptably high error rates on the RT tasks, six children from the 4-year-old group
and one from the 5-year-old group were excluded from further analyses.
The 4- and 5-year-olds came from the preschool affiliated with the University
of Western Australia, and the older children came from a primary school in a
predominantly middle-class area in the suburbs of Perth, Western Australia.
Materials and Apparatus: All RT tasks were carried out on an IBM-compatible
computer with a six-button response box attached. The button box was a flat box 20 x
15 cm with four buttons in a row along one edge, each marked with a line drawing of
an animal (used in the selective attention task described below). The other two
buttons were located on the opposite edge of the box and were marked with a red and
a blue sticker. Because the younger children had not yet learned to read, all RT tasks
used pictorial stimuli. Additional materials included a picture of the target for the
spatial processing task drawn on a card, and another card showing all the pictures used
in the verbal processing task, arranged in their categories.
Raven's Coloured Progressive Matrices (CPM) and Raven's Standard
Progressive Matrices (SPM) were used to measure fluid intelligence. The CPM shares
two of its three sets of items with the SPM. For comparability with older children,
young children’s SPM performance is used in the following analyses. The CPM is
have been shown to measure the same ability construct (Irene Styles, personal
communication, December 1997).
Procedure: The preschool children were tested individually in a quiet room at their
preschool over two sessions of approximately twenty minutes. In the first session,
they performed the RT tasks and in the second session, they were administered the
CPM. If they were showing no obvious signs of fatigue, the preschool children were
also administered the first six items of sets C, D and E of the SPM. Following the
suggestion in the manual (Raven, 1956), young children’s SPM was calculated as their
score on sets A and B of the CPM (which are the same as sets A and B on the SPM)
plus any of the additional SPM items from the later sets that they answered correctly.
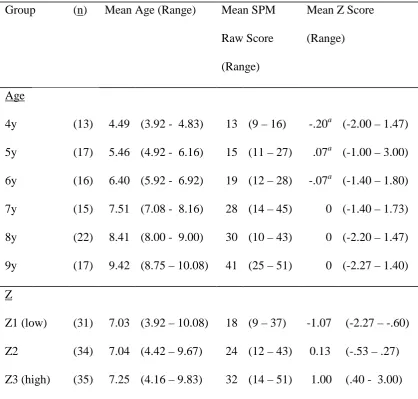
For all children, Z scores were calculated by standardising SPM raw scores within
each school year.1
The school children were tested individually in a quiet room at their school on
the RT tasks, but group tested in their classroom on the SPM. The three RT tasks,
selected to sample the speed of a variety of cognitive systems, were: a spatial
processing task of the mental rotation type, a verbal processing task of the semantic
categories type and a selective attention task to measure inhibitory processing.
Spatial processing task: In this task, each child was shown the target picture of
a horse (“Trevor”). The horse was drawn so that his four legs were equally spaced
and the second leg from the back was black. Children were told that they would see
some pictures of horses on the computer screen, spun around to different angles (this
was demonstrated by holding the card against the screen and rotating it) and that they
had to decide whether the horse on the screen was Trevor or another horse. The other
instead of its second leg from the back. The children pressed the red response button
if the horse was Trevor and the blue button if it was not Trevor. Eight practice trials
were given, corresponding to the eight conditions (‘yes’ and ‘no’ responses at 30, 60,
120 and 150 degrees of rotation) with the option of repeating the practice if necessary.
The children were then presented with 64 test trials, eight in each condition, in a
random sequence. These appeared in blocks of eight trials, with the option of a rest
period after each. Each stimulus appeared for a maximum of four seconds, or until a
response was made. For the practice trials, five seconds were allowed. This time
restriction was imposed because pilot testing indicated that the youngest children
needed no more time than this, provided they did not become distracted from the task
mid-trial. Thus, the limit helped to ensure that RT measured task performance time
only. A correct response was acknowledged by a beep from the computer. It was
expected that RT would increase as a linear function of degree of rotation (Shepard &
Metzler, 1971).
Verbal processing task: In this task, children were first shown the card
depicting the 16 stimulus pictures arranged in their categories. There were four
pictures in each category, selected to be good examples of the category and interesting
for young children to look at. In order to encourage semantic processing rather than
just visual processing, they were as dissimilar physically within categories as possible
(Tipper & Driver, 1988). The categories were: food (carrot, cake, ice-cream and
apple), toys (blocks, ball, teddy bear and rocking horse), clothes (trousers, shirt, shoe
and hat) and furniture (chair, sofa, television and table). We ensured that children
could recognize each object and each category. Two pictures were presented on the
computer screen. If they belonged to the same category, children pressed the red
go/no-go RT task). Each child received eight practice trials of five seconds duration
(maximum), followed by 64 test trials of four seconds (maximum) duration. The
stimuli were arranged so that each individual picture appeared an equal number of
times, half the time paired with a semantically related object, and the other half of the
time paired with an unrelated object. Thus, the child had to respond to half of the
trials. Of the semantically related trials, 25% presented two identical pictures, while
the remaining 75% presented physically different pictures. Stimuli were randomly
ordered, and arranged in blocks of eight trials with a rest option after each block.
Each correct response was acknowledged with a beep from the computer. It was
expected that RTs on the physically identical condition would be shorter than on the
semantically related condition (Posner & Mitchell, 1967).
Selective attention task: The selective attention task was modelled on a task
employed by Tipper (1985) and Tipper and Driver (1988) to examine inhibitory
priming in adults. In each trial, two overlapping line drawings of animals were
presented, one drawn in red and the other in blue. Four of the response buttons were
labelled with corresponding pictures of the four animals (cat, dog, duck and fish). On
each trial, the children were instructed to press the button which corresponded to the
red stimulus animal on the computer screen, and to ignore the blue stimulus animal.
Thirty-two stimulus pairs were constructed. The relative location of the red animal
(left or right) was counterbalanced, and stimuli were sequenced so as to create four
different conditions.
In the first condition (physically identical) the red and the blue animals were
the same as each other and unrelated to the animals in the previous trial, so that no
selective attention was required to respond correctly. In the second condition
condition (unrelated), the red animal was unrelated to either animal in the previous
trial, and in the fourth condition (previously inhibited), the red animal was the same as
the blue animal in the previous trial. There were 85 trials in all, divided into three
blocks of approximately equal length. Eight practice trials were given, which
presented each animal in red twice. It was expected that both the previously selected
and the physically identical conditions would produce shorter RTs than the unrelated
condition, and that the previously inhibited condition would produce longer RTs than
the unrelated condition.
Results
First, RT data were examined to ensure that participants were responding at an
adequate level of accuracy. Each individual’s data was plotted and outlying RTs more
than 2.5 standard deviations from the median were removed. Each subject’s median
score on each task condition was then recalculated. If a subject did not respond
correctly at least 75% of the time on each task condition then his or her scores on that
task were excluded from further analyses. This resulted in seven preschool children
being excluded from the study and fifteen other children having some missing data.
The subject pool was categorized in two ways: by school year (six groups)
and by SPM Z-score calculated separately within each year group (3 equal groups).2
The characteristics of these groups are outlined in Table 1.
Experimental Effects
RT data were then examined task by task to determine whether the
experimental manipulation in each task condition had the predicted effect on
children’s RT scores across all age groups. Additionally, error rates were examined in
case experimental effects on RT were confounded by compensatory changes in
accuracy.
Spatial task
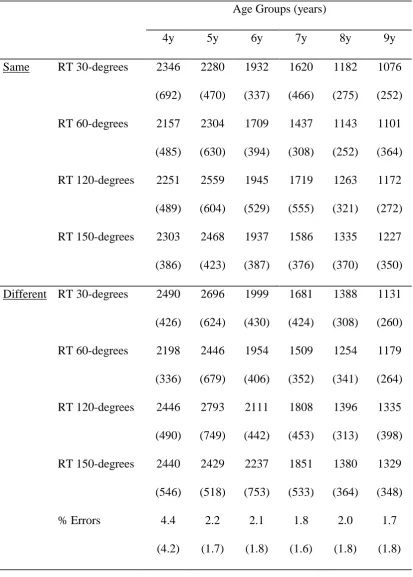
Table 2 shows the mean RT scores obtained by children within each age group
for each condition of the spatial task, as well as percentage of trials incorrect. In
general, RT decreased with age (F (5, 86) = 34.77, p < .001), except that the
4-year-olds out-performed the 5-year-4-year-olds. The differences between age groups were
considerably greater in magnitude than differences between conditions, although main
effects for task condition were significant (F (1, 86) = 53.75, p < .001 for response
condition; F (3, 258) = 20.64, p < .001 for degree of rotation). No significant
interactions were found between year and task conditions, so there is no evidence that
different age groups were affected differently by the experimental manipulations.
Error rate decreased significantly across year groups (F (5, 85) = 2.73, p< .05), and
response condition and degree of rotation both produced main effects on error rate (F
(1, 85) = 2.34, p< .05 and F (3, 255) = 5.92, p< .01, respectively). However, year
group did not interact with either task condition factor, so speed-accuracy trade-offs
are unlikely to have distorted the year groups’ pattern of RT means relative to each
other.
The change in RT with increasing degree of stimulus rotation does not
conform to the monotonic increase argued by Shepard and Metzler (1971) to
characterise mental rotation tasks, the most marked deviation in these data being that
responses at 60-degree rotation are faster than at 30-degree rotation. This may
indicate that the processes used were not exclusively mental rotation, but given the
nature of the task, some amount of spatial processing seems inevitable. Furthermore,
although this was not predicted, it conforms reasonably well to the RT pattern of one
of Kail’s (1986) 8-year-old groups (the youngest group he sampled) on a spatial task,
and thus does not appear to be an effect restricted to the present task. Since the
pattern of results is consistent across age groups, it suggests that the processes
employed do not vary with age in this sample, and thus the RT means can justifiably
be included in the Brinley plots to follow.
Verbal task
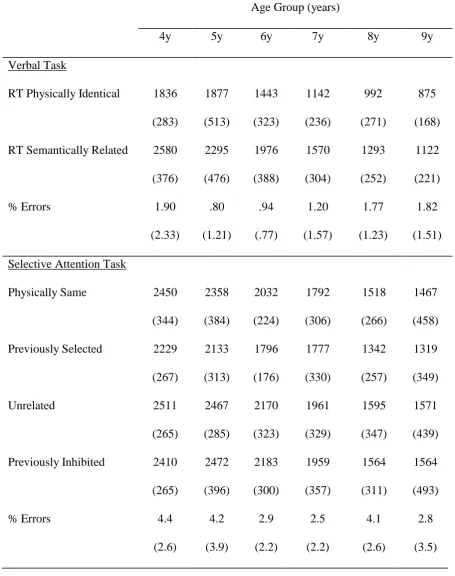
The mean RT and error rate of each year group on the verbal task are shown in
the top section of Table 3. As predicted, the physically identical stimuli clearly
produced faster responses than the semantically related stimuli (F (1, 89) = 363.14, p
< .001). Older year groups were faster than younger groups (F(5, 89) = 39.00, p<
.001). The interaction between task condition and year group was also significant,
indicating that the difference in RT between the two conditions decreased with age (F
(5, 89) = 8.45, p < .001). It can be seen that the number of errors is slightly elevated
in the 4-year-old group relative to the others, but there is no significant effect of year
on error rate (F(5, 89) = 1.8, n.s.).
Selective attention task
The mean RT of the each year group on each condition of the selective
attention task and percentage errors are shown in the lower section of Table 3. The
older children were significantly faster to respond than the younger children (F(5, 89)
= 28.00, p< .001). Task condition significantly affected RT (F (3, 267) = 49.22, p<
.001). As predicted, performance on the physically identical and previously selected
conditions of the task was considerably faster than on the unrelated condition (t (94) =
4.91, 10.93, respectively, ps < .001). However, counter to predictions, the previously
inhibited condition was no slower than the unrelated condition (t (94) = .79, n.s.).
This may indicate that children in this age range do not yet actively inhibit irrelevant
information. An alternative possibility is that inhibitory effect is short-lived and the
present methodology failed to elicit it by allowing relatively long intertrial intervals.
There was no significant interaction between year and task condition (F(15, 267) =
1.13, n.s.), suggesting that task manipulations affect children of all ages to a similar
extent. Although there was a main effect for condition in error rates (F (3, 267) =
14.19, p < .001) there was no effect for year group (F (5, 89) = 1.02, n.s.) and neither
did condition interact with year group (F (15, 267) = 1.03, n.s.).
In summary, the experimental effects predicted for each of the tasks were
mostly borne out, and the Brinley requirements that tasks sample a variety of
processes and that different age groups employ the same set of processes appear to
have been met adequately.
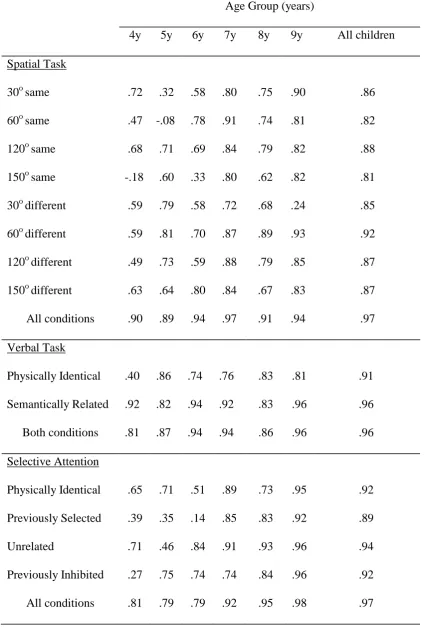
Reliability
Because reliability is important if Brinley plots are to be interpretable and
because young children may not produce reliable RT data, split-half reliability was
Guttman’s coefficient for each group under each task condition. For most age groups
and most conditions reliability is reasonably high. However, some cells, particularly
from the younger children show low Guttman coefficients. This problem may be
attenuated by removing the unreliable estimates and comparing the plots of the
remaining estimates to those with all data included, but results from the preschoolers
will need to be interpreted with some caution.
--- Insert Table 4 about here ---
Brinley plots
The mean RT of younger children on each condition of each task was plotted
against that of the 9-year-olds. This part was a simple replication of numerous papers
published to date (e.g., Hale, 1990; Kail, 1986, 1991b; Kail & Park, 1992). As a
further extension of this, groups defined by SPM Z score were also plotted against
each other.
Figure 1 (cells A and B) show the Brinley plots by age. In cell A, the intercept
of the line of best fit has been allowed to vary, following Hale’s (1990) linear model
whereas in cell B, the intercept has been fixed at the origin, following Kail’s (1991b)
multiplicative model. The parameter estimates of these lines with their 95%
confidence intervals and adjusted R2 values are shown in Table 5.
--- Insert Figure 1 about here --- ---
From these results, several things are apparent. Firstly, the 2-parameter regression
lines vary considerably in the amount of variance they explain. The line for the
5-year-old group does not explain even a significant proportion of the variance, and only in the
7- and 8-year-old groups does the R2 value reach a particularly high level. Allowing for
standard error, the plots are reasonably monotonic. The major exceptions to this are: for
the 4-year-olds the semantically related condition of the verbal task is disproportionately
difficult compared to the spatial task, and the Previously Selected condition of the
selective attention task is disproportionately easy relative to some conditions on each of
the other two tasks. For 5-year-olds, the Physically Same and Previously Selected
conditions on the attention task are disproportionately easy relative to the spatial task.
For the 7- and 8-year-olds, the only violation of the monotonic pattern is that they are
disproportionately slow on the 30-degree rotation condition relative to the 60-degree
rotation.
When intercept as well as slope is allowed to vary, intercept decreases as age
increases, and most age groups’ intercept estimates fall outside each other’s confidence
intervals, whereas slope shows no clear systematic relationship with age and there is a
large amount of overlap between confidence intervals.
The slope estimates all contain 1 in their confidence intervals, implying no
significant difference in speed between age groups, and intercept is greater than zero,
implying that older children have a faster baseline response time. Finally, for the
1-parameter regression equations, where the intercept is fixed at the origin, Kail’s method
replicates his findings: R2 values are universally extremely high and there is a strong
trend for slope to decrease with age with little overlap in confidence intervals (the only
exception being the reversal of the slope parameters of 4- and 5-year-olds).
than with 2-parameter slope (r (5) = -.76, n.s.) -- and, indeed, the latter correlation is
negative.
Comparing the equations using all of the available conditions with those which
only use means from conditions with a minimum reliability of .5 (Table 5), it can be seen
that increasing reliability increases linearity for the 5-year-old and 6-year-old groups, but
also strengthens the pattern of decreasing intercept and increasing slope with age in the
2-parameter solutions. (Four-year-olds’ data show no significant linearity, probably due to
the small number of points left.) Using the restricted data has virtually no effect on the
1-parameter solutions. Nevertheless, the R2 of all three of the youngest groups remains
well below 1.00 and well below that of the older two groups even when the reliability of
their means is made comparable, suggesting a genuine increase in linearity with age
which is not attributable to reliability alone.
Cells C and D of Figure 1 show the Brinley plots of mean RT on each task
condition for successive Z groups, and Table 6 contains the parameter estimates and
amount of variance explained by each regression equation. All regression lines explain a
reasonably large amount of variance, but neither intercept nor slope shows a systematic
pattern across Z groups. From cell D of Figure 1 it is evident that the 1-parameter
regression lines for Z1 and Z2 are virtually indistinguishable, although neither group’s
confidence interval includes 1.00 suggesting that both are slower than Z3.
--- Insert Table 6 about here ---
In summary, the key findings from these analyses are, firstly, that when a simple
multiplicative model is applied to RT (following the method of Kail, 1991b) slope
define the groups, only the highest group has a significantly different slope. Secondly,
using a 2-parameter linear model dramatically changes the results: R2 is generally much
lower, intercept takes on the strong, systematic relationship with age and slope is largely
unrelated to age. Z groups show no systematic association with either parameter. Finally,
the slope estimate for each plot is vastly different depending on whether on not the
intercept is also allowed to vary.
Refining RT as a Speed Measure
Given that RT is not an especially pure measure of speed of information
processing since it contains a substantial peripheral component which is a source of
individual differences but does not vary systematically with intellectual ability, at least
among adults (Jensen, 1982), we have attempted to filter out the time consumed by
these peripheral factors at an individual level using a subtractive method (Jensen &
Reed, 1990). We consider this to be worth doing because although intercept
differences in Brinley plots are informative about systematic differences between
nominated groups (e.g. age groups) in the time consumed by these factors,
unsystematic differences within groups may mask genuine between-group differences
in speed.
Of all the task conditions, the physically identical condition in the verbal
processing task was deemed to have the smallest cognitive processing requirements as
it consisted of recognising that two stimuli were identical without need for any
information to be manipulated, and pressing a single button in response (no choice
was involved), making it similar to Jensen’s (1982) simple RT. Empirically, too, this
was the easiest condition, as it consistently produced the fastest response times across
all groups of children. This condition thus provided an estimate of the
“cognitive processing time” (CPT) was estimated for each child on each of the other
task conditions by subtracting median RT on the physically identical condition (a
constant for each individual) from median RT on the other conditions.
Although this is still not an ideal speed measure, difference scores being
necessarily less reliable than the measured scores from which they are derived (Ferguson,
1986 – and mean CPT reliability estimate for each age group appears in the bottom row
of Table 4), the proportion of speed variance to non-speed variance in CPT is arguably
higher than in RT. Under Kail’s (1991b) single global speed model, this procedure ought
not to affect the Brinley plot because the same set of processes are subtracted from all
groups’ RT scores, so, provided that all processes do indeed conform to the same
developmental path, CPT ought to behave in exactly the same way as RT. Where full
data sets were available to calculate mean RT and CPT across all tasks, the two variables
were found to be weakly but significantly correlated (r (86)= .23, p< .05).
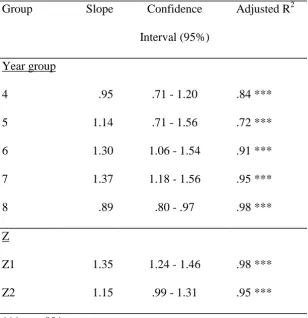
The Brinley plot analysis was repeated for CPT data. This time, only 1-parameter
models were used because factors contributing to any intercept differences were equalised
among individuals by the subtraction procedure. Figure 2 shows the Brinley plots and
lines of best fit for age and Z groups. Table 7 shows the parameters of these lines and the
amount of variance explained by each.
--- Insert Figure 2 about here --- ---
Insert Table 7 about here ---
These data reveal a rather more chaotic pattern across age groups than the RT
data did. The R2 values are generally lower since the data points are now nearer to the
The Z plots, however, are generally more linear than those of the age groups, and
slope decreases across groups with virtually no overlap in confidence intervals. Thus
CPT slope is systematically related to Z score (or IQ) but not to age.
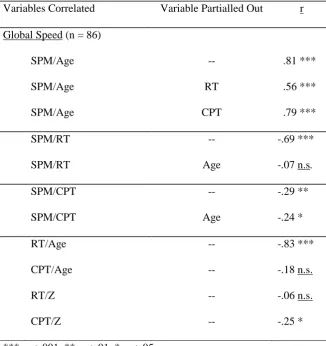
Partial Correlation Analyses
For each child, mean RT and mean CPT were calculated for each of the three
tasks. Overall mean RT and CPT was then calculated by taking the means of the task
means (to avoid biasing scores towards the task with the greatest number of
conditions). Table 8 shows the correlations and partial correlations among the three
variables Age, Reasoning Ability and Speed, where “speed” is measured as overall
mean RT and mean CPT.3 As predicted, SPM performance correlated highly with
age, as did RT. The correlation between SPM and RT was also quite strong.
However, contrary to the predictions of the unidimensional model, partialling RT out
of the SPM/Age correlation had minimal effect (see cell A). The correlation is
reduced but remains highly significant, indicating that there is a very substantial
relationship between age and reasoning ability that is independent of speed, as
indexed by RT. On the other hand, partialling Age out of the SPM/RT correlations
reduces it to zero (see cell B). Thus, RT and SPM are only related to each other
through their mutual correlation with Age, consistent with the findings of Nettelbeck
& Wilson (1994) with inspection time, and Fry & Hale (1996) with RT. Furthermore,
there is no significant correlation between RT and SPM Z score.
--- Insert Table 8 about here ---
When CPT is used as a speed measure, the partial correlations behave quite
differently from those using RT. CPT does not correlate significantly with Age (cell
score and Z score) and CPT. Where partialling RT out of the SPM/Age correlation
reduced it slightly, partialling out CPT leaves it largely unaffected (cell A). There is a
much weaker correlation between SPM and CPT than between SPM and RT but when
Age is partialled out, this remains intact (cell C), indicating that age is not a mediating
factor between CPT and SPM.
Thus, the partial correlation results are highly consistent with those of the
Brinley plot analyses. Absolute RT is associated with age rather than fluid
intelligence while CPT is associated with fluid intelligence rather than age.
Discussion
It is apparent that different methods of determining line of best fit (1- or
2-parameter models) and of measuring speed (RT and CPT) suggest vastly different
theoretical interpretations. Following Kail’s (1991b) methodology of fitting a
1-parameter model to RT data, the present results replicate his findings, corroborating
his conclusion that speed of processing, as measured by the slope parameter, increases
with age. However, the 1-parameter lines offer no reason to believe that Z groups
containing children from a range of ages differ at all in their speed of processing.
While, on the face of it, this would seem to negate the unidimensional model (speed
may underlie development but not IQ differences), it might be argued that during the
developmental period IQ has no fundamental existence anyway, being merely derived
from MA, so any difference in speed between IQ groups will be of trivial magnitude
compared to the differences between age groups. Thus, the 1-parameter findings seem
most consistent with the unidimensional model.
The 2-parameter lines of best fit for the RT data, however, tell a strikingly
different tale. When intercept is allowed to vary from the origin, it is intercept rather
the difference between peripheral and central slowing factors for an age group. Since
central processing speed (as indicated by slope) is invariant across age groups, the
pattern of intercepts must be due to change in peripheral processing factors common
to all tasks. Since there is no convincing evidence from the RT data that slope or
intercept are related systematically to within-age differences in fluid intelligence, this
set of Brinley plots not only refutes the unidimensional model (age and Z scores
producing characteristically different plots) but also implies that speed of processing
has no great explanatory power with regard to developmental change or individual
differences in intellectual ability.
Finally, when CPT rather than RT is plotted, the theoretical interpretation is
different again. This time speed appears to increase across Z groups (despite Z groups
containing a wide range of ages) but to be unrelated to developmental status, which is
most consistent with Anderson’s (1992) version of the multidimensional model.
The partial correlation analyses show much the same pattern. Using RT as a
speed measure, the relationship between speed and reasoning ability appears to be
entirely mediated by age, so it can account for neither MA differences nor IQ
differences. All that can be concluded is that both SPM and RT task performance
improve independently with age, conforming to what Lindenberger & Pötter (1998)
refer to as the ‘spuriousness model’ where there is no direct relationship between
speed and reasoning ability (and also consistent with the findings of Fry & Hale,
1996).
The results from the CPT correlations, however, suggest a different
interpretation. Like RT, CPT plays no mediating role in the relationship between age
and reasoning ability, again suggesting that increasing speed cannot be the cause of
mediated by age. The fact that CPT fails to correlate with age at all is most consistent
with the interpretation that speed underlies stable within-age differences in reasoning
ability and does not develop with age, that is, Anderson’s (1992) theory.
Thus, different Brinley methods and different measures of speed yield quite
different theoretical interpretations. These conflicting results leave us with two
questions: firstly, how the discrepancies between the findings of different methods
might be explained and, secondly, which theoretical interpretation offers the best
account of the findings.
One- versus Two-Parameter Lines of Best Fit
We have seen from Jensen (1982) that when we plot RT over information
load, both slope and intercept are sources of individual variation, and that slope rather
than intercept is related to intellectual ability in adults. Furthermore, the present
results suggest that 1-parameter slope differences between age groups confound true
slope with intercept differences, and indeed, correlate extremely highly with intercept.
From this, Kail’s (1991b) use of 1-parameter lines of best fit is inappropriate, and the
argument that performing no operations takes no time so intercept should be zero is
flawed. Although the R2 values for the 1-parameter lines were uniformly high (and
higher than those for 2-parameter lines) this is entirely due to the fact that the values
represent different variance. Thus, from the RT plots, what differs between age
groups is not speed of information processing but task performance factors that are
constant across all quantities and types of information to be processed, such as
motoric speed and attention.
The issue of whether RT or CPT is the better measure of speed of processing
is not entirely straightforward. In principle, CPT ought to be the purer measure as it
removes, at an individual level, variance in RT due to performance factors unrelated
to task difficulty (such as the attentional and motoric factors mentioned above). In
practice, difference scores are less reliable than direct measures (Ferguson, 1986) so
the error variance in CPT (which is very great for two age groups in this experiment)
may conceal systematic patterns in speed between participant groups. However,
CPT’s lack of reliability is unbiased in its effects – the risk is that genuine differences
will not emerge, not that spurious differences will emerge.4
The validity of CPT as a speed measure could also be questioned. For
example, it might be argued that between-task differences in perceptual and motor
factors mean that CPT actually contains a substantial amount of peripheral variance.
Furthermore, if the condition taken as baseline includes a substantial amount of
central processing time then when we subtract it from other conditions, CPT may
actually contain less speed variance than RT did. Although CPT cannot be regarded
as an ideal speed measure, we argue that the perceptual requirements (perceiving two
line drawings) and the motor requirements (using one finger to press a button) are
reasonably well matched between tasks. There is an important difference between
tasks in the response selection component of motor response (choosing from one
button versus two or four) but this is also the case in Jensen’s RT task (Jensen, 1982),
the slope of which is considered to measure speed and correlates with IQ among
adults – so from this point of view, response selection (as distinct from response
execution) is considered a central process. Interestingly, age differences in “response
selection” speed only emerge when children are required to use different fingers to
finger (Anderson, Nettelbeck & Barlow, 1997). In any event, the major finding from
the present study is that RT is itself multidimensional and one of those dimensions
aligns itself with development and the other with within-age differences in fluid
intelligence. Given that RT behaves as Brinley intercept and CPT behaves as Brinley
slope, we interpret the former primarily as a measure of peripheral processes and the
latter as a measure of central processes, but this study alone may be inadequate to
establish the veracity of this interpretation.
The present Brinley plot results do not support the notion that speed of
information processing changes with age. This clearly conflicts with the claims of
Kail (1986, 1991b), and more importantly Hale (1990) and Fry and Hale (1996) who
used 2-parameter lines of best fit.
One potentially important difference between the present study and previous
ones is that previous studies have used university undergraduates as their adult group
while the present study uses 9-year-olds as the oldest group. The reason for using
school children exclusively in the present study was to avoid confounding age with IQ
(Anderson, 1992). If the single global speed theory is correct, then the particular age
groups selected for the Brinley plots make no difference, and since the present study
focuses on a period of life where cognitive development should be proceeding at a
particularly rapid rate, the present age range should still be quite adequate to find
changes in speed.
Of more concern is the possibility that the present Brinley plots by age group
may simply be a reflection that the RT data from younger children are not as reliable
as those for older children and adults. That is, age-related increases in reliability
zero. Nevertheless, for each task condition, Guttman coefficients are predominantly
high for RT of the school-aged children, though somewhat lower for the preschool
children. It may be that the present study cannot confidently draw many conclusions
about the speed of processing of the preschool groups, but it seems unlikely
nonetheless that the pattern of results for the older groups can be accounted for solely
by changes in reliability.
Given the lack of overlap between the age groups sampled here and those of
Hale (1990) it is not possible to make any direct comparisons between findings. The
pattern found for the present younger sample may not hold for older children and
adolescents. Interestingly, Cerella & Hale (1994) reanalyse data from Kail (1991b)
using a 2-parameter model and find systematic decline in intercept across the present
range of ages (and some low R2 values among younger children) – although
2-parameter slope is still found to decrease with age.
Conditions that violated the monotonicity of the Brinley plots were all reliable.
For older children, these seemed to reflect a change in strategy within the spatial task.
For the preschool children, however, the violations appeared between tasks indicating
firstly a developmental decrease in the relative difficulty of semantic categorisation
relative to spatial manipulation and secondly a developmental decline in the benefits
of reducing a task’s distracting features and removing the need to change motor
responses from trial to trial. This is consistent with the notion that different processes
may develop at different rates (consistent with Anderson’s, 1992, module maturation
account), and that substantial development in inhibitory ability (both cognitive and
motoric) occurs between about five and six years of age (consistent with Bjorkund &
explain the improvements we observe in both RT task performance and reasoning
tasks.
There are several possible ways in which inhibitory ability might influence
SPM performance. One is that the matrices themselves sometimes contain multiple
patterns so that each much be attended to in turn while the others are filtered out.
Another is that the multiple choice format of the test requires children to inhibit the
influence of particularly compelling or eye-catching distractors and use logic rather
than impulse to reach the correct answer. A third way in which inhibition may be
influential is that, when problem type changes, children need to change strategies,
which means inhibiting the old strategy they were using to replace it with a new one.
So, it at least makes sense that inhibitory ability may constitute a significant part of
ability to solve SPM items, and one which develops with age.
Conclusions
In summary, the present results stand in opposition to the unidimensional
speed theory of fluid intelligence. They suggest that the RT measure is, itself,
multidimensional, with different components aligning with within-age differences in
fluid intelligence and with development. From this point of view, it appears that IQ is
a fundamental measure even during childhood, and that MA is a conglomerate of
developmental status and IQ (Anderson, 1992). We have argued that central
processing speed is related to within-age differences in fluid intelligence, while
inhibitory ability relates to the development of fluid intelligence. As the meaning of
the term ‘speed’ varies considerably between studies, we will clarify our intended
meaning. The real meaning of speed is given by the context in which it is used (viz.
that speed relates to the general efficiency of the biological underpinnings of
cognition, and we take it that this paper goes some way towards establishing that these
biological parameters are not subject to change, in contrast to the attentional and
peripheral processes examined in this paper. Future research in which the processing
speed requirements and selective attentional requirements of tasks are manipulated
Acknowledgements:
This study was conducted as part of the first author’s PhD thesis at the
University of Western Australia. We would like to thank the children, teachers and
parents at the participating preschool and primary school for their cooperation. We
are also grateful to the reviewer of a previous draft of this paper for the suggested
References
Anderson, M. (1989). Inspection time and the relationship between stimulus encoding
and response selection factors in development. In D. Vickers & P. L. Smith
(Eds.), Human information processing measures, mechanisms and models
(pp.509-516). Amsterdam: Elsevier Science.
Anderson, M. (1992). Intelligence and development: A cognitive theory. Oxford:
Blackwell.
Anderson, M., Nettelbeck, T., & Barlow, J. (1997). Reaction time measures of speed
of processing: Speed of response selection increases with age but speed of
stimulus categorisation does not. British Journal of Developmental Psychology,
15, 145-157.
Baddeley, A. (1981). The concept of working memory: A view of its current state
and probable future development. Cognition, 10, 17-23.
Bjorklund, D. F., & Harnishfeger, K. K. (1990). The resources construct in cognitive
development: Diverse sources of evidence and a theory of inefficient inhibition.
Developmental Review, 10, 48-71.
Brinley, J. F. (1965). Cognitive sets, speed and accuracy of performance in the
elderly. In A. T. Welford & J. E. Birren (Eds.), Behavior, aging, and the nervous
system: Biological determinants of speed of behavior and its changes with age
(pp.114-149). Springfield: Charles C. Thomas.
Cerella, J. (1990). Aging and information-processing rate. In J. E. Birren & K. W.
Schaie (Eds.), Handbook of the psychology of aging (3rd ed., pp.201-221). San
Cerella, J. (1994). Generalized slowing in Brinley plots. Journal of Gerontology:
Psychological Sciences, 49, P65-P71.
Cerella, J., & Hale, S. (1994). The rise and fall of information-processing rates over
the life span. Acta Psychologica, 86, 109-197.
Clark, H. H., & Chase, W. G. (1972). On the process of comparing sentences against
pictures. Cognitive Psychology, 3, 472-517.
Dunn, J. C., & Kirsner, K. (1988). Discovering functionally independent mental
processes: The principle of reversed association. Psychological Review, 95,
91-101.
Fairweather, H., & Hutt, S. J. (1978). On the rate of gain of information in children.
Journal of Experimental Child Psychology, 26, 216-229.
Ferguson, G. A. (1986). Statistical analysis in psychology and education (5th ed.).
Singapore: McGraw-Hill.
Fisk, A. D., & Fisher, D. L. (1994). Brinley plots and theories of aging: The explicit,
muddled and implicit debates. Journal of Gerontology: Psychological Sciences,
49, P81-P89.
Fry, A. F., & Hale, S. (1996). Processing speed, working memory, and fluid
intelligence: Evidence for a developmental cascade. Psychological Science, 7,
237-241.
Hale, S. (1990). A global developmental trend in cognitive processing speed. Child
Development, 61, 653-663.
Hick, W. E. (1952). On the rate of gain of information. Quarterly Journal of
Hindley, C. B., & Owen, C. E. (1978). The extent of individual changes in IQ for
ages between 6 months and 17 years, in a British longitudinal sample. Journal of
Child Psychology and Psychiatry, 19, 329-350.
Hunt, E. (1980). Intelligence as an information processing concept. British Journal
of Psychology, 71, 449-474.
Jensen, A. R. (1982). Reaction time and psychometric g. In H. J. Eysenck (Ed.), A
model for intelligence (pp.93-133). New York: Springer.
Jensen, A. R. (1985). Techniques for chronometric study of mental abilities. In C. R.
Reynolds & V. L. Wilson (Eds.), Methodology and statistical advances in the
study of individual differences (pp.95-99). New York: Plenum.
Jensen, A. R., & Reed, T. E. (1990). Simple reaction time as a suppressor variable in
the chronometric study of intelligence. Intelligence, 14, 375-388.
Kail, R. (1986). Sources of age differences in speed of processing. Child
Development, 57, 969-987.
Kail, R. (1991a). Processing time declines exponentially during childhood and
adolescence. Developmental Psychology, 27, 259-266.
Kail, R. (1991b). Developmental change in speed of processing during childhood and
adolescence. Psychological Bulletin, 109, 490-501.
Kail, R. (1992). Processing speed, speech rate, and memory. Developmental
Psychology, 28, 899-904.
Kail, R., & Park, Y-S. (1992). Global developmental change in processing time.
Merrill-Palmer Quarterly, 4, 525-541.
Kail, R., & Park, Y-S. (1994). Processing time, articulation time, and memory span.
Kail, R. & Salthouse, T. A. (1994). Processing speed as a mental capacity. Acta
Psychologica, 86, 199-225.
Lindenberger, U., & Pötter, U. (1998). The complex nature of unique and shared
effects in hierarchical linear regression: Implications for developmental
psychology. Psychological Methods, 3, 218-230.
Longstreth, L. E. (1984). Jensen’s reaction-time investigations of intelligence: A
critique. Intelligence, 8, 139-160.
Mazur, J. E., & Hastie, R. (1978). Learning as accumulation: A reexamination of the
learning curve. Psychological Bulletin, 85, 1256-1274.
Morrison, G. R., Morrison, S. R., & Keating, D. P. (1992). On estimating processing
variance: Commentary and reanalysis of Kail’s “Developmental functions for
speeds of cognitive processes”. Journal of Experimental Child Psychology, 54,
288-307.
Myerson, J., Wagstaff, D., & Hale, S. (1994). Brinley plots, explained variance, and
the analysis of age differences in response latencies. Journal of Gerontology:
Psychological Sciences, 49, P72-P80.
Navon, D., & Gopher, D. (1979). On the economy of the human-processing system.
Psychological Review, 86, 214-255.
Nettelbeck, T. (1987). Inspection time and intelligence. In P. A. Vernon (Ed.), Speed
of information processing and intelligence (pp.295-346). Norwood, NJ: Ablex.
Nettelbeck, T., & Vita, P. (1992). Inspection time in two childhood age cohorts: A
constant or a developmental function? British Journal of Developmental
Nettelbeck, T., & Wilson, C. (1985). A cross-sequential analysis of developmental
differences in speed of visual information processing. Journal of Experimental
Child Psychology, 40, 1-22.
Perfect, T. J. (1994). What can Brinley plots tell us about cognitive aging? Journal of
Gerontology: Psychological Sciences, 49, P60-P64.
Piaget, J. (1953). The origin of intelligence in the child. London: Routledge &
Kegan Paul.
Posner, M. I., & Mitchell, R. F. (1967). Chronometric analysis of classification.
Psychological Review, 74, 392-409.
Raven, J. C. (1956). Guide to using the Coloured Progressive Matrices. London:
Lewis.
Salthouse, T. A. (1996). The processing-speed theory of adult age differences in
cognition. Psychological Review, 103, 403-428.
Shepard, R., & Metzler, J. (1971). Mental rotation of three-dimensional objects.
Science, 171, 701-703.
Smith, G. A., Poon, L. W., Hale, S., & Myerson, J. (1988). A regular relationship
between old and young adults’ latencies on their best, average and worst trials.
Australian Journal of Psychology, 40, 195-210.
Spitz, H. H. (1982). Intellectual extremes, mental age, and the nature of human
intelligence. Merrill-Palmer Quarterly, 28, 167-192.
Sternberg, R. J. (1983). Components of human intelligence. Cognition, 15, 1-48.
Tipper, S. P. (1985). The negative priming effect: Inhibitory priming by ignored
Tipper, S. P., & Driver, J. (1988). Negative priming between pictures and words in a
selective attention task: Evidence for semantic processing of ignored stimuli.
Memory and Cognition, 16, 64-70.
Weiss, B., Weisz, J. R., & Bromfield, R. (1986). Performance of retarded and
nonretarded persons on information-processing tasks: Further tests of the similar