DEPARTMENT OF INFORMATION ENGINEERING AND COMPUTER SCIENCE
ICT International Doctoral School
A
NALYSIS OF USERS
’
PSYCHO
-
PHYSIOLOGICAL PARAMETERS IN
RESPONSE TO AFFECTIVE MULTIMEDIA
A
MUTLIMODAL AND IMPLICIT APPROACH FORUSER
-
CENTRIC MULTIMEDIA TAGGINGMojtaba Khomami Abadi
Advisor
Prof. Nicu Sebe
Universit`a degli Studi di Trento
Abstract
The affective state of a user, during an interaction with a computer, is a
great source of information for the computer in order to (i) employ the
infor-mation for adapting an interaction, make the interaction flawless, leading in
adaptive affective interfaces. The computer may also use emotional responses
of a user to some affective multimedia content (ii) to tag the multimedia content
with affective labels. The second is very useful to create affective profiles of
users within real world applications for user-centric multimedia retrieval.
Af-fective responses of users could be collected either explicitly (i.e.users directly
assess their own emotions through computer interfaces) or implicitly (i.e.via
sensors that collect psycho-physiological signals such as facial expressions,
vo-cal clues, neuro-physiologivo-cal signals, gestures and body postures). The major
contributions of this thesis are as follows: (i) We present (and made publicly
available) the very first multimodal dataset that includes the MEG brain
sig-nals, facial videos and some peripheral physisological signals of 30 users in
response to two sets of affective dynamic stimuli. The dataset is recorded via
cutting-edge lab equipments in highly controlled lab environments, facilitating
proper analysis of MEG brain responses for affective neuro-science research.
(ii) We then present two other multimodal datasets that we recorded using
off-the-shelves market-available sensors for the purpose of analyzing users’
af-fective responses to video clips and computer-generated music excerpts. The
stimuli are selectively chosen to evoke certain target emotions. The first dataset
also includes the BigFive personality traits of individuals and we show that it is
possible to infer users’ personality traits given their spontaneous reactions to
affective videos. Both multimodal datasets are acquired via commercial sensors
that are prone to noise artifacts that lead to some noisy uni-modal recordings.
ends up with highly signal noise tolerance. We also show that peripheral
phys-iological signals include patterns that are similar across user. We develop a
cross-user affect recognition system that is successfully validated via a
leave-one-subject-out cross-validation scheme on the second dataset. (iii) We also
present a crowdsourcing protocol for the collection of time-continuous affect
annotations for videos. We collect a dataset of affective annotations for 12
videos with the contribution of over 1500 crowd-workers. We introduce
al-gorithms to extract high quality time-continuous affect annotations for the 12
videos from the noisy crowd annotations. We observe that, for the prediction of
time-continuous affect annotations given low-level multimedia content, higher
regression accuracies are achieved when the crowd sourced annotations are
employed as labels than expert annotations. The study suggests that
expen-sive expert annotations for large affective video corpora developments could be
replaced by crowdsourcing annotation techniques. Finally, we discuss
opportu-nities for future applications of our research, and conclude with a summary of
our contributions to the field of affective computing.
Keywords
Acknowledgements
In the name of God, the Most Gracious, the Most Merciful
I would first like to thankmy wonderful mother whose soul is resting in peace
now, Sheida Abed Lati, and my beloved father, Ali Khomami Abadi, without
their continuous love, support and encouragement I never would have been
able to achieve any of my goals. This one is for you mom and dad! I love you
two for ever! I could never put into words how much I love you!
Second, a special thank you tomy lovely wife, Negar Rostamzadeh. Words
can-not describe how lucky I am to have you in my life. She has selflessly given more
to me than I ever could have asked for. I love you very much, and I look forward
to the lifelong journey ahead of us.
My special and profound thanks go to my amazing brothers, Mr. Koorosh
Khomami Abadi and Mr. Morteza Khomami Abadi, who offered invaluable
support, training, and love over my whole life. You have been always there for
me and you are in my heart for ever!
I am very grateful to my awesome advisor, Prof. Nicu Sebe, for guiding me
very well through my PhD journey and showing me the right way to become a
good scientist. He taught me how to be persistent while tackling hard research
problems. He supported me by all means in the development of top datasets
that will serve greatly the field of affective computing. He kindly encouraged
me to go through a great entrepreneurial experience that lead to the creation
of Sensaura Inc. He is both a great advisor and an amazing friend. Thank you
very much for giving me the great opportunity!
I am also thankful to Prof. Paolo Avesani, Prof. Ioannis Patras, Ostad Hamidreza
Bayat, Prof. Ramanathan Subramanian, Prof. Nathan Weisz, Dr. Gianpaolo
at FBK, MEG lab at CIMEC, and the MMV group at Queen Mary University of
London; especially to Dr. Francesca Belton, Dr. Andrea Stenico, Dr. Manuel
Zucchellini, Dr. Seyed Mostafa Kia, Dr. Jacopo Staiano, Dr. Azad Abad, Dr.
Julia Wache, Dr. Radu-Laurentiu Vieriu, Dr. Juan Abdn Miranda Correa, Dr.
Fabio Morreale, Dr. Heng Yang, Dr. Thomas Hartmann, Dr. Emanuele Olivetti,
and Dr. Philipp Ruhnau.
I thank the Semantics and Knowledge Innovation Lab (SKIL) , part of the
Joint Open Labs network of Telecom Italia, that provided fund and supports
for the first three years of my PhD. My thanks to my advisors, colleagues and
friends at the SKIL specially to Dr. Michele Vescovi, Dr. Fabrizio Antonelli, Dr.
Michele Caraviello, Mattia Pasolli, Silvana Bernaola and Roberto Larcher for
the great time we had and their mentorship.
I thank all the participants who helped me with the research experiments.
Your time and efforts are appreciated and yes! you have contributed to some
great scientific achievements.
I thank my friends and colleagues at TandemLaunch Inc. who provided
me a unique entrepreneurial research opportunity within the Sensaura project,
especially to Dr. Helge Seetzen, Matthew Smith, Emilie Boutros, Jean-Philip R.
Poulin, Jesus Cardenes Cabre, Robert Johnson, Prof. Bj¨orn W. Schuller, Prof.
Rafael A. Calvo, Prof. Kyunghyun Cho, Prof. Christopher Pal, Seth Tropper,
Fahd Benchekroun, Amir Bahador Gahroosi, Stefan M. Orzechowski, Claudia
Torregrosa, Dr. Rishabh Gupta and Dr. Tara Akhavan.
The last but not the least I want to thank my dear father in-law Ahmadali
Rostamzadeh, my dear mother in-law, Nayyereh Mabood Mojdehi, my dear
brother in-law Dr. Pooya Rostamzadeh, my lovely aunt Marzieh, my dear
cousins Rozita, Maria and Hoorieh who has been always there for me with
1 Introduction 1
1.1 Elicitation of emotions in users and stimuli selection . . . 3
1.2 Implicit Characterisation of Users’ Emotions Based on Sponta-neous Responses . . . 4
1.3 Implicit Characterisation of Users’ Personality Based on Spon-taneous Responses . . . 6
1.4 Affective Multimedia Retrieval via Implicit Affective Tagging . 8 1.5 Crowd sourcing affective multimedia tags: . . . 9
1.6 Structure of the Thesis . . . 10
2 MEG-based Multimodal Database for Decoding Affective Physio-logical Responses 11 2.1 Introduction . . . 13
2.2 Related Work . . . 15
2.3 Stimuli Selection . . . 17
2.4 Experiment Setup . . . 18
2.4.1 MEG, peripheral physiological signals, and NIR facial videos . . . 18
2.4.2 Experimental set-up . . . 22
2.5 Rating Analysis . . . 25
2.5.1 Self-assessments: Music vs movie clips . . . 25
2.6.1 MEG preprocessing and feature extraction . . . 27
2.6.2 Peripheral physiological feature extraction . . . 29
2.6.3 Facial Expression Analysis . . . 33
2.6.4 Multimedia features . . . 33
2.7 MEG correlates with user ratings . . . 33
2.8 Experimental Results . . . 36
2.8.1 Single-trial Classification: MEG versus EEG . . . 37
2.8.2 Classification procedure and results . . . 38
2.8.3 Discussion of classification results . . . 39
2.9 Continuous Emotion Estimation . . . 42
2.10 Conclusion . . . 45
3 Emotion and Personality Recognition using Commercial Sensors 47 3.1 The ASCERTAIN Dataset and Research . . . 48
3.1.1 Related Work . . . 51
3.1.2 ASCERTAIN Overview . . . 55
3.1.3 Descriptive Statistics . . . 61
3.1.4 Personality measures vs user ratings . . . 67
3.1.5 Physiological correlates of emotion and personality . . . 71
3.1.6 Recognition results . . . 75
3.1.7 Discussion . . . 79
3.2 Signal Quality Matters - QAMAF . . . 81
3.2.1 Introduction . . . 82
3.2.2 Affect Classifier Development . . . 85
3.2.3 Quality Adaptive Multimodal Fusion . . . 86
3.2.4 Results . . . 88
3.2.5 Discussion and Conclusion . . . 90
4.1 Related work . . . 95
4.1.1 Crowdsourcing . . . 95
4.1.2 Affective movie analysis . . . 96
4.1.3 Crowdsourcing for affective media tagging . . . 96
4.1.4 Multi-task learning . . . 97
4.2 Experimental Protocol . . . 97
4.2.1 Dataset . . . 97
4.2.2 Experimental Protocol . . . 97
4.2.3 Annotation Mechanism . . . 100
4.3 Multimedia Feature Extraction . . . 101
4.3.1 Video Features . . . 101
4.3.2 Audio Features . . . 103
4.4 A Conditioned Crowd is Better Than the Expert . . . 104
4.4.1 Quality control without prior knowledge . . . 105
4.4.2 Quality control with prior knowledge . . . 108
4.4.3 Aggregation of accepted annotations . . . 110
4.4.4 Agreement Between Annotators . . . 111
4.4.5 Wisdom of Crowd vs. Experts . . . 113
4.4.6 Feature Preprocessing . . . 114
4.4.7 Label Extraction, aggregation of continuous annotations 114 4.4.8 Regression Algorithm and Inner-loop parameter opti-mization . . . 115
4.4.9 Information Fusion: Early vs. Late . . . 116
4.4.10 Prediction Post-processing . . . 117
4.4.11 Results . . . 117
4.5 Applying a Multi-task Learning Framework . . . 118
4.5.2 Experiments and Results . . . 121 4.6 Conclusion and future work . . . 123
5 Conclusion and Future Work 125
Introduction
Giant leaps in Human-computer interaction (HCI) research over the past decade have made computers an integral part of human life. Like humans, intelligent agents endowed with cognitive capabilities can learn from user behavior to pre-dict their actions and present information in a user-centric manner. Neverthe-less, human actions are guided by both cognition and emotion, and a person’s emotional state can provide significant clues to his/her behavior [25]. It would indeed be beneficial if HCI systems can interpret and learn from the user’s emotional response- e.g., knowing when the user is satisfied/frustrated with a system’s output is valuable feedback, which can help improve the system’s us-ability and user experience. Affective computing relates to the development of systems that can recognize human emotions during interactions, and formulate appropriate responses.
The first issue is most evident when the train/test datasets are collected using commercial, portable sensors instead of specialized lab equipments (see chap-ter 3).
The second issue is one of the main challenges in the field of affective computing[16] that is usually tackled by employing affective stimuli that are
not controversial, meaning, they evoke consistent emotions across users with
various backgrounds (such as age, gender, race, culture and personality). The stimuli selection step is a fundamental steps in any user-centric affect analysis study that we also cover(See chapter 2).
1.1
Elicitation of emotions in users and stimuli selection
Many affective studies have been conducted with image stimuli, and there exist standard datasets such as [60] for researchers to conduct experiments and eval-uate their findings. However, there exist few affective video datasets, in spite of studies confirming that reliable emotion elicitation is feasible with video stim-uli such as movies [38]. An affective music video dataset, comprising 40 music videos, was recently presented in [57]. Our endeavor was to create a large-sized affective movie dataset along those lines owing to the following reasons:
1. The importance of context in emotion perception has been acknowledged by many studies (e.g., [7]). Temporal context can be conveyed effectively by both audio and visual content in movies, whereas context in music videos is predominantly conveyed by the audio, which is supplemented by the visual information.
2. As a result, movies can effectively elicit a larger range of emotions (e.g., including surprise/shock and fear) as compared to music videos.
In part of our research (chapter2), we investigated the suitability of different types of video stimuli for emotion elicitation. For a study examining viewers’ emotional responses to be successful, the employed stimuli should effectively elicit the emotions targeted by the study. While some works have attempted to identify appropriate video stimuli for studying affect [32, 8], different authors have have employed different stimuli for emotion elicitation. [68] presents an affect characterization study using 21 movie clips, while the authors in [57] elicit emotions through music videos.
1.2. IMPLICIT CHARACTERISATION OF USERS’ EMOTIONS BASED ON SPONTANEOUS RESPONSES
observed emotional response with the expected response is a non-trivial
prob-lem which is typically simplified in practice employing the following ideas: (1) Most affective studies assume that the entire gamut of human emotions can be represented as a set of points on the valence-arousal1 plane as demonstrated by Greenwald et al. [31], and (2) To largely ensure that the elicited and expected emotions are consistent, the presentation stimuli are carefully selected based on previous studies, or based on ’ground truth’ valance-arousal ratings compiled from a large population that evaluates the stimuli prior to the actual experiment. Emotional states have been found to produce specific types of physiological responses- e.g., excitement is associated with increased heart-beat and respi-ration rates, and this correlation is exploited in a number of physiology-based affect studies. Heart-rate, skin temperature and conductance level, blood pres-sure and facial EMG are recorded as subjects view affective imagery in [103]. Their experiments indicate that the responses for anger and fear are uniquely different from responses to neutral images.
1.2
Implicit Characterisation of Users’ Emotions Based on
Spontaneous Responses
Humans perceive emotions from the environment through visual and auditory stimuli- characterized by speech, audio/video music clips, images and movies in the digital world. While many studies have investigated how speech and image signals can effectively elicit emotions in people [84, 103], research on isolating emotional content in music and movie videos began only recently. Past works such as [37, 41] have attempted to identify emotions either by (i) analyzing the content to develop models that link low-level image and audio features to valence (emotion type) and arousal (emotion intensity) or (ii)
ana-1Valence indicates the type of emotion induced by the stimulus in the viewer (e.g., pleasant or unpleasant),
lyzing the viewer’s facial activity/expressions and correlating these responses with the presented content. While content-based analysis enables discovery of video highlights (typically high-arousal segments), it is inherently not suited for tagging content on the valence-arousal plane. Conversely, while facial ex-pressions can provide some insight regarding emotional video content, they can easily be controlled by the viewer and are therefore, not always reliable.
The above shortcomings have prompted researchers to investigate emotional response to affective stimulus through physiological responses such as (i) Elec-troencephalogram (EEG), which measures electrical activity along the scalp, (ii) Electromyogram, measuring electrical activity of skeletal muscles, (iii) heart rate, (iv) galvanic skin response (GSR) measuring skin conductance and (v) skin temperature, etc. These signals2 have been found to effectively encode emotional responses [68, 57] and are more primitive than facial expressions, which typically denote the conscious manifestation of an emotion.
In chapter 2, we examine the feasibility of employing the Magnetoen-cephalogram (MEG) signal for measuring emotional responses to affective mu-sic and movie videos. MEG localizes activated superficial parts of the brain. When a group of neurons is activated, electrical currents along the neurons gen-erate tiny, orthogonally oriented magnetic fields. The sum of these magnetic fields generates a change in magnetic field around the activated part, and con-stitutes the MEG response. While many EEG studies (e.g., [68, 57, 109]) have successfully decoded affective viewer response to videos, there are no such MEG-based studies. However, the fact that MEG can effectively encode af-fective responses, similar to EEG, is demonstrated in [90] employing image stimuli. Their results are obtained on analyzing event-related magnetic fields (ERF), where an individual’s brain responses are acquired over many trials and averaged. In contrast,we present MEG could be employed for single-trial
clas-2EEG is the response from the central nervous system, while the remaining are responses from the peripheral
1.3. IMPLICIT CHARACTERISATION OF USERS’ PERSONALITY BASED ON SPONTANEOUS RESPONSES
sification of affective viewer responses to videos.
1.3
Implicit Characterisation of Users’ Personality Based on
Spontaneous Responses
The need to recognize the affective state of users for effective human-computer interaction has been widely acknowledged. Nevertheless, affect is a highly sub-jective phenomenon influenced by a number of contextual and psychological factors includingpersonality. The relationship between individuals’ personality traits and emotional responses has been actively studied by social psychologists ever since a correlation between the two was proposed in Eysenck’s personality model [28]. Eysenck posited that (i) Extraversion, the personality dimension that describes a person as being either talkative or reserved, is accompanied by low cortical arousal– i.e., extraverts require more external stimulation than in-troverts, and ii) Neurotics, characterized by negative feelings such as depression and anxiety, become very easily upset or nervous due to minor stressors, while emotionally stable persons remain composed under pressure.
ratings of users obtained post clip viewing, and their personality scores through statistical analysis. Then, we analyze the correlations between physiological features, emotional responses and personality measures. Finally, classification results for the five personality dimensions are presented. Chapter 3 makes the following research contributions:
1. To our knowledge, our research outputs that are presented in chapter 3 cover the first work to attempt personality profiling based on implicit user responses to affective multimedia. Personality assessment has traditionally been achieved through the use of questionnaires, or by analyzing users’ behavior in videos and social media. The methodology we propose can enable simultaneous and automated annotation of affective content and personality dimensions.
2. Among studies that have analyzed the relationship between personality traits and affective responses, the study is the first work to attempt pre-diction of all the big-five factors as well as use movie stimuli for elic-iting emotions. Furthermore, the use of off-the-shelves portable sensors for measuring user responses enhances the applicability of our profiling framework in real-life settings.
1.4. AFFECTIVE MULTIMEDIA RETRIEVAL VIA IMPLICIT AFFECTIVE TAGGING
1.4
Affective Multimedia Retrieval via Implicit Affective
Tag-ging
Affective media tagging has evoked considerable interest among multimedia researchers lately. Varied methodologies have been adopted for characterizing affective media including analysis of the content [37], or the behavior of users viewing emotional content in terms of facial expressions [41] and physiological responses such as brain activity, heart beat rate and skin conductance [68, 57,
109,50]. While content-based methods have been unable to bridge the semantic gap between low-level audiovisual features and high-level emotion, user-based approaches have only achieved moderate success due to prevalent differences between the expected emotion (which the content creator or director intends to convey), and the actualemotion evoked in different users.
The burgeoning number of platforms for online multimedia stream-ing/storage (e.g. YouTube, Netflix) has resulted in generation of a huge database of multimedia content online. In 2015, approximately 400 hours of videos were uploaded every minute on YouTube3. This enormous amount of data is not lim-ited to the online realm, the availability of portable devices storing thousands of music tracks and pictures has brought massive amounts of multimedia in-formation in our pockets. However, the huge amount of generated multimedia information needs to be indexed to be searchable and retrievable by the users.
Most of existing multimedia retrieval systems that rely on user-generated labels for indexing are potentially biased by subjective judgements and/or intentions[85]. Moreover, manual tagging of multimedia content interrupts the user experience process. Therefore, it is necessary to automate the process of multimedia indexing through implicit tagging. The classical multimedia in-dexing relies on cognitive inin-dexing procedures which are based on concepts to characn terize the multimedia content, such as locations, objects, and events.
Whereas, a recent approach, the so-called affective indexing, depends on the emotions generated by the multimedia content [109]. The implicit affective in-dexing technique is expected to provide more detailed and meaningful informa-tion regarding users experience with multimedia [85, 52]. Previously, affective tags have been used for indexing multimedia content for improving information retrieval and recommendation systems [98, 52, 134].
1.5
Crowd sourcing affective multimedia tags:
With the proliferation of multimedia content on the web, the need to tag or in-dex audio and video based on the type of information (sports, documentary) and emotions (funny, exciting) they convey has become essential– Hanjalic and Xu [37] term the former as cognitive and the latter as affective categorization. Furthermore, since movie genres are expressly defined by the emotions they evoke (e.g., comedy, thriller,romance), the need to develop automated methods for affective movie categorization is paramount. However, content-centric ap-proaches that attempt to estimate the scene emotion continuously over time [37], and user-centered methods that utilize physiological responses to estimate the general scene emotion [52,57] have only been moderately successful. The lim-ited success has been partly due to the (1) inherent difficulty in representing emotion and (2) non-availability of extensively labeled training data for this purpose.
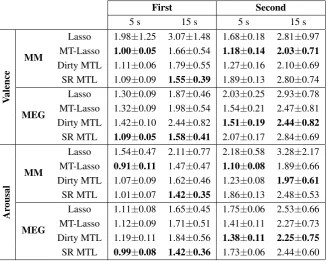
Process-1.6. STRUCTURE OF THE THESIS ing both the expert and (cleaned) crowd-annotated data, we arrive at a repre-sentative time-continuous emotion characterization for each clip. Finally, we predict the valence and arousal for a given clip (i) based on a generalized lin-ear model (GLM) trained with low-level, audio-visual features and (expert or crowd) annotations for the remaining clips and (ii) a multi-task learning ap-proach. Comparison of prediction results obtained with expert vs crowd labels showed that the crowd model outperformed the expert model, thereby confirm-ing our hypothesis.
1.6
Structure of the Thesis
MEG-based Multimodal Database for
Decoding Affective Physiological
Responses
Humans feel emotions when looking at movies or when listening to or watching music videos. One way to capture these emotions is using facial expressions, but these are easily controllable and not always reliable. In addition, the litera-ture has investigated facial expressions and psychological signals in depth. On the other hand, the brain signals seem to be a more reliable way of capturing the genuine emotions. To the best of our knowledge, particularly the Magnetoen-cephalogram (MEG) responses to dynamic stimuli has not been investigated in any emotion recognition studies. The hypothesis is that by measuring these sig-nals we are able to capture reliably the emotions felt by the users. By doing a comprehensive study under several stimuli we want to validate the hypoth-esis and show that indeed by using MEG, one can get a good estimate of the emotions.
Upon reviewing related literature, one can make the following observations:
the time required for subject preparation, stimulus viewing and recording user ratings while designing the experiment protocol. Also, the fact that fatigue strongly influences the quality of emotional responses discourages lengthy experiments with many stimuli.
2. While all these approaches have been generally successful in isolating physiological correlates of specific emotions arising from the presented stimuli, no comparison studies have been made to determine which stimu-lus is ideally suited for affect computation, given the experiment hypothe-ses and duration. This research targets one of the first steps in that direc-tion.
3. There are no available datasets having recorded MEG signals, physiologi-cal signals and video of the face of the subjects while they were stimulated by emotional video clips other than the one we developed in our research. The gap that we aim to fill is the one left by the deficit of a multi-modal emo-tion recogniemo-tion system, that has the capability to analyze MEG brain signals, standard physiological signals, facial expressions, and the verbal and non-verbal behaviors in response to dynamic stimuli. Another contribution of this study is to find the mappings between different modalities. Although each aspect of this problem (except MEG) has been considered as an interesting problem and has been investigated previously, studying all of these together gives us a proper scale for comparing these modalities regarding their ability to encode emotions. This chapter1 covers the development of a dataset2 to answer the following research questions (RQs):
• RQ1: Doed MEG brain signals encode affective brain responses to affec-tive video contents?
1The research is an extension to our previous works [49,50] and it is published [53] in IEEE Transactions on
Affective Computing, Jan. 2015.
2The developed dataset is publicly available to the research community:
• RQ2: Which class of affective video stimuli works better in eliciting con-sistent target emotions across users? Music video clips or video movie clips?
2.1
Introduction
Affect recognition is a necessity in human-computer interaction. Users’ de-mands can be implicitly inferred from their emotional state, and systems effec-tively responding to emotional inputs/feedback can greatly enhance user experi-ence. However, affect recognition is difficult as human emotions manifest both explicitly in the form of affective intonations and facial expressions, and subtly through physiological responses originating from the central and peripheral ner-vous system. Given that the majority of multimedia content is created with the objective of eliciting emotional reactions from viewers, representing, measuring and predicting emotion in multimedia content adds significant value to multi-media systems [1]. Approaches to predict affect from multimedia can be cat-egorized as (i) content-centric [37, 126], using primitive audio-visual features which cannot adequately characterize the emotion perceived by the viewer, or
(ii)user-centric, employing facial expressions [41] and speech intonations [84],
which denote a conscious and circumstantial manifestation of the emotion, or peripheral physiological responses [68], which capture only a limited aspect of human emotion.
2.1. INTRODUCTION naturalistic user response. Magnetoencephalogram (MEG) is a non-invasive technology for capturing functional brain activity, which requires little physical contact between the user and the sensing coil (Fig. 2.2), and therefore allows for (1) recording meaningful user responses, with little psychological stress and (2) compiling affective responses over long time periods. Also, MEG responses can be recorded with higher spatial resolution as compared to EEG.
In this chapter, we presentDECAF– a MEG-based multimodal database for decodingaffective user responses. Benefiting from facile data acquisition,
DE-CAF comprises affective responses of 30 subjects to 36 movie clips (of length
µ=80s, σ=20) and 40 1-minute music video segments (used in [57]), mak-ing it one of the largest available emotional databases3. In addition to MEG signals, DECAF contains synchronously recorded near-infra-red (NIR) facial videos, and horizontal Electrooculogram (hEOG), Electrocardiogram (ECG), and trapezius-Electromyogram (tEMG) peripheral physiological responses4. A major limitation of affective computing works [68, 57,109] that DECAF seeks to address is the lack of benchmarking with respect to stimuli and sensing modalities. DECAF facilitates comparisons between (1) MEG vs. EEG modali-ties for affect sensing via their performance on the DEAP database [57], and (2) music-video vs. movie clips concerning their suitability for emotion elicitation. We present analyses concerning (i) participants’ self-assessment ratings for
arousaland valencefor music and movie stimuli, (ii) correlations between user
ratings (explicit feedback) and implicitly observed MEG responses, and (iii) single-trial classification ofvalence,arousalanddominancefrom MEG, periph-eral responses, facial activity, content-based audio visual features and fusion of these modalities. Finally, time-continuous emotion annotations useful for dy-namic emotion analysis, were compiled from seven experts for the movie clips– as an application, we show dynamic emotion prediction on time-contiguous
3
http://disi.unitn.it/˜mhug/DECAF.html
4DECAF represents a significant extension of the dataset reported in [50], which only contains MEG and
snippets from the movie clips with a model trained using these annotations and audio-visual/MEG features.
The chapter is organized as follows: Section 2.2 overviews related work. Methodology adopted for movie clip selection is described in Section2.3, while the experimental protocol is detailed in Section 2.4. Analysis of users’ self as-sessments is presented in Section2.5, while features extracted for affect recog-nition are described in Section 2.6. Correlations between self-assessments and physiological responses along with single-trial classification results are pre-sented in Sections 2.7 and 2.8. Dynamic emotion estimation is detailed in Section2.9, and conclusions are stated in Section 2.10.
2.2
Related Work
Creating a stimulus database for eliciting emotions is crucial towards under-standing how affect is expressed in controlled lab conditions. Theactual emo-tion induced upon perceiving a stimulus designed to elicit an intended emo-tion is influenced by a number of psychological and contextual factors, and can therefore be highly subjective. Consequently, ensuring that theactual affective response is in agreement with the intended response is non-trivial, and is typ-ically achieved in practice as follows: (1) Many affective studies assume that the entire gamut of human emotions can be represented on the valence-arousal-dominance5(VAD) space as proposed by Bradley [13], and (2) To largely ensure that the elicited and intended emotions are consistent, presentation stimuli are carefully selected based on literature, or based on ‘ground truth’ V-A ratings acquired from a large population that evaluates them prior to the actual study.
Gross and Levenson’s seminal work on affective database creation [32]
2.2. RELATED WORK uates the responses of 494 subjects to 250 movie clips for identifying 16 movie clips capable of evoking eight target emotions. Content-based affect recog-nition works [37, 126] also perform emotion analysis on movie clips/scenes. User-centric emotion recognition works have employed a variety of stimuli to elicit emotions– Joho et al. [41] use a combination of movie and documen-tary clips to evoke facial activity, which is then used for highlights detection. Use of physiological responses for recognizing affect, pioneered by Sinha and Parsons [103] to distinguish between neutral and negative imagery, has gained popularity recently. Lisetti and Nasoz [68] use movie clips and mathematical equations to evoke emotions, which are decoded from users’ skin conductance, heart rate, temperature, EMG and heat flow responses. Kim and Andr´e [56] use audio music clips to induce emotions, recognized through heart rate, EMG, skin conductivity and respiration changes.
Among cognition-based approaches, the DEAP dataset [57] is compiled to develop a user-adaptive music recommender system. It contains EEG, galvanic skin response (GSR), blood volume pressure, respiration rate, skin temperature and EOG patterns of 32 viewers watching 40 one-minute music video excerpts. The MAHNOB-HCI database [109] is compiled to model emotional responses of users viewing multimedia stimuli. It contains face and upper-body video, audio, physiological and eye-gaze signals of 27 participants watching 20 emo-tional movie/online clips in one experiment, and 28 images and 14 short videos in another. Analyses on the DEAP and MAHNOB-HCI datasets confirm that EEG effectively encodes emotional information, especially arousal.
characterizes user emotional responses– answers to these questions can increase the efficacy of affect recognition approaches. DECAF is compiled with the aim of evaluating both stimuli and sensing modalities for user-centered affect recognition.
2.3
Stimuli Selection
One of our objectives was to compile a large database of affective movie stimuli (comparable in size to DEAP [57]) and user responses for the same. This section describes how the 36 movie clips compiled to this end were selected. Based on previous studies that have identified movie clips suited to evoke various target emotions [32, 8], we initially compiled 58 Hollywood movie segments. These clips were shown to 42 volunteers, who self-assessed their emotional state on viewing each video to provide: valence level (very negative to very positive), arousal level (very calm to very excited), and the most appropriate tag that de-scribes the elicited emotion (Table2.1).
These annotations were processed to arrive at the final set of 36 clips as follows:
(1) To ensure that the annotations are comparable, we transformed all V and A annotations using thez-score normalization.
(2) To better estimate the affective perception of annotators, we discarded the outliers from the pool of annotators for each video clip as follows: Along the V-A dimensions, we thresholded the annotations at zero to associate high (Hi)
and low (Li) video sets to each annotator (i = 1...42). We then computed
Jaccard distances DH, DL (42 ×42 matrices) between each pair of annotators i, j for the high, low sets, e.g., DH(i, j) = 1−
|Hi∩Hk|
2.4. EXPERIMENT SETUP the median were considered outliers as per [65]. In all, 5 and 2 outlier annotators were respectively removed for the V and A dimensions.
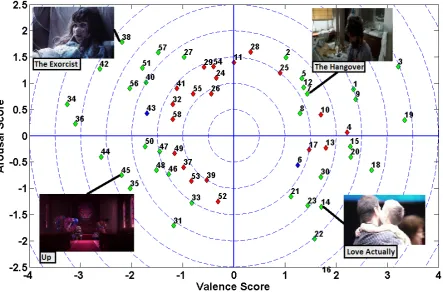
(3) Similar to [57], we computedµ/σ from the inlier V-A ratings for each movie clip as plotted in Fig. 2.1, and chose 36 clips such that (a) their ratings were close to the corners of each quadrant, (b) they were uniformly distributed over the valence-arousal plane, and (c) only one clip per movie was chosen from each quadrant to avoid priming effects. Table 2.1 contains descriptions of the selected movie clips, while Fig. 2.1 presents the distribution of µ/σ ratings for the original 58 clips and highlights the 36 selected clips. The mean V-A ratings listed in Table 2.1 are considered as ground truth annotations in our work. The chosen movie clips were 51.1–128.2s long (µ = 80, σ = 20) and were associated with diverse emotional tags. For benchmarking affective stimuli, we also recorded emotional responses to 40 one-minute music video used in the DEAP study [57].
2.4
Experiment Setup
In this section, we present a brief description of (a) MEG, peripheral physiolog-ical and facial signals recorded in the study before detailing the (b) experimental set-up and protocol.
2.4.1 MEG, peripheral physiological signals, and NIR facial videos
To collect users’ implicit affective responses, we recorded (i) Magnetoencephalo-gram (MEG), (ii) horizontal ElectrooculoMagnetoencephalo-gram (hEOG), (iii) ElectrocardioMagnetoencephalo-gram (ECG), (iv) Trapezius Electromyogram (tEMG) and (v) Near Infra-red (NIR) facial video signals that are described below.
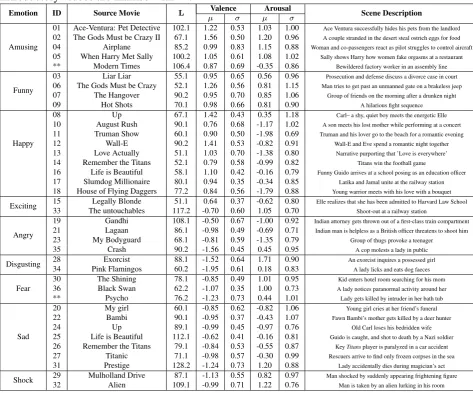
Table 2.1: Description of movie clips selected for the DECAF study with their duration in seconds (L), most frequently reported emotion tag and statistics derived from 42 annotators. Introductory videos are marked with **.
Emotion ID Source Movie L Valence Arousal Scene Description
µ σ µ σ
Amusing
01 Ace-Ventura: Pet Detective 102.1 1.22 0.53 1.03 1.00 Ace Ventura successfully hides his pets from the landlord
02 The Gods Must be Crazy II 67.1 1.56 0.50 1.20 0.96 A couple stranded in the desert steal ostrich eggs for food
04 Airplane 85.2 0.99 0.83 1.15 0.88 Woman and co-passengers react as pilot struggles to control aircraft
05 When Harry Met Sally 100.2 1.05 0.61 1.08 1.02 Sally shows Harry how women fake orgasms at a restaurant
** Modern Times 106.4 0.87 0.69 -0.35 0.86 Bewildered factory worker in an assembly line
Funny
03 Liar Liar 55.1 0.95 0.65 0.56 0.96 Prosecution and defense discuss a divorce case in court
06 The Gods Must be Crazy 52.1 1.26 0.56 0.81 1.15 Man tries to get past an unmanned gate on a brakeless jeep
07 The Hangover 90.2 0.95 0.70 0.85 1.06 Group of friends on the morning after a drunken night
09 Hot Shots 70.1 0.98 0.66 0.81 0.90 A hilarious fight sequence
Happy
08 Up 67.1 1.42 0.43 0.35 1.18 Carl– a shy, quiet boy meets the energetic Elle
10 August Rush 90.1 0.76 0.68 -1.17 1.02 A son meets his lost mother while performing at a concert
11 Truman Show 60.1 0.90 0.50 -1.98 0.69 Truman and his lover go to the beach for a romantic evening
12 Wall-E 90.2 1.41 0.53 -0.82 0.91 Wall-E and Eve spend a romantic night together
13 Love Actually 51.1 1.03 0.70 -1.38 0.80 Narrative purporting that ’Love is everywhere’
14 Remember the Titans 52.1 0.79 0.58 -0.99 0.82 Titans win the football game
16 Life is Beautiful 58.1 1.10 0.42 -0.16 0.79 Funny Guido arrives at a school posing as an education officer
17 Slumdog Millionaire 80.1 0.94 0.35 -0.34 0.85 Latika and Jamal unite at the railway station
18 House of Flying Daggers 77.2 0.84 0.56 -1.79 0.88 Young warrior meets with his love with a bouquet
Exciting 15 Legally Blonde 51.1 0.64 0.37 -0.62 0.80 Elle realizes that she has been admitted to Harvard Law School 33 The untouchables 117.2 -0.70 0.60 1.05 0.70 Shoot-out at a railway station
Angry
19 Gandhi 108.1 -0.50 0.67 -1.00 0.92 Indian attorney gets thrown out of a first-class train compartment
21 Lagaan 86.1 -0.98 0.49 -0.69 0.71 Indian man is helpless as a British officer threatens to shoot him
23 My Bodyguard 68.1 -0.81 0.59 -1.35 0.79 Group of thugs provoke a teenager
35 Crash 90.2 -1.56 0.45 0.45 0.95 A cop molests a lady in public
Disgusting 28 Exorcist 88.1 -1.52 0.64 1.71 0.90 An exorcist inquires a possessed girl 34 Pink Flamingos 60.2 -1.95 0.61 0.18 0.83 A lady licks and eats dog faeces
Fear
30 The Shining 78.1 -0.85 0.49 1.01 0.95 Kid enters hotel room searching for his mom
36 Black Swan 62.2 -1.07 0.35 1.00 0.73 A lady notices paranormal activity around her
** Psycho 76.2 -1.23 0.73 0.44 1.01 Lady gets killed by intruder in her bath tub
Sad
20 My girl 60.1 -0.85 0.62 -0.82 1.06 Young girl cries at her friend’s funeral
22 Bambi 90.1 -0.95 0.37 -0.43 1.07 Fawn Bambi’s mother gets killed by a deer hunter
24 Up 89.1 -0.99 0.45 -0.97 0.76 Old Carl loses his bedridden wife
25 Life is Beautiful 112.1 -0.62 0.41 -0.16 0.81 Guido is caught, and shot to death by a Nazi soldier
26 Remember the Titans 79.1 -0.84 0.53 -0.55 0.87 KeyTitansplayer is paralyzed in a car accident
27 Titanic 71.1 -0.98 0.57 -0.30 0.99 Rescuers arrive to find only frozen corpses in the sea
31 Prestige 128.2 -1.24 0.73 1.20 0.88 Lady accidentally dies during magician’s act
2.4. EXPERIMENT SETUP
Figure 2.1: Distribution of videos’ µ/σ ratings in the V-A plane. The 36 selected videos are highlighted in green, while two introductory videos are highlighted in blue.
human brain are in the order of femtotesla (fT) and since sensors are really sen-sitive to noise, the MEG equipment is located in a magnetically shielded room insulated from other electrical/metallic installations. A multiple coils configu-ration enables measurement of magnetic fields induced by tangential currents, and thus, brain activity in the sulci of the cortex can be recorded. We used the ELEKTA Neuromagdevice which outputs 306 channels (corresponding to 102 magnetometers and 204 gradiometers, as in Fig.2.5) with a sampling frequency of 1 KHz.
There-fore, we asked subjects to not move their head during the recordings. To com-pensate for inadvertent head movements, before each recording, we attached five Head Position Indicator (HPI) coils to accurately determine the subject’s head pose. Two HPI coils were attached behind the ears without being in the hair, while three coils were interspersed on the forehead. Prior to the experi-ment, we also recorded the subject’s skull shape by sampling the 3D positions of 210 points uniformly distributed around the skull6.
ECG: ECG is well known for its relevance in emotion recognition [56, 57,
109]. ECG signals were recorded using three sensors attached to the participant. Two electrodes were placed on the wrist, and a reference was placed on a boney part of the arm (ulna bone). This setup allows for precise detection of heart beats, and subsequently, accurate computation of heart rate (HR) and heart rate variability (HRV).
hEOG: Electrooculography denotes the measurement of eye movements, fixations and blinks. In this study, we used hEOG which reflects the horizontal eye movement of users by placing two electrodes on the left and right side of the user’s face close to the eyes. Zygomatic muscle activities produce high frequency components in the bipolar EOG signal, and hence the EOG signal also captures facial activation information.
tEMG: Different people exhibit varying muscle movements while experi-encing emotions. However, some movements are involuntary– e.g., nervous twitches produced when anxious, nervous or excitable. Trapezius EMG is shown to effectively correlate with users’ stress level in [128]. We placed the EMG bipolar electrodes above the trapezius muscle to measure the mental stress of users as in [56, 57]. The ECG reference electrode also served as reference for hEOG and tEMG.
NIR Facial Videos: As the MEG equipment needs to be electrically shielded,
6While DECAF contains HPI information, HPI-based MEG signal compensation will be attempted in future
2.4. EXPERIMENT SETUP traditional video cameras could not be used for recoding facial activity, and we therefore used a near infra-red camera for the same. Facial videos were recorded as avifiles at 20 fps.
The ELEKTA Neuromag device accurately synchronizes MEG signals with the peripheral physiology signals. Synchronization of the NIR videos was han-dled by recording the sound output of the stimulus presentation PC with the user’s facial videos, and using this information to determine stimulus begin-ning/end.
2.4.2 Experimental set-up
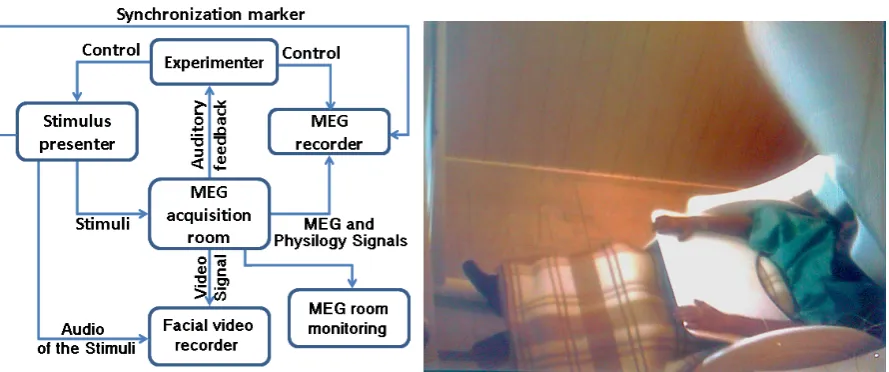
Materials: All MEG recordings were performed in a shielded room with controlled illumination. Due to sensitivity of the MEG equipment, all other devices used for data acquisition were placed in an adjacent room, and were controlled by the experimenter. Three PCs were used, one for stimulus presen-tation, and two others for recording NIR videos and MEG, physiology data as seen in Fig. 2.2. The stimulus presentation protocol was developed using MAT-LAB’s Psychtoolbox (http://psychtoolbox.org/) and the ASF framework [96]. Synchronization markers were sent from the stimulus presenter PC to the MEG recorder for marking the beginning and end of each stimulus. All stimuli were shown at 1024 × 768 pixel resolution and a screen refresh rate of 60 Hz, and this display was projected onto a screen placed about a meter before the subject inside the MEG acquisition room (Fig. 2.2). All music/movie clips were played at 20 frames/second, upon normalizing the audio volume to have a maximum power amplitude of 1. Participants were provided with a microphone to report their emotional state and communicate with the experimenters.
Figure 2.2: (Left) Illustration of the experimental set-up. (Right) A subject performing the experiment– the stimulus is presented on the screen to the left, while the subject is seated under the MEG equipment on the right.
Figure 2.3: Timeline for experimental protocol.
was counterbalanced across subjects. During each session, music/movie clips were shown in random order, such that two clips with similar valence, arousal characteristics did not follow one another. To avoid fatigue, each recording session was split into two halves (20 music/18 movie clips shown in each half) and lasted one hour. We recorded the resting state brain activity for five minutes at the beginning of each session, and for one minute at the end or before/after breaks.
2.4. EXPERIMENT SETUP MEG equipment, prior to each recording session, participants had to change their clothing and footwear– those wearing glasses were given suitable metal-free replacements. First, participants were briefed about the experiment and asked to provide written informed consent. HPI coils were placed on their head and their head shapes and coil positions were registered as explained in sec-tion 2.4.1. Once inside the MEG room, electrodes of physiological sensors were attached to participants, and by checking the impedance level of the elec-trodes from the MEG recorder, we made sure that they were comfortable and were positioned correctly under the MEG sensor. Participants were provided with a desk pad, pillows and blanket to relax during the experiment. We then recorded five minutes resting state brain activity while the subject was fixat-ing on a cross at the middle of the screen. Then, two practice trials (with the videos highlighted in blue in Fig 2.1, and denoted using ** in Table 2.1) were conducted to familiarize subjects with the protocol.
2.5
Rating Analysis
2.5.1 Self-assessments: Music vs movie clips
As mentioned earlier, one objective behind compiling the DECAF database was to examine the effectiveness of different stimuli in eliciting similar emotional responses across subjects. In this section, we compare the self-assessment (or explicit) valence-arousal ratings for music and movie clips provided by the DE-CAF participants. Since self-reports are a conscious reflection of the user’s emotional state upon viewing the stimulus, one can expect any differences be-tween the ratings for music and movie clips to also impact affect recognition from physiological responses.
Fig.2.4presents distributions of the V-A ratings provided by the 30 DECAF participants for movie and music clips. The blue, magenta, black and red col-ors respectively denote high arousal-high valence (HAHV), low arousal-high valence (LAHV), low arousal-low valence (LALV) and high arousal-low va-lence (HALV) stimuli as per the ground-truth ratings derived from Table2.1for movie clips and [57] for music videos. A U-shape, attributed to the difficulty in evoking low arousal but strong valence responses [60, 57], is observed for both movie and music clips. The ‘U’ bend is particularly pronounced in the case of music clips, implying that a number of stimuli were perceived to be close-to-neutral in valence, and there is considerable overlap among the four quadrants. For movie clips, perfect agreement with the ground-truth is noted for valence, but cluster overlap is observed along the arousal dimension.
We performed two-sample t-tests to check if the arousal characteristics of movie/music stimuli influenced their valence ratings– these tests revealed that valence ratings differed very significantly for HA music (t(18) = 9.4208, p <
0.000001), HA movie (t(16) = 13.5167, p < 0.000001) clips and LA movie
2.5. RATING ANALYSIS
Figure 2.4: Mean V-A ratings for movie (left) and music clips (right) derived from DECAF participants.
levels were observed while comparing arousal ratings for HV music (t(18) = 4.2467, p < 0.0005) and movie (t(16) = 4.2988, p < 0.0005), as well as LV
music (t(18) = −4.8256, p < 0.005) and movie (t(16) = −3.3194, p < 0.005) stimuli. Overall, the valence-arousal distinction was slightly better for movie vis-´a-vis music clips.
2.6
Data Analysis
This section describes the procedure for data preprocessing and feature extrac-tion from (i) MEG signals, (ii) physiology signals, (iii) face videos and (iv) multimedia signals. All the cut-off frequencies and smoothing parameters em-ployed were adopted from [56,109,57]. For both MEG and peripheral physio-logical modalities, we computed (1) time-continuous features for dynamic emo-tion analysis and (ii) statistical measures7 computed over the time-continuous features, considering only the final 50 seconds.
2.6.1 MEG preprocessing and feature extraction
MEG preprocessing involved three main steps, (i) Trial segmentation, (ii) Spec-tral filtering and (iii) Channel correction, that were handled using the MATLAB Fieldtrip toolbox [83]. Since magnetometer outputs are prone to environmental and physiological noise, we only used the gradiometer outputs for our analysis. Trial Segmentation: Participant responses corresponding to each trial were extracted by segmenting the MEG signal from 4 seconds prior to stimulus pre-sentation (pre-stimulus) to the end of stimulus. Per subject, there were 36 and 40 trials for the movie clips and music videos respectively.
Frequency domain filtering: Upon downsampling the MEG signal to 300 Hz, low-pass and high-pass filtering with cut-off frequencies of 95 Hz and 1 Hz respectively were performed. The high-pass filter removes low frequency am-bient noise in the signal (e.g., generated by moving vehicles). Conversely, the low-pass filter removes high frequency artifacts generated by muscle activities (between 110-150 Hz).
Channel correction: Dead and bad channels were removed from the MEG
data. Dead channels output zero values, while bad channels are outliers with
7mean (µ), standard deviation (σ), skewness, kurtosis, percentage of values aboveµ+σ, and percentage of
2.6. DATA ANALYSIS respect to metrics such as signal variance and signal amplitude z-score over time. To preserve the dimensional consistency of MEG data over all trials and subjects, removed channels were replaced with interpolations from neighboring channels.
Time-Frequency analysis (TFA): The spectral power in certain frequency bands has been found to contain valuable information for affect recognition in a num-ber of EEG studies. The multitaper and wavelet transforms are typically used in order to achieve better control over frequency smoothing, and high frequency smoothing has been found to be beneficial when dealing with brain signals above 30 Hz [77]. Therefore, we used variable-width wavelets to transform the preprocessed MEG signal to the time-frequency domain for spectral power analysis.
MEG-TFA Features: We used a time-step of 1s for temporal processing of the MEG signal from each trial, and a frequency step of 1 Hz to scan through a fre-quency range of 1-45 Hz. We linearly varied the wavelet width with frefre-quency, increasing from 4 for lower frequencies to 8 for higher frequencies. Upon ap-plying a wavelet transform on the MEG data, we performed the following steps: (a) We used a standard Fieldtrip function for combining the spectral power of each planar gradiometer pair to obtain 102 combined-gradiometer (GRAD) re-sponses. (b) In order to better elucidate the MEG response dynamics following stimulus presentation for each subject, individual trial power was divided by a
baseline power, obtained as the mean over two seconds pre-stimulus from all
trials. (c) To increase dynamic range of the spectral power, the time-frequency output was logarithm transformed.
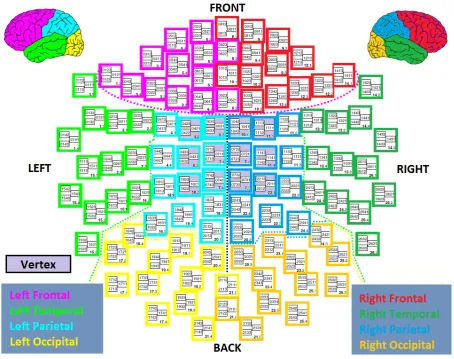
Channel Grouping: On computing the MEG spectral power over 102 GRAD
(Fig.2.5). The sensors in each group encode different brain functionalities that may directly or indirectly relate to emotions, and we show that this grouping is beneficial for affect recognition in Sec. 2.8. Per subject and movie/music clip, time-frequency analysis outputs nine (one per group) 3D matrices with the following dimensions: K× clip length time points ×45 frequencies, where K
denotes the number of GRAD channels per group.
DCT features: The Discrete Cosine Transform (DCT) is often used in
sig-nal, image and speech compression applications due to its strong energy com-paction ability. Also, the DCT feature space has been shown to efficiently compress spatio-temporal patterns of MEG data without impacting model pre-cision [54]. We employed DCT to compress the MEG-TFA output on a per-second basis, as well as for single-trial classification. Per per-second, from each of the 9 lobes we extracted 60 DCT coefficients (4 along spatial and 15 along spectral respectively), and concatenated them to extract 540 DCT features. For single-trial classification, from each brain lobe, we used the first n = 2 DCT coefficients from the spatial, temporal and spectral dimensions to obtain a total of9×8 = 72 features. We observed that classification results did not improve with n > 2 DCT coefficients per dimension– this could be attributed to the fact that our model training involves much fewer examples as compared to the feature dimensionality.
2.6.2 Peripheral physiological feature extraction
hEOG features
2.6. DATA ANALYSIS
Figure 2.5: Elekta Neuromag MEG channel positions. Channels corresponding to different lobes are color-coded (figure adapted fromwww.megwiki.org, best viewed under zoom).
Eye movements: To extract eye movement information, we low-pass filtered the signal with 5 Hz cut off, and then used wavelet transform to extract power spectral density (PSD) in 0-2 Hz range with a frequency resolution of 0.2 Hz, and temporal resolution of 50ms. Then for each second, we averaged the PSD values over frequency ranges of{[0,0.1),[0.1,0.2),[0.2,0.3),[0.3,0.4),[0.4,0.6),
[0.6,1.0),[1.0,1.5),[1.5,2)}. Therefore, we obtained 8 features per second to
describe eye movements.
frown or other facial expressions. We limited the signal to 105-145 Hz, and then used wavelet transform to extract PSD with a frequency resolution of 1 Hz and temporal resolution of 500 ms.
Then for each second, we averaged the PSD values over{[105,115),[115,130),
[130,145)} frequency ranges. Since there are many muscles controlling facial activities, we used the three bands to obtained fine-grained information regard-ing muscular activities. Therefore per second, we obtained three values to rep-resent zygomatic activities. Overall, from hEOG, we obtained 11 vectors of clip-length duration.
ECG features
From the ECG signal, we extracted information from both the original signal and its PSD.
Heart beats: We detected heart beats through R-peak detection in the ECG sig-nal. Upon removal of low frequency components, R-peaks were detected as the amplitude peaks. We then computed inter-beat-intervals (IBI), heart rate (HR) and heart rate variability (HRV) as the derivative of HR. Upon smoothing HR with a Kaiser window of temporal width 10 sec, and shape parameter β = 16), we computed two features (smoothed HR and HRV) per second from which, statistical measures over IBI, smoothed HR, and HRV during the final 50 sec-onds of each trial were derived for affect recognition.
Power spectral density: ECG was recorded at 1 KHz sampling rate, and we
used a wavelet transform over the ECG signal to extract the PSD in the fre-quency range of 0-5 Hz. Then, the mean PSD magnitudes over the frefre-quency intervals{(0,0.1],(0.1,0.2],(0.2,0.3],(0.3,0.4],(0.4,0.5],(0.5,0.6],(0.6,1],
(1,1.5],(1.5,2],(2,2.5],(2.5,5.0]} were used as features– this gave us 11 val-ues per second.
2.6. DATA ANALYSIS from 1 KHz to 256 Hz, and removed the low frequency drift. Then, we esti-mated the signal PSD using Welch’s method with a window length of 15 ×sr
and the overlap of 10 × sr, where sr denotes signal sampling rate. We used the mean PSD over {[0,0.1),[0.1,0.2),[0.2,0.3),[0.3,0.4]}bands, and the log-arithm PSD obtained for the sub-bands obtained on dividing [0, 2.4] into 10 equal intervals to obtain 14 more ECG PSD features.
Trapezius EMG
EMG effectively captures the mental stress of users [104]. As bipolar EMG electrodes are placed above the trapezius muscle, heart-related artifacts are ob-served in the signal and the EMG signal consists of two components: (1) Heart activities such as heart beats can be mainly inferred from the 0-45 Hz range, and (2) Trapezius EMG can be obtained from the{[55,95),[105,145)}range. Heart activities: We low-passed the signal to within 45 Hz, and used wavelet transform to extract the PSD map with frequency and tempo-ral resolution of 0.2 Hz and 50 ms respectively. Per second and trial, we computed the mean PSD over the following frequency bands: {[0,0.5),[0.5,1.5),[1.5,2.5),[2.5,3.5),[3.5,5.0),[5.0,10),[10,15),(15,25),
[25,45)}, to describe heart activities when the ECG signal was unavailable.
2.6.3 Facial Expression Analysis
We used histogram equalization to enhance contrast in the recorded NIR facial videos, and then employed the facial tracker described in [41] to track 12 fa-cial landmarks (Figure 2.6). Statistical measures over the activation of these landmarks in the final 50 seconds of each trial were used for classification.
Figure 2.6: Participant’s facial video before (left) and after (middle) histogram equalization. Tracking 3D grid is shown on the right.
2.6.4 Multimedia features
We computed low-level audio visual features from the movie and music clips as described in [57] for comparing different modalities, and identifying the salient emotional information sources– extracted features are listed in Table2.2. All in all, 49 video features and 56 audio features were extracted. For single-trial clas-sification, we computed statistics over 1-second segments, while using statistics from features computed at the frame level for fine-grained, per-second emotion estimation described in Sec.2.9.
2.7
MEG correlates with user ratings
2.7. MEG CORRELATES WITH USER RATINGS
Table 2.2: Extracted audio-visual features from each movie clip (feature dimension listed in parenthesis).
Audio features Description
MFCC features (39) MFCC coefficients [66], Derivative of MFCC, MFCC Autocorrelation (AMFCC)
Energy (1) and Pitch (1) Average energy of audio signal [66] and first pitch frequency
Formants (4) Formants up to 4400Hz
Time frequency (8) mean and std of: MSpectrum flux, Spectral centroid, Delta spectrum magnitude, Band energy ratio [66]
Zero crossing rate (1) Average zero crossing rate of audio signal [66]
Silence ratio (2) Mean and std of proportion of silence in a time win-dow [66,19]
Video features Description
Brightness (6) Mean of: Lighting key, shadow proportion, visual details, grayness, median of Lightness for frames, mean of median saturation for frames
Color Features (41) Color variance, 20-bin histograms for hue and light-ness in HSV space
VisualExcitement (1) Features as defined in [126]
Motion (1) Mean inter-frame motion [69]
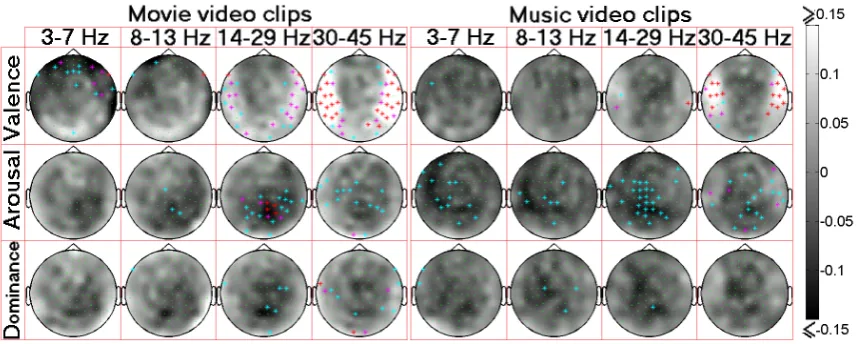
Following artefact rejection, we downsampled the MEG signal to 256Hz and then band-limited the same to within 1-48 Hz. Upon combining gradiometer outputs, the spectral power between 3 and 47 Hz over the last 30 seconds of each clip was extracted using Welch’s method with a window size of 256 sam-ples. Mean power over the θ ([3-8] Hz), α ([8-14] Hz), β ([14-30] Hz) and
γ ([30-45] Hz) for each of 102 MEG sensors were correlated with the users’ self-assessments.
GRAD outputs. Upon computing correlations for each subject, and assuming independence [61],p-values obtained for each subject and condition were fused over all users using Fisher’s method. Different from [57], we also accounted for multiple comparisons by controlling false discovery rate (FDR) using the procedure proposed in [11], and the observed significant correlations are high-lighted in Fig.2.7 (p < 0.05,0.01, and0.001 are respectively denoted in cyan, magenta, and red).
Observations: Observations similar to [57] can also be noted from Fig. 2.7. Thanks to the higher spatial resolution of MEG, a greater number of signif-icant correlates and a wider range of correlations ([-0.15,0.25] with MEG vs [-0.1,0.1] with EEG) are observed with MEG signals as compared to EEG. For both movie and music stimuli, we observe a negative correlation between α,
β and γ powers and the arousal level over the vertex, the parietal and occip-ital lobes, which is consistent with the findings in [57]. Over the temporal and occipital lobes, we observe a positive correlation between the θ, β and
γ powers and the valence level. Note that the occipital and temporal lobes encode low-level audio-visual information which are responsible for inducing emotions [126]. The possibility of facial muscle activities, which are also prominent at high frequencies, influencing the observed correlations between valence/arousal ratings and MEG responses is minimal as facial activities are likely to occur in response to both negative and positive valence stimuli (e.g., funny and disgust). Finally, a few significant negative correlates in the pari-etal lobe, and few positive correlates in the occipital lobe are observed between dominance ratings and the MEGβ, γ powers.
2.8. EXPERIMENTAL RESULTS correlations are observed over all frequency bands for arousal with music clips. We mention here that some of the detectable correlates for movie stimuli may have arisen from extraneous factors– e.g., correlates between θ, α powers and valence ratings may be attributed to eye movements/blinks. Likewise, positive correlation between γ power and dominance over the occipital lobes could be explained by low-level visual cues [79], while the similar but weaker correlate observed for arousal could be owing to the strong positive correlation between arousal and dominance ratings (0.57±0.24) across participants. Further exam-ination to more accurately identify the information source responsible for the above correlations would involve (1) HPI-based MEG signal compensation, (ii) Independent component analysis, and (iii) Brain source localization using MR brain scans, which is left to future work.
Figure 2.7: Spearman correlation analysis between the MEG responses and participants’ self-assessments. Correlation over each channel (in green) is denoted by the gray level, and signif-icant (p < 0.05, p < 0.01, andp <0.001) correlations are highlighted with ∗marks (in cyan, magenta, and red).
2.8
Experimental Results
Table 2.3: Mean binary classification performance for music-video clips with the schema de-scribed in [57]. F1-scores of distributions significantly over 0.5 are highlighted (*: p < 0.05, **:p <0.01, ***: p <0.001). NR denotes ’not reported’.
Music (SS)
Arousal Valence Dominance
Acc F1 Acc F1 Acc F1
EEG [57] 0.62 0.58** 0.58 0.56** NR NR Max Baseline [57] 0.64 0.50 0.59 0.50 NR NR MEG 0.62 0.58*** 0.59 0.55* 0.62 0.53* Max Baseline 0.52 0.50 0.54 0.50 0.66 0.50 2.8.1 Single-trial Classification: MEG versus EEG
In order to evaluate our MEG-based approach against the EEG framework de-scribed in [57], we attempted single-trial binary (high/low) classification of va-lence and arousal employing (i) labels derived from subject-wise self-reports and (ii) extracting MEG features in a manner identical to [57]. Employing the Naive-Bayes classifier and subject-specific models, only the top 10% discrimi-native features based on Fisher feature selection criteria were used in each loop of a leave-one-trial-out cross-validation scheme. Very comparable results with EEG and MEG obtained with this procedure (Table2.3) suggest that the affect encoding power of EEG and MEG are comparable. However, the increased spa-tial resolution of MEG allows for fine-grained affective analysis, which enables similar or superior recognition performance on music and movie clips using the features extracted in Sec.2.6as described later.
com-2.8. EXPERIMENTAL RESULTS paring the efficacy of different modalities for user-centric emotion recognition is a research problem requiring further investigation.
2.8.2 Classification procedure and results
On a per-user basis, we attempted to recognize the emotional valence (V),
arousal (A) and dominance (D) of a test music/movie clip as high/low based
on the MEG and peripheral physiological responses. Given the large subjec-tivity in user responses for music videos in [57], subject-specific labels were used for each stimulus. However, as (i) many significant correlates observed between ratings and MEG responses of the user population, and (ii) the stimu-lus label should reflect the perception of the population instead of individuals, we repeated the classifications with both population-based (denoted as PB in Table 2.4) and subject-based (SB in Table2.4) labels.
Under PB labeling, each stimulus was assigned a high/low (V/A/D) label based on whether its rating was higher or lower than the mean rating provided by the participant population for the stimulus set. Likewise, the SB label for each stimulus denoted whether its rating was higher/lower than the mean subject rat-ing. The proportion/distribution of positive and negative classes for movie and music V,A,D under PB/SB tagging is presented in Table 2.4. For SB labeling, the mean and standard deviation of the positive class distribution are specified. Under PB labeling, the proportion of positive and negative classes is most im-balanced for music and movie arousal, whereas the most im-balanced distributions under SB labeling are observed for movie valence and music arousal. Given the unbalanced positive and negative classes, we use F1-scores as the primary mea-sure to compare classification performance with different stimulus types and information modalities.
parame-ter was tuned by considering values in [10−4,104] using an inner leave-one-out cross-validation loop. As baselines, we present the F1-scores of (i) a random classifier, (ii) majority-based voting8 and (iii) voting based on training class distribution– note that the maximum baseline F1-score is 0.50. Instances where the F1-score distribution across subjects is significantly higher than 0.5 as de-termined by a pairedt-test are highlighted in Table2.4.
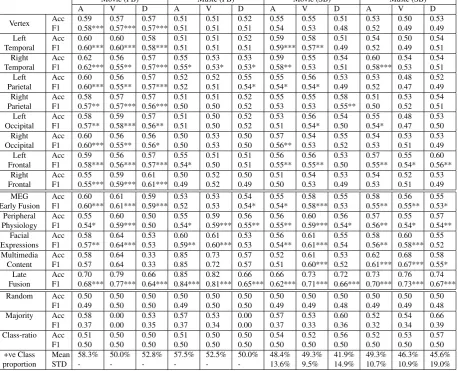
To demonstrate how the higher spatial resolution of MEG benefits affect recognition, we present results achieved with features extracted exclusively from each brain lobe, and also the concatenation of features from all lobes (MEG Early Fusion or MEF). In addition, we present accuracies and F1-scores achieved using (i) the combination of hEOG, ECG and tEMG responses (pe-ripheral physiology or PP), (ii) facial expressions (FE), (iii) multimedia features (MM), and (iv) late fusion of the decisions from the the MEF, PP, FE and MM classifiers following the methodology proposed in [58]. If {pi}4i=1 denote the
posterior probabilities output by the four classifiers and ti = αiFi/ P4
i=1αiFi,
where αi’s denote fusion weights and Fi denotes F1-score of the ith classifier
on training data, the optimal weights{α∗i}are chosen as those maximizing F1-score on the training set using an inner cross-validation loop. Posterior proba-bility of the test sample is computed as P
αi∗piti, which is then used to assign
the test label.
2.8.3 Discussion of classification results
In Table2.4, the obtained F1-scores clearly demonstrate that the increased spa-tial resolution of MEG benefits affect analysis and recognition. For all condi-tions, the classification performance obtained with MEG features from at least one of the nine brain lobes is similar to or better than the performance achieved with MEF, where features of all the brain lobes are pooled together. This result
8With leave-one-out classification on a balanced class distribution (Table 2.4), majority-based voting would
2.8. EXPERIMENTAL RESULTS
Table 2.4: Single trial classification for music and movie clips– (Upper) classification results using MEG information from each of the brain lobes. (Middle) Unimodal and multimodal classification results. (Bottom) Baseline comparisons along with the distribution of positive samples are tabulated. Mean F1 scores derived from a distribution significantly above chance level (0.50) are highlighted (*: p < 0.05, **: p < 0.01, ***: p < 0.001). PB, SB respectively denote use of population and subject-based labels in the classification framework.
Movie (PB) Music (PB) Movie (SB) Music (SB)
A V D A V D A V D A V D
Vertex Acc 0.59 0.57 0.57 0.51 0.51 0.52 0.55 0.55 0.51 0.53 0.50 0.53
F1 0.58*** 0.57*** 0.57*** 0.51 0.51 0.51 0.54 0.53 0.48 0.52 0.49 0.49
Left Acc 0.60 0.60 0.58 0.51 0.51 0.52 0.59 0.58 0.51 0.54 0.50 0.54
Temporal F1 0.60*** 0.60*** 0.58*** 0.51 0.51 0.51 0.59*** 0.57** 0.49 0.52 0.49 0.51
Right Acc 0.62 0.56 0.57 0.55 0.53 0.53 0.59 0.55 0.54 0.60 0.54 0.54
Temporal F1 0.62*** 0.55** 0.57*** 0.55* 0.53* 0.53* 0.58** 0.53 0.51 0.58*** 0.53 0.51
Left Acc 0.60 0.56 0.57 0.52 0.52 0.55 0.55 0.56 0.53 0.53 0.48 0.52
Parietal F1 0.60*** 0.55** 0.57*** 0.52 0.51 0.54* 0.54* 0.54* 0.49 0.52 0.47 0.49
Right Acc 0.58 0.57 0.57 0.51 0.51 0.52 0.55 0.55 0.58 0.51 0.53 0.54
Parietal F1 0.57** 0.57*** 0.56*** 0.50 0.50 0.52 0.53 0.53 0.55** 0.50 0.52 0.51
Left Acc 0.58 0.59 0.57 0.51 0.50 0.52 0.53 0.56 0.54 0.55 0.48 0.53
Occipital F1