The DOE-JGI Standard Operating Procedure for
the Annotations of Microbial Genomes
Konstantinos Mavromatis1*†, Natalia N. Ivanova1†, I-Min A. Chen2, Ernest Szeto2, Victor M. Markowitz2, Nikos C. Kyrpides1
1Genome Biology Program, Department of Energy Joint Genome Institute, Walnut Creek, California, USA
2Biological Data Management and Technology Center, Lawrence Berkeley National Labora-tory, Berkeley, California, USA
* Corresponding author:
††K. Mavromatis and N. Ivanova contributed equally to this work.
Keywords: Joint Genome Institute, gene prediction, functional annotation, GeneMark, Meta-gene, tRNA-Scan, RNAmmer, Rfam, IMG-ER.
Abbreviations: DOE-JGI: Department of Energy, Joint Genome Institute, IMG: Integrated
Mi-crobial Genomes, IMG-ER: IMG Expert Review, CRISPR: Clustered Regularly Interspaced Short Palindromic Repeats, MAP Microbial Annotation Pipeline.
The DOE-JGI Microbial Annotation Pipeline (DOE-JGI MAP) supports gene prediction and/or functional annotation of microbial genomes towards comparative analysis with the Integrated Microbial Genome [1] (IMG) system. DOE-JGI MAP annotation is applied onnucleotide se-quence datasets included in the IMG-ER (Expert Review) version of IMG via the IMG ER submission site. Users can submit the sequence datasets consisting of one or more contigs in a multi-fasta file. DOE-JGI MAP annotation includes prediction of protein coding and RNA genes, as well as repeats and assignment of product names to these genes.
Introduction
The DOE-JGI Microbial Annotation Pipeline (DOE-JGI MAP) is an automated pipeline for the annota-tion of bacterial and archaeal genomes. Annota-tion includes both the identificaAnnota-tion of protein-coding and non-protein-coding genes and repeats, as well as the prediction of the function of each gene and the assignment of a product name. The output of this pipeline is available through IMG-ER, which allows genomic analysis and manual curation in a comparative context of hundreds of genomes.
Requirements
The DOE-JGI MAP uses as input a multi fasta file containing the nucleotide sequences for annota-tion. In addition, a user is required to provide ad-ditional information regarding the project, namely the locus tag prefix for the predicted genes and
the method for protein and gene calling. Function-al annotation is Function-also optionFunction-al and the user needs to select whether it will be applied. The pipeline is implemented in Perl and uses a series of publicly available software applications.
Procedure
Gene prediction
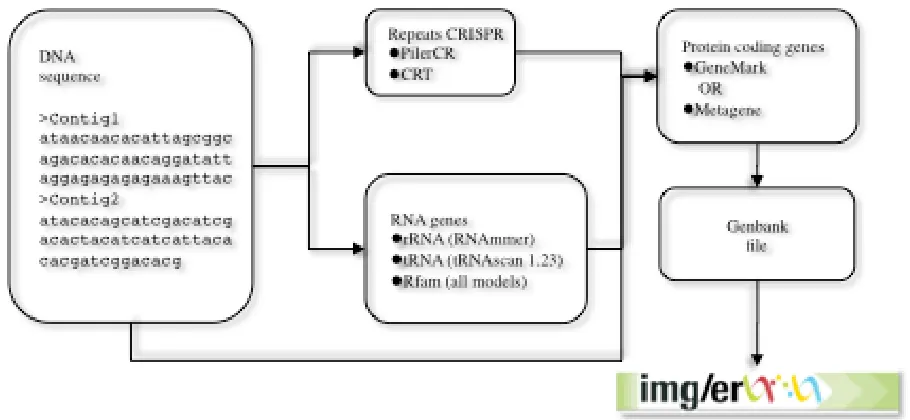
Genes are identified using a combination of Hid-den Markov Models and sequence similarity-based approaches. Other features, such as CRISPRs, are also predicted (Figure 1).
The gene prediction pipeline starts with the detec-tion of non-coding RNA genes (tRNA, rRNA and other RNA genes) and CRISPRs, followed by pre-diction of protein coding genes.
Bac-teria, Archaea) is a parameter that is required; all
other parameters are set to default values. Ribo-somal RNA genes (5S, 16S, 23S) are predicted us-ing the program RNAmmer [3] usus-ing the standard sets of HMMs for RNA genes, provided by the au-thors. With the exception of tRNA and rRNA, all models from Rfam [4] are used to search the ge-nome sequence. For faster detection, sequences are first compared to a database containing all the ncRNA genes in the Rfam database using BLAST, with a very loose cutoff. Subsequently, sequences that have hits to any genes belonging to an Rfam model are searched using the program INFERNAL, version 1 [5].
Identification of CRISPR elements is performed us-ing the programs CRT [6] and PILERCR [7]. The predictions from both programs are concatenated and, in case of overlapping predictions, the short-er prediction is removed.
Identification of protein-coding genes is per-formed using either GeneMark (v.2.6r) [8] or Me-tagene (v. Aug08) [9], both of which are ab initio
gene prediction programs. The regions identified previously as RNA genes and CRISPRs are masked with Ns in order to avoid prediction of protein-coding genes that overlap RNA genes. GeneMark is run using the parameter “combine”, which
com-bines the GeneMarkS generated (native) and Heu-ristic model parameters into one integrated mod-el. In the case of draft isolate genomes each contig is treated separately. Metagene is used with its de-fault parameters. At the end of the procedure the masked sequences are replaced with their original content. In the case of an overlap between a pro-tein coding-gene and an RNA gene, the propro-tein- protein-coding gene is truncated to the first start codon (ATG, GTG, TTG) in the same frame that eliminates the overlap or makes it shorter than 30 bp. If this is not possible, the predicted protein-coding gene is removed from the file.
Every annotated gene is given a locus tag of the form PREFIX_#####. Each locus tag is guaranteed to identify a unique gene within this project. How-ever it is up to the user to submit a unique locus tag prefix that will distinguish this project from other genome projects. The number part of each locus tag is a multiple of 10 allowing the future addition of new genes with loci between the exist-ing ones. Loci are simply identifiers and are not guaranteed to have any particular order or inter-nal structure. The output of this stage is a Gen-bank format genome file, which is uploaded to the IMG-ER database.
Figure 1 Data flow for gene prediction in the DOE-JGI MAP. Nucleotide sequences are annotated
Functional Annotation
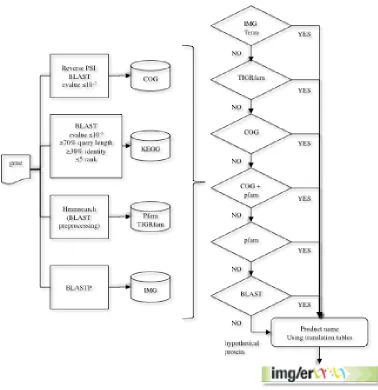
After a new genome is processed, the protein-coding genes are compared to protein families (e.g., COGs, Pfam) and the proteome of selected “core” genomes, which are publicly available, and the product name is assigned based on the results of these comparisons (Figure 2). The protein se-quences are compared to COG PSSMs obtained from the CDD database [10] using the program RPS-BLAST at an e-value cutoff of 1e-2, with the top hit retained. In addition, the sequences are searched against the KEGG genes database [11] using BLASTp and an e-value cutoff of 1e-5. A KEGG Orthology rank of 5 or better is assigned, with soft masking (-F ‘m S’) and greater than 70%
alignment length on the query and KEGG gene quences. The top hit is retained. Next, the se-quences are searched against the Pfam [12] and TIGRfam [13] databases using a BLAST prefilter-ing and subsequent comparison to HMMs usprefilter-ing hmmsearch [14]. The prefiltering is performed by running a BLAST search of the proteome against the seed sequences used to generate an HMM model with an e-value cutoff of 10 and low com-plexity masking turned off. All hits from the hmmsearch with hit scores better than the per family noise cutoff (--cut_nc) are retained and searched against the IMG proteome database us-ing BLASTp at an e-value cutoff of 10, soft maskus-ing (-F ‘m S’) and the top 20 hits are retained.
Figure 2. The gene product name assignment procedure used in the DOE-JGI MAP. Genes are
Our pipeline attempts to assign an IMG term[15] as the gene product name in the first pass; if no IMG term can be assigned, the product name is as-signed based on the TIGRfam hit. In the absence of an IMG term and TIGRfam hit, the product name is assigned based on the COG hit or Pfam hit. Assignment of IMG terms as product names in-cludes the following steps: First, it is verified that the CDS of interest has at least five homologs in the IMG database with >50% identity and at least two of these five homologs have an IMG term as-signed. An additional filtering is performed on the homologs with an IMG term based on alignment length in which the alignment length is >70% of the length of both the query and target proteins. A verification that the same combination of IMG terms is assigned to all homologs serves as a con-sistency check. If all conditions are satisfied, this IMG term (or a combination of IMG terms) is as-signed to the CDS of interest as a product name. Multiple IMG terms assigned to the same CDSs are separated by a “/”.
Annotation using TIGRfam hit is attempted, if as-signment of an IMG term as a product name fails. If a CDS has a hit above the noise cutoff to only one TIGRfam, the name of this TIGRfam is as-signed; if a CDS has hits to more than one TIGR-fam, the name of a TIGRfam of the type “equiva-log” is assigned. In the case of several hits to fams of the type “equivalog”, all names of TIGR-fams are concatenated into the product name with individual TIGRfam names separated by a “/”. For the CDSs that were not annotated with either IMG terms or TIGRfam names, the name of the COG hit is assigned as a product name. Under the condition that the CDS has at least 25% identity to the corresponding COG PSSM and the alignment length is at least 70% of the COG PSSM length. If the COG name is “uncharacterized conserved pro-tein” or contains “predicted”, the COG name and COG ID are concatenated in the product name. If either the percent identity or the alignment length condition are not satisfied, the CDSs may still be annotated with this COG name, provided that it has a hit to Pfam, which corresponds to this COG. This condition is verified using the COG-Pfam Cor-respondence Table. The latter was compiled by mapping Pfams onto COGs through the genes in the IMG database: if all genes in the IMG database with a hit to a certain COG also had hits to the same Pfam (or the same combination of Pfams),
this COG and Pfam(s) were designated as “corres-ponding COG and Pfam”.
For the genes that were not annotated with either IMG terms, TIGRfam or COGs the names of Pfam hits are used as product names. The product name in this case is a concatenation of Pfam family de-scription (attribute “dede-scription” in Pfam_family) with “protein”. If a CDS has hits above the noise cutoff to multiple Pfams, their descriptions are concatenated using a “/” as a separator and the word “protein” added in the end.
A translation table for protein product names based on TIGRfam, COG and Pfam descriptions in GenBank is constantly formatted throughout the document. This table has been compiled to make the final product names compatible with GenBank requirements and is used upon submission of the genome to GenBank.
Implementation
The DOE-JGI MAP is divided in two stages: gene calling and functional annotation. Gene calling and repeat identification is implemented in a series of Perl scripts that call the appropriate software and produce a GenBank file that does not have any functional information for the predicted genes. Subsequently, these genes are loaded into IMG-ER where all the steps of the functional annotation take place. Uploading annotated genomes into IMG-ER and functional annotation occurs in batches every two to three weeks. Submission in-formation is stored in an Oracle database. All pro-grams use default parameters unless stated oth-erwise in the corresponding section. Updates of databases and software versions occur when a new stable release is available.
Remarks
pipeline is publically available to the genomics community. In order to utilize the DOE-JGI MAP, users need to register and submit their draft or fi-nished genome sequence to the IMG-ER data sub-mission site (http://img.jgi.doe.gov/submit). It is our intention to keep improving the pipeline by augmenting the existing tools and adding new ones that allow the identification and characteri-zation of more elements in the genomes.
Acknowledgments
The work presented in this article was performed un-der the auspices of the US Department of Energy Office of Science, Biological and Environmental Research Pro-gram and by the University of California, Lawrence Li-vermore National Laboratory under Contract No. W-7405-Eng-48, Lawrence Berkeley National Laboratory under contract No. DE-AC02-05CH11231and Los Ala-mos National Laboratory under contract No. DE-AC02-06NA25396.
References
1. Markowitz VM, Szeto E, Palaniappan K, Grechkin Y, Chu K, Chen IM, Dubchak I, An-derson I, Lykidis A, Mavromatis K, et al. The integrated microbial genomes (IMG) system in 2007: data content and analysis tool exten-sions. Nucleic Acids Res 2008; 36:D528-533
2. Lowe TM, Eddy SR. tRNAscan-SE: a program for improved detection of transfer RNA genes in genomic sequence. Nucleic Acids Res
1997; 25:955-
3. Lagesen K, Hallin P, Rodland EA, Staerfeldt HH, Rognes T, Ussery DW. RNAmmer: con-sistent and rapid annotation of ribosomal RNA genes. Nucleic Acids Res 2007; 35:3100-3108
4. Griffiths-Jones S, Moxon S, Marshall M, Khan-na A, Eddy SR, Bateman A. Rfam: annotating non-coding RNAs in complete genomes.
Nucleic Acids Res 2005; 33:D121-12
5. Nawrocki EP, Kolbe DL, Eddy SR. Infernal 1.0: inference of RNA alignments. Bioinformatics. 2009; 25:1335-1337.
6. Bland C, Ramsey TL, Sabree F, Lowe M, Brown K, Kyrpides NC, Hugenholtz P. CRISPR recognition tool (CRT): a tool for automatic detection of clustered regularly interspaced palindromic repeats. BMCBioinformatics
2007; 8:
7. Besemer J, Lomsadze A, Borodovsky M. Ge-neMarkS: a self-training method for prediction of gene starts in microbial genomes. Implica-tions for finding sequence motifs in regulatory regions. Nucleic Acids Res 2001; 29
:2607-2618
8. Anonymous. PILER Genomic repeat analysis
software. 2009
9. Noguchi H, Park J, Takagi T. MetaGene: pro-karyotic gene finding from environmental ge-nome shotgun sequences. Nucleic Acids Res
2006; 34:5623-56
10. Marchler-Bauer A, Anderson JB, Derbyshire MK, DeWeese-Scott C, Gonzales NR, Gwadz M, Hao L, He S, Hurwitz DI, Jackson JD, et al. CDD: a conserved domain database for inter-active domain family analysis. Nucleic Acids
Res 2007; 35:D237-
11. Kanehisa M, Araki M, Goto S, Hattori M, Hi-rakawa M, Itoh M, Katayama T, Kawashima S, Okuda S, Tokimatsu T, et al. KEGG for linking genomes to life and the environment. Nucleic Acids Res 2008; 36:D480-4
12. Finn RD, Tate J, Mistry J, Coggill PC, Sammut SJ, Hotz HR, Ceric G, Forslund K, Eddy SR, Sonnhammer EL, et al. The Pfam protein fami-lies database. Nucleic Acids Res 2008;
36:D281-288
13. Haft DH, Selengut JD, White O. The TIGR-FAMs database of protein families. Nucleic
Acids Res 2003; 31:371-37
14. Eddy SR. Profile hidden Markov models.
Bioin-formatics 1998; 14:755-7