Protein-DNA interactions define the mechanistic
aspects of circle formation and insertion reactions
in IS2 transposition
Lewis
et al.
R E S E A R C H
Open Access
Protein-DNA interactions define the mechanistic
aspects of circle formation and insertion reactions
in IS
2
transposition
Leslie A Lewis
1,2*, Mekbib Astatke
3, Peter T Umekubo
1,4, Shaheen Alvi
1,5, Robert Saby
1,6, Jehan Afrose
1,7,
Pedro H Oliveira
8,9, Gabriel A Monteiro
8,9and Duarte MF Prazeres
8,9Abstract
Background:Transposition in IS3, IS30, IS21and IS256insertion sequence (IS) families utilizes an unconventional two-step pathway. A figure-of-eight intermediate in Step I, from asymmetric single-strand cleavage and joining reactions, is converted into a double-stranded minicircle whose junction (the abutted left and right ends) is the substrate for symmetrical transesterification attacks on target DNA in Step II, suggesting intrinsically different synaptic complexes (SC) for each step. Transposases of these ISs bind poorly to cognate DNA and comparative biophysical analyses of SC I and SC II have proven elusive. We have prepared a native, soluble, active, GFP-tagged fusion derivative of the IS2transposase that creates fully formed complexes with single-end and minicircle junction (MCJ) substrates and used these successfully in hydroxyl radical footprinting experiments.
Results:In IS2, Step I reactions are physically and chemically asymmetric; the left imperfect, inverted repeat (IRL), the exclusive recipient end, lacks donor function. In SC I, different protection patterns of the cleavage domains (CDs) of the right imperfect inverted repeat (IRR; extensivein cis) and IRL (selectivein trans) at the single active cognate IRR catalytic center (CC) are related to their donor and recipient functions. In SC II, extensive binding of the IRL CDin transand of the abutted IRR CD in cisat this CC represents the first phase of the complex. An MCJ substrate precleaved at the 3’ end of IRR revealed a temporary transition state with the IRL CD disengaged from the protein. We propose that in SC II, sequential 3’cleavages at the bound abutted CDs trigger a conformational change, allowing the IRL CD to complex to its cognate CC, producing the second phase. Corroborating data from enhanced residues and curvature propensity plots suggest that CD to CD interactions in SC I and SC II require IRL to assume a bent structure, to facilitate bindingin trans.
Conclusions:Different transpososomes are assembled in each step of the IS2transposition pathway. Recipient versus donor end functions of the IRL CD in SC I and SC II and the conformational change in SC II that produces the phase needed for symmetrical IRL and IRR donor attacks on target DNA highlight the differences.
Keywords:Curvature propensity plot data, extensive sequence-specific binding, figure-of-eight transposition inter-mediate, hydroxyl radical footprinting, minicircle junction, selective binding, synaptic complex, transpososome
Background
IS2, a 1.3 kb transposable element, is a member of the large and widespread IS3family of insertion sequences (IS) ([1,2] see also ISfinder: http://www-is.biotoul.fr/is. html). Transposition mechanisms in the IS3family can
be described as a two-step copy-and-paste process [3], in contrast to both classical cut-and-paste and replicative paradigms [4-6]. Although transposases of two IS3family members, IS911 [7-9] and IS2 [10,11] were originally shown to facilitate transposition by catalyzing the two distinct reactions whose steps are shown in Figure 1A, there is strong evidence for the existence of this pathway in other IS3 family members such as IS3 [12,13] and IS150[14] as well as for its more widespread use in the
* Correspondence: [email protected] 1
Department of Biology, York College of the City University of New York, Jamaica, New York 11451, USA
Full list of author information is available at the end of the article
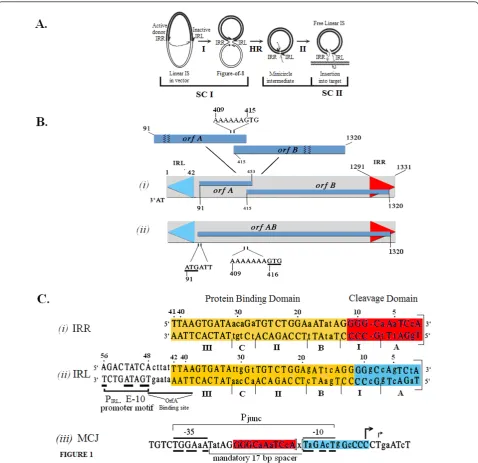
IS30[15,16], IS21[17] and IS256[18] families of inser-tion sequences. In general in these families, Step I involves a cleavage and joining reaction between the ends, one of which (the optional donor) is cleaved and participates in an asymmetric, intrastrand, strand-transfer reaction to a phosphodiester bond in host DNA near the other end (the recipient). The product is a branched structure, the figure-of-eight (F-8) transposition inter-mediate [7,11,16] in which two abutted single-stranded ends are separated by an interstitial spacer of one or more bases. The F-8 is then converted by host cell repli-cation mechanisms [3] to a covalently closed double-stranded transposition intermediate, the minicircle, (Figure 1A) whose abutted ends, separated by the spacer, comprise a reactive junction, the minicircle junction (MCJ). Minicircle insertion into the target occurs in Step II (Figure 1A) and requires that both ends function as donors [10,19]. Here, the reactive junction is the sub-strate for strand transfer reactions: it is cleaved at the abutted termini of the ends, creating 3’OH groups which undergo symmetrical transesterification attacks on target DNA. This results in the insertion of the element flanked by its direct repeats; see Rousseauet al., [2] for a detailed review.
The ends of IS2 are 41 bp and 42 bp right and left imperfect inverted repeats (IRR and IRL; Figure 1B) respectively; between these ends the IS encodes two over-lapping reading frames, OrfAand OrfB(Figure 1B, i). OrfA is a 14 kDa protein which has been reported in IS2 [20] to bind to a sequence just upstream of the weak indigenous extended-10 promoter (PIRL-[10]) located just
inside the left end (IRL) of the element (Figure 1C, ii). This weak promoter regulates the expression of IS2 pro-teins in Step I. The function of OrfB is unknown but a fusion protein OrfAB, the functional transposase (TPase), is generated by programmed -1 translational frameshift-ing [13,21,22] at a sequence of slippery codons (the A6G
frameshift window in IS2), located near the 3’end oforfA (Figure 1B, i). Mutation of this window to A7G in IS2
(Figure 1B, ii) produces OrfAB as the predominant spe-cies [11,23]. When the IS2ends are aligned (Figure 1C, i, ii), they show four non-conserved elements (I, A, B and C) and two conserved elements (II and III) which play critical roles in the transposition mechanism. Elements A and I comprise a cleavage domain (CD) and B, II, C and III, a protein binding domain (PBD). The differences in the sequences of the two ends are related to their donor and recipient end functions (see below) in Step I [24].
Several features distinguish circle formation and its con-sequences in IS2from those in other IS3family members. The reaction is physically as well as chemically asymmetric in that the right end functions uniquely as the donor or transferred end and the left end serves exclusively as the functional recipient end. This asymmetry is not unique to
IS2, having also been demonstrated in copies of IS256in Tn4001[18]. Recipient end function in IS2 is partially defined by the accuracy with which the joining reaction occurs. Abutted ends at the MCJ (Figure 1C, iii) are sepa-rated by a one or two base pair spacer with a ratio of 90% to 10% [11,24] but functional minicircles are limited to those with a single base pair spacer. This is so because creation of the MCJ in IS2assembles a promoter, Pjunc,
[25] which has an absolute requirement for a 17-nucleo-tide promoter spacer (Figure 1C, i, ii) that is conferred by the one base pair MCJ spacer. This more powerful Pjuncis
essential for and drives transposase reactions in Step II [10]. MCJ promoters with spacers of two or more base pairs are completely non-functional.
We concluded from earlier studies that differences in length and sequence of the two ends of IS2in Step I are responsible for the restriction of donor and recipient end functions to IRR and IRL respectively [24]. Differences in length are related to the correct positioning of the shorter donor end (IRR) in the catalytic pocket. However, random mutation in the A element of the AIRRsequence in an IRR CD eliminated minicircle production, while similar changes in AIRL in an IRL CD had no effect on the efficiency of minicircle formation; this result implied that extensive sequence-specific protein affinity for the A element was important in defining donor function but not recipient end function. For the B element, mutations in the BIRRsequence also eliminated minicircle forma-tion, implicating sequence-specific protein affinity. Addi-tional domain swapping experiments involved the substitution of a 6 bp BIRLsequence in an IRR derivative, which did not change the length of IRR (Figure 1C, i and 1C, ii). This reduced but did not eliminate IRR donor activity, implying that the protein had a weaker affinity for BIRL. Further evidence for some protein interaction with the BIRLsequence is that in IRL, its mutation (a tri-plet of point mutations) all but eliminated minicircle for-mation. These results suggested that the degree of sequence-specific interaction of the protein for sequences in or near the CDs may also be related to donor and reci-pient end functions; in an IRR end, extensive interaction of the protein with AIRRand BIRRwould be required for the donor function; however, in IRL the lack of extensive interaction of the protein with AIRLand a weak affinity for BIRLmay contribute to recipient end identity.
Additional data from experiments with AIRL threw light on this supposition. First, in an IS2 mutant with two IRR ends, the increase in length of one IRR by a single base pair alone was necessary and sufficient to convert it to a recipient end with no donor function. However, the addition of AIRL was absolutely essential for the accuracy of recipient end function. Furthermore, alteration of any one of three non-conserved nucleotides in positions 2, 5 and 7 in AIRL(Figure 1C, ii) that made
Lewiset al.Mobile DNA2012,3:1
http://www.mobilednajournal.com/content/3/1/1
the sequence more like that of the IRR CD reduced the accuracy of the joining reaction in Step I by increasing MCJ spacer size. We posited then, that the non-con-served base pairs in AIRL, through some interaction with the protein, were responsible for the accuracy of recipi-ent end function by correctly positioning the IRL CDin
transin the vicinity of the IRR CD to generate a single interstitial base pair between the abutted ends. (See the Results and discussion section for a complete analysis of all factors which define recipient end function.) It is interesting that mutation of position 2 of IRL, which converted the TA3’terminal dinucleotide to the CA3’ consensus in the IS3 family, did not confer functional donor activity on IRL [24], due, among other factors, to its incorrect positioning in the cognate catalytic center (CC). Finally, although the features described above for IRL define its accuracy as a recipient end, the sequence of the flanking host DNA can also play a role in deter-mining spacer size [24], implying that the host DNA sequence adjacent to IRL is also involved in some kind of interaction with the TPase.
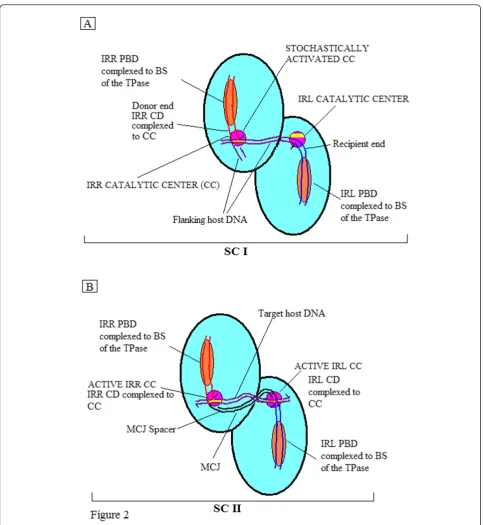
Mechanistically, in elements with F-8 transposition intermediates, the right and left ends of the linear element (attached to flanking host sequences) are organized with the transposase in Step I into a nucleoprotein complex known as the transpososome or Synaptic Complex (SC) I [26,27]. We have proposed [24] that generally for IS3 family members, each monomer of this complex, viewed as a dimer, would possess a binding site (BS) occupied by the PBD of one end and a cognate CC at which the CD would be boundin cis, that is, with PBD and CD bound on the same monomer (Figure 2A). By a stochastic process either one of these CCs would be activated to generate the donor end. This optional donor is cleaved and the exposed 3’OH group attacks a phosphodiester bond in the host DNA adjacent to the CD of the opposite end at a position corresponding to the distance between the two CCs. This forms the interstitial or MCJ spacer (equivalent to the size of the direct repeat) between the abutted single-stranded ends. In SC II transpososomes, the CDs of the MCJ sepa-rated by the short spacer would be boundin cisat the two active CCs (Figure 2B). There, sequential or concerted cleavages would generate 3’OH groups, whose symmetri-cal attacks on the target DNA appropriately positioned at the CCs would effect insertion and the formation of direct repeats. This general scenario would explain the similarity between the sizes of the MCJ spacer and the direct repeats.
For IS2, however, we proposed that in SC I, given the donor-inactive IRL, the 5 bp distance between the two CCs and the one base pair MCJ spacer size, the IRL CD would have to be positioned near the single active CC at which the IRR CD was bound to facilitate the joining reaction. For SC II, we proposed that the
abutted CDs separated by a single base pair would also be complexed at a single active cognate IRR CC (the first transition state) and that a series of cleavage-trig-gered conformational changes would result in each CD
cis-bound at its cognate CC (as shown in Figure 2B). It is important to note, however, that other factors may play an important part in this process in SC II, such as the role of the IS911 OrfA, which has been shown in
in vitro assays to stimulate insertion principally into DNA targets devoid of IS911 end sequences [28]. Nevertheless, in these ISs, the assembly of intrinsically different SC I and SC II transpososomes appears to be necessary [24,26]. This conclusion is applicable to cir-cle forming elements in the IS3 family which use the two-step pathway, for example, IS3[12,13] IS150[14] and IS911[7,8], where MCJ spacer size is similar (2 bp to 4 bp) to that of the direct repeat (see Figure 2). It is particularly true for the SC II in IS2[24] and in IS256in Tn4001[18], where physically asymmetric Step I reac-tions have been described and where the acquisition of donor function by the recipient end, lacking in Step I, is essential. Similar thinking would apply to IS21[29] and IS1665[30] where, as is the case in IS256, the interstitial MCJ distance is less than the size of the direct repeat. In this study we have tested these hypotheses with hydro-xyl radical footprinting analyses of Step I complexes of IS2 and by comparative footprinting analyses of cova-lently joined and pre-cleaved (or nicked) MCJ substrates in SC II.
The 46 kDa IS2 transposase is expressed in active soluble form with great difficulty and solubilized, rena-tured, highly purified preparations bind poorly to oligo-nucleotides containing cognate IRR and IRL sequences. A TPase derivative, C-terminal-tagged with GFP, pro-duced a full length soluble 74 kDa OrfAB-GFP fusion protein under native conditions. When purified to near homogeneity, this fusion protein also bound poorly to similar oligonucleotides even though it is fully active in
vivo [31]. These results of poor or low binding effi-ciency of the full length transposase are similar to those for IS911[26,27,32], IS30 [33,34] and IS256 [35]. As a consequence, a comparative biophysical analysis of protein-DNA interactions in fully formed Step I and Step II complexes with protein bound to both binding and cleavage domains of the ends has not been reported for this group of circle-forming insertion sequences. However, soluble, active preparations of partially purified IS2OrfAB-GFP produced complexes in which both the DNA BD or BS and the CC of the protein bound very efficiently to cognate IRR sequences in linear oligonucleotides [31]. We have now successfully used complexes created with single-end and MCJ substrates (Figure 3) to generate hydroxyl radical footprinting data.
Lewiset al.Mobile DNA2012,3:1
http://www.mobilednajournal.com/content/3/1/1
We show here that the footprinting patterns of both IRR and IRL single ends of IS2reveal bipartite structures. They differ in that the IRR CD is strongly and extensively protected while the IRL CD is only selectively or inter-mittently bound by the protein. We propose a model in which non-specific and/or selective binding to the adja-cent host sequence and selective binding to the IRL CD act additively in SC I to promote binding of the IRL CD
in transat the active cognate IRR CC. In SC II, extensive protection of both the IRL and the abutted IRR CDs, separated by a single base pair, suggests binding at a sin-gle active cognate IRR CC with the IRL CD boundin
trans, creating the first phase of the SC. Our data suggest that sequential cleavages (associated with small confor-mational changes) at the 3’termini of IRR and IRL at this active CC trigger a conformational change that leads to transition to a second phase; that is, each CD complexed
in cisto its own active cognate CC. In addition, the loca-tion of enhanced residues indicative of distorloca-tion or bending of DNA, corroborated by curvature propensity plot data, have helped gain insight into the paths of the IRL DNA which facilitate bindingin trans within the architecture of SC I and SC II transpososomes.
Results and discussion
Footprinting the single ends of IS2
Hydroxyl radical footprinting was carried out using 87 bp (R87) and 79 bp (L79) radio-labeled dsDNA sub-strates containing the 41 bp sequence of IRR and the 42 bp sequence of IRL, respectively. The substrates were prepared as annealed oligonucleotides with the labeled strand as the footprinting target (see the Methods sec-tion). The transposase was overexpressed from pLL2522, the plasmid with the orfAB::GFP fusion construct, and partially purified by nickel-nitrilotriacetic acid (Ni-NTA) affinity chromatography [31]. Mutational studies with this partially purified protein (specifically null mutants with a complete loss of binding proficiency), indicated strongly that the observed binding reactions did not result from trace amounts of the IS2Tpase from chro-mosomal copies of the element. In addition, two sets of results suggest that the presence of the GFP tag affected neither the binding properties nor the activity of OrfAB. First,in vivotransposition frequencies of the tagged tein are statistically identical to those of the native pro-tein [31]; secondly, in a cleavage assay [36], complexes formed in-gel with a mixture of 87-mer IRR and 50-mer
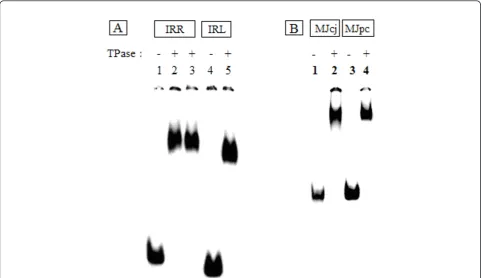
Figure 3Protein-DNA complexes visualized by gel retardation assays run on 5% polyacrylamide gels. For each lane, 80 nM of partially
purified IS2OrfAB-GFP was reacted with 2 nM32P-labeled annealed oligonucleotides containing cognate DNA sequences from IRR, IRL, or the minicircle junction substrates MJcj and MJpc. The reactions were incubated at room temperature (20°C) for 30 min, loaded onto the gel at 4°C and run at 120 mA.(A)Lanes 1 to 3: 87-mer IRR; 4 to 5: 79-mer IRL. Different preparations of the protein were used in lanes 2 and 3. The gel was run for 1400 Vhr.(B)Lanes 1 and 2: 114-mer MJcj; 3 and 4: MJpc. The gel was run for 920 Vhr. IRR/IRL: right and left inverted repeats; MJcj: covalently joined minicircle junction substrate; MJpc: precleaved minicircle junction substrate.
Lewiset al.Mobile DNA2012,3:1
http://www.mobilednajournal.com/content/3/1/1
IRR substrates, generated the 95 nucleotide and 114 nucleotide high molecular weight recombination pro-ducts predicted for paired-ends complexes formed by a chemically active protein activated with Mg2+ (Addi-tional file 1). This latter result and footprinting data from complexes formed with the MCJ substrates in which both ends are protected along their lengths, indi-cate that fully formed complexes are generated by the OrfAB-GFP protein and that paired-ends complexes composed of at least dimers are being formed. For foot-printing reactions, the protein-DNA complexes, initially visualized in the gel retardation assays shown in Figure 3A, were formed in solution and subjected to cleavage reac-tions at room temperature (20°C) prior to fractionation on 8% polyacrylamide sequencing gels.
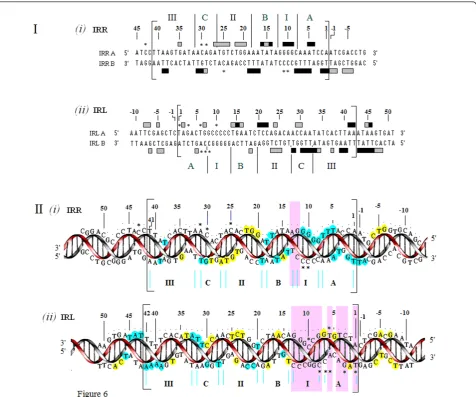
Sequencing gel data of each of the strands of IRR and IRL, composed of three side-by-side lanes showing the guanine and adenine (G+A) Maxam-Gilbert sequencing reactions, the cleaved unbound (free) DNA and the cleaved bound (footprinted) DNA, are shown in Addi-tional file 2. Comparative densitometer tracings from sequencing gels of the footprinted and free DNA lanes for the top and bottom strands of the IRR substrate are shown in Figure 4A, B. Similar results for the IRL sub-strate are shown in Figure 5A, B. The most consistent protection patterns, based on the gel data and the densit-ometer tracings, are summarized below the panels. The protection patterns for the double-stranded molecules are summarized in Figure 6I, II. Numbering of the bases in all figures starts at the outside ends of IRR and IRL and proceeds to the inside ends. The amount of DNA in the bands in the footprinted reactions in all of these experiments is a reflection of the extreme efficiency of the binding of the DNA by the protein (Figure 3). Data summarized in Figure 6 indicate that an 11 bp sequence at the outside end of IRR that makes up the cleavage domain (the A and I elements) is strongly pro-tected by the transposase. Strong protection is also observed for the B element at the outside end of the PBD of IRR, although a gap at base pairs 12 and 13 separates the IRR cleavage domain from the BIRR(Figure 6II, i). Extensive but weaker interactions are associated with ele-ments at the inside terminus of the end. On the other hand, the first 11 bp of the IRL CD (elements A and I) are only intermittently contacted by the protein (Figure 5), at positions 2, 5 and 7, the same residues shown from earlier mutation studies to affect the accuracy of the join-ing reaction. In addition, in BIRL, the residues are more weakly bound than those of BIRR(summarized schemati-cally in Figure 6II, ii). Thus, the cleavage domain of IRL is not extensively protected by the transposase in Step I. We refer to the intermittent binding of the IRL CD as selective binding, which describes the interaction of the protein with a few residues of the sequence of the
recipient end in order to ensure the accuracy of the join-ing reaction. These results support conclusions reached from earlier mutational studies [24] that AIRRand BIRR are important binding targets in IRR for the TPase, that BIRLwould be bound with lower affinity, that AIRLwould not be the subject of sequence-specific binding and that its residues 2, 5 and 7 might have a unique type of inter-action with the TPase.
The different bipartite footprinting patterns of the single IRR and IRL ends are related to their functions in the Step I transpososome
Our results provide physical confirmation of earlier genetic data that the functionally bipartite ends are com-posed of an outer 11 bp cleavage domain and an inner protein binding domain [24]. We conclude that the strong protection of the CD of IRR, likely protected at two major grooves (Figure 6II, i), results from sequence-specific binding by the catalytic center of the protein and propose that it creates a stable complex which enables accurate cleavage of the donor end to take place. We arrive at this conclusion by taking into account the recent results of mutations in the catalytic center of the transpo-sase, in which alteration of three residues in the beta strands and alpha helices of the CC generated partially dissociated complexes in electrophoretic mobility shift assays (EMSAs). This suggested that a loss of affinity of this part of the protein for the DNA substrate had occurred. Similar mutant phenotypes were also observed for mutations in the binding domain of the protein, indi-cative of two distinct but interdependent binding capabil-ities of the protein [31].
We propose that in both IRR and IRL, the B elements, which are also bound extensively at major grooves, together with the II elements comprise the major targets of the BD of OrfAB (Figure 6II). This is not unlike the situation in IS911[26] and IS30[37]. In the former, theb domain of the ends was specifically bound and protected by a truncated N-terminal fragment of the transposase, whereas in IS30the central region of the ends was pro-tected by a similarly truncated derivative. In IRL of IS2, binding of BIRLis weaker than that of BIRR, a result that is supported by data from earlier mutation studies which showed the inability of BIRLto maintain normal levels of donor activity in an IRR end [24]. This weaker protection pattern may be related to the need to allow the tip of IRL (that is, the CD) to be bent (see below).
Figure 4Hydroxyl radical footprinting of the top (IRRA) and bottom (IRRB) strands of the IS2IRR.(A)Quantitative analysis panel, with tracings (derived from the color-coded gels immediately below the panel) showing relative intensities of bands from the footprinted, cleaved, bound top strand of IRR, (IRRA-red tracing) and the control, cleaved, unbound, free DNA, (green tracing). The protection profile is shown as horizontal bars within the panel identifying troughs of weakly (grey) and strongly (black) protected residues that are significantly below the green control. Determination of strong and weak protection was based on the combined analysis of visual evidence of a band and the absence or presence of peaks within the troughs. Visual absence of a band coupled with absence, or only a suggestion, of a peak defined strong protection. A faint band which showed a small peak within a trough defined weak protection. Bands and peaks are numbered (1 to 41) from the outer (3’) end of IRRA to the inner end. Individual peaks are identified by dots and numbered vertical lines identify the nature of every fifth base. Asterisks identify enhanced residues whose red peaks rise significantly above those of the green control. The sequence of IRRA, shown below the panel was used to annotate the peaks in the upper panel and the bands in the color coded lanes. Nucleotides are numbered as described above. The IRR sequence within the large brackets, is flanked by host DNA at the outer (3’) end of the terminus (-1 to -9) and the sequence of IS2adjacent to the inner end of the terminus (42 to 45).(B)Quantitative analysis panel showing relative intensities of bands from the footprinted IRRB DNA (red) and the control DNA (green) derived from the gels shown immediately below the panel as described in part (a). IRR: right inverted repeat.
Lewiset al.Mobile DNA2012,3:1
http://www.mobilednajournal.com/content/3/1/1
to direct the CD away from acisinteraction with its cog-nate CC by bending the DNA to facilitate bindingin trans at the active CC, while simultaneously determining the accuracy of the joining reaction. An additional aspect of the data in Figure 6 appears to support this idea. The clea-vage domain of IRL shows a relatively high frequency of enhanced residues (six of the eleven positions), compared
to its PBD. This suggests that the IRL CD in SC I is dis-torted because it may need to be bent by the protein. It is interesting that in both substrates L79 (residues 1,3,6,7,8 and 10) and R87 (residues 9 and 10), the enhanced resi-dues are associated with a series of base pairs comprising a guanine/cytosine-rich tract within the CDs (positions 7 to 13 in IRL and 8 to 12 in IRR; Figure 6), a sequence
Figure 6Summary of footprinting patterns of the double-stranded right and left ends of IS2.(I)Double-stranded sequences of IRR and
IRL are shown within the large brackets, numbered from the outside ends to inside ends as described in Figure 4. Protected nucleotides, strong (black) and weak (grey), (as described in Figure 4) are indicated by filled horizontal bars. Enhanced nucleotides are indicated by asterisks. Conserved and non-conserved elements are as described in Figure 1.(II)Three-dimensional representations of the protection patterns shown in part I. For IRR, the red helix represents the lower strand (IRRB- 5’TGGATT... TTAA3’) and the gray helix, the upper strand (IRRA- 5’TTAA... AATCCA3’). For IRL the red helix represents the upper strand (IRLA - 5’TAG... TTAA3’) and the grey helix the lower strand (IRLB- 5’TTAA... CTA3’). Strong and weak protections are shown as filled blue and yellow circles, respectively. Vertical purple shaded bars highlight the difference between the selective binding of the cleavage domain of IRL, illustrated by intermittent binding of three of the eleven nucleotides and the extensive protection of the cleavage domain of IRR with a single gap at its inner end (see text). Annotation is as described in part I. In both parts, numbering is as described in Figure 4. The inside terminus of IRL shows protection of the sequence numbered 39 to 48 that includes the proposed binding sequence for the repressor function of the OrfA protein [20]. The 5’TGAT3’sequence of base pairs 48 to 51 represents the first four bases of the weak indigenous extended-10 promoter (PIRL, see Figure 1) located adjacent to the inner end of IRL. IRR/IRL: right and left inverted repeats.
Lewiset al.Mobile DNA2012,3:1
http://www.mobilednajournal.com/content/3/1/1
which facilitates bending of the DNA [38,39]. In support of this idea are results from an IS2derivative with multiple transversion mutations at positions 8 to 12 of IRL (IIRL), in which minicircle formation was completely abolished [24], although current results do not show protection of these residues by the protein.
We interpret these data as suggesting that the IRL CD is positionedin trans and juxtaposed to the active CC occupied by thecis-bound IRR CD, in a tract which is probably that used for non-specific binding to the host DNA. The importance of non-specific and/or selective binding of the adjacent host DNA by the protein receives support from our earlier studies, which indicated that the nature of the host DNA flanking the recipient end can play a role in determining MCJ spacer size [24], as well as from a more recent report of the binding efficiency of a truncated version of the IS911OrfAB (residues 1 to 149). This derivative bound much less efficiently to a 36 bp substrate containing only the IRR sequence than to a longer 100 bp substrate, due, they proposed, to the non-specific binding capability of the transposase [27]. This interpretation of the architecture of the IS2 SC I is further supported by data from studies in which mutated IS2derivatives with two left ends produced no minicir-cles [24]. When complexes are formedin vitrowith only DNA of the left end, several factors would then work against either IRL functioning as a donor (that is, bound
in cisat its cognate CC): selective rather than extensive binding of their CDs; the non-specific and/or selective binding of adjacent host DNA; their longer length (one bp) than donor IRRs; the reduced affinity of the TPase for the adjacent BIRLelement; and the tendency of the CDs to be bent by the protein. These factors would pre-vent minicircle formation and therefore define the iden-tity of the recipient end in the wild type element.
In elements with two right ends, however, both func-tion as donors with equal probability and produce mini-circles in which approximately 90% of the MCJs have interstitial sequences of 2 bp to 3 bp. This would not be the case if both donor CDs were complexed in cis at their cognate CCs (Figure 2A) when the majority of minicircles would have 5 bp interstitial sequences. In complexes formed with two right ends, the CD of one end is bound in cis and that of the other bound in
trans, both at a single active CC. Bindingin transwould be facilitated by the non-specific and/or selective bind-ing of the adjacent host DNA coupled with the bendbind-ing of the CD by the protein as indicated by enhancements at residues 9 and 10.
Different conformational states define the protein-DNA interactions of IRR and IRL not only at their outside ends but also at their inside ends, primarily due to the different functions of the ends. At the inside ends of IRR and IRL, different protection patterns involve the two most distal
elements (C and III) of the PBD (Figure 6). The stronger protection pattern in elements CIRLand IIIIRLis a manifes-tation of the location of the docking site, 5’TAAATAA3’, for the repressor function of OrfA, (Figure 1C, ii; [20,40]). The transposase bound to IRL (Figure 5) shows strong protection of the last 4 bp at the inside end of IRL, T/A, T/A, A/T, A/T (residues 39 to 42 of element III), and the 6 bp sequence A/T, T/A, A/T, A/T, G/C, T/A (residues 43 to 48) located immediately adjacent to the inside end and just upstream of PIRL, the extended-10 promoter [10].
These two sequences together appear to form a 10 bp sequence which includes the site to which the 14 kDa OrfA binds competitively in carrying out its repressor function. It is interesting that the truncated 17 kDa deriva-tive of the IS30TPase (the structural equivalent of OrfA) has also been shown to overlap the promoter region, likely repressing transcription [37], but that OrfA in IS911does not have this function. Instead, it has been shown to mod-ify the stoichiometry of complexes formed with the 1-149 truncated forms of OrfAB [26]. In addition, in IS911OrfA is involved with both heteromultimerization with OrfAB [41], as well as with its own homomultimerization and with the ability to stimulate minicircle insertionin vitro into target DNA not associated with the IS911 ends [28]. It is likely that these heteromultimers may also exist in our preparations, which consist of a mixture of OrfA and OrfAB [31]. Speculatively, in IS2, the three-dimensional configuration of OrfAB could allow the BD of the protein to target the B and II elements in the PBD, whereas (as a regulatory mechanism) the BD in OrfA, with a slightly dif-ferent configuration, would target the promoter.
Three previous studies have reported footprinting ana-lyses of the IS3family and related elements that hint at the bipartite nature of the ends. Earlier, Huet al. [23], using cell-free extracts of the IS2Tpase, reportedin situ 1, 10 phenanthroline-copper ion footprinting data for the bottom strand of the right end (5’-TGG... TTAA-3’) and the top strand of the left end (5’-TAG.... TTAA-3’) of IS2. They showed essentially identical patterns of protec-tion of residues 16 to 41 in the case of IRR and 16 to 42 in the case of IRL with additional protection of residue 43 in the former and protection of residues 43 to 46 in the latter. They reported no binding to the outer base pairs, 1 to 15, for either end, due perhaps to the preva-lence of truncated N-terminal species in the preparation of the protein [26] or to the imprecise folding of the C-terminus, a process which appears to have been avoided in our GFP-tagged version [31].
Normand et al. [26] reported DNase I and Cu(OP)2
deletion-gel retardation analyses of the ends of IS911 showed that they are composed of three conserved blocks of residuesa,band g;bandgcomprise the PBD of IRR and IRL whereas thea motif comprises the CD. Footprinting experiments with both IRR and IRL showed that the truncated OrfAB bound efficiently in an extensive manner to the PBDs of the ends. Finally, DNase I footprinting experiments with the 17 kDa N-terminal derivative of the IS30 Tpase containing only the BD of the protein, showed binding to the central region of an inner, presumed PBD, leaving the outer ter-mini of both right and left ends unprotected [37].
The bipartite nature of the ends of transposable ele-ments has been well documented by mutational analysis and DNA footprinting studies. The two domains, origin-ally identified through mutational studies in IS903[42], IS50 (Tn5) [43,44] and IS10 [45], were subsequently shown in early DNA footprinting studies to be a unique inner binding sequence for the transposase and an outer unbound sequence assigned to post binding cleavage functions. This was shown to be true for simple insertion sequences IS30[37], IS1[46], IS903[47], IS50[48] and IS911[26] as well as for the more complex transposons, Tn3[49-51] and Mu [52,53]. Binding to both domains, however, was shown to occur in fully formed SCs in Mu [54-56] and in IS50[36]. We conclude from these ana-lyses that the bipartite binding pattern exhibited in IS2 protein/DNA complexes is the result of a fully formed Step I SC.
Footprinting results in SC I correlate well with those of previous mutational analyses of the PBD of the single IRL end
An earlier mutational analysis of the IRL sequence indi-cated that, while residues 12 to 19 (primarily the B ele-ment) played an important role in protein recognition, an anchoring sequence for the transposase was also located at residues 20 to 42 (elements II, C and III; [24]). In general, the footprinting data (Figure 6) support these conclusions. We assessed the effect of seven single base deletion muta-tions on the efficiency of minicircle formation and found that there is a good correlation with current binding effi-ciency data. Deletion of base pairs at positions 13, 19, 21 and 36 had no effect on minicircle efficiency. In these foot-printing studies, only position 21 was protected by the protein. Deletions of base pairs at positions 14, 26 and 29 eliminated minicircle formation and only residue 26 was not protected by the protein.
Footprinting the IS2MCJ
In Step II of the IS2transposition pathway, donor func-tion of each of the abutted ends at the MCJ is a prere-quisite for insertion of the element into the target sequence. In an earlier model [10,24], we proposed for
the sake of simplicity that the complex involved a dimer of transposase molecules with the PBD of each end bound at its own monomer. Initial cleavage of the abutted CDs of the MCJ would occur at the 3’ end of the IRR CD, boundin cis at its cognate CC (a first tran-sition state). As a result of a conformational change the partially cleaved junction would be relocated to permit
cis-binding of the IRL CD at its cognate CC (a second transition state). There, cleavage at its 3’ terminus would occur, permitting the reacquisition ofcisbinding by the IRR CD.
To test these ideas, we asked here whether a covalently joined MCJ (substrate MJcj) and a precleaved MCJ (sub-strate MJpc) would produce different SC II footprinting patterns for the IRR and IRL CDs. The covalently joined MCJ was prepared from two annealed 114 nucleotide oli-gomers (substrate MJcj in the Methods section) contain-ing an 84 bp sequence of the abutted right and left ends separated by a single guanine/cytosine base pair. For footprinting experiments, the bottom strand (3’to 5’) was labeled at its 3’end with alpha32P-labelled di-deoxy ade-nosine triphosphate ([a32P] ddATP). Substrate MJpc (see the Methods section) containing the precleaved MCJ was prepared using a bottom strand identical to that in the MJcj substrate and labeled as described above. The top strand consisted of two oligomers; at the 5’end was a 56 nucleotide oligonucleotide, containing the 41 nucleotide donor strand of IRR ending in its CA-3’terminal dinu-cleotide. The second component was a 58 nucleotide oli-gonucleotide containing the 42 nucleotide strand of IRL, with a single nucleotide (C) at its 5’end representing the spacer base between the two abutted ends. The result of the annealing reaction was a double-stranded MCJ with a one base pair spacer, nicked at the CA-3’terminus of the IRR CD. Very efficient binding of the protein to both substrates was observed in EMSA gels (Figure 3B). The slight difference in the running patterns of the two com-plexes may be attributed to the differences in the struc-ture of the two substrates.
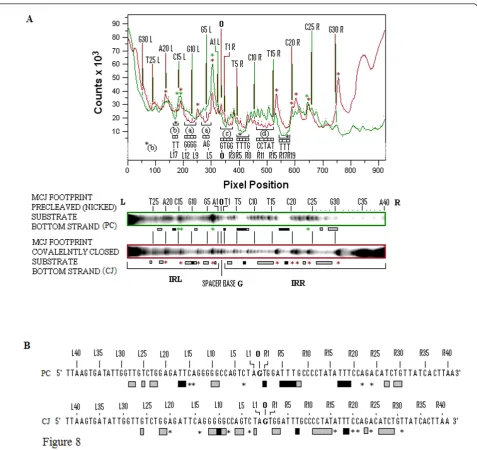
Footprinting patterns for the bottom strands of the two 114 nucleotide MCJ substrates are shown in Figure 7A. Side-by-side lanes of the G+A Maxam-Gilbert reactions, the two cleaved unbound controls and the footprinted covalently closed and precleaved substrates, are shown. Each bottom strand is numbered as R1 to R41 and L1 to L42 reading from the abutted ends outwards. The spacer base guanine is numbered as zero. A larger, higher con-trast version of the same gel which accentuates the pro-tected residues is shown in Figure 7B. Comparative densitometer tracings for the precleaved and covalently joined MCJ substrates from the gel in Figure 7 are shown in Figure 8A their protection patterns are described in Figure 8B. Because of the length of these substrates, data for the nine bases at the inside ends of IRR and IRL (that
Lewiset al.Mobile DNA2012,3:1
http://www.mobilednajournal.com/content/3/1/1
Figure 8Quantitative comparisons of the protection patterns of the bottom strands of MJcj and MJpc substrates.(A)The top panel shows densitometer tracings of the two footprinted lanes (MJcj, red, and MJpc, green) of the sequencing gel shown in Figure 7b. The similarly color-coded boxed lanes are shown immediately below the panel. Tracings show differences in the intensities of bands from the two substrates. Annotation within the panel is based on the sequence of the bottom strand with numbering as described in Figure 7. Individual peaks in the top panel are identified by red dots for the covalently joined substrate and green dots for the nicked substrate; corresponding red and green vertical lines identify the nature and number of every fifth base. Differences in the protection patterns of the two substrates are indicated by brackets (within which the protected residues are identified) immediately beneath the troughs. Labels (a), (c) and (d) are as described in Figure 7. Brackets labeled with a black asterisk or (b) indicate sequences that are more strongly protected in MJpc than in MJcj. Enhanced residues in the two substrates are shown by sharply rising peaks and are identified by the eight red asterisks for the MJcj substrate and the four green asterisks for the MJpc substrate.(B)Consensus of the protection patterns of the bottom strand of the MJcj and MJpc substrates are derived from the data in Figures 7A, B and Figure 8A. Numbering and annotations are as described in Figure 7. Asterisks identify enhanced residues. MJcj: covalently joined minicircle junction substrate; MJpc: precleaved minicircle junction substrate.
Lewiset al.Mobile DNA2012,3:1
http://www.mobilednajournal.com/content/3/1/1
is, resides 33 to 42) were difficult to ascertain and are excluded from this analysis.
CDs in the MJcj substrate are complexed to the same catalytic center followed by a cleavage-triggered conformational change
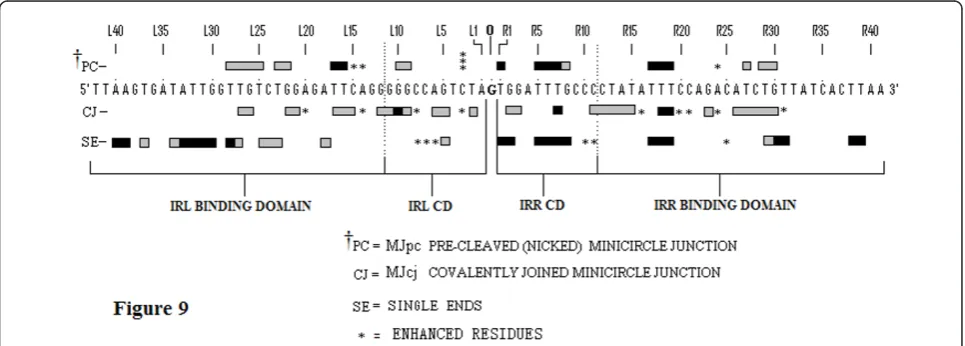
Several features help compare and contrast the protec-tion patterns of the covalently joined and precleaved substrates. We can also contrast these with the protec-tion patterns of the single-end substrates. Comparative schematic representations of the protection patterns of the bottom strands of the four substrates, that is, the two single-end substrates and the two MCJ substrates, are shown in Figure 9. First, some residues within two short sequences (R1 to 3 and 5 to 8) in the bottom strand of the IRR CD are protected in all three sub-strates (compare residues R1 to R8 in Figure 9). The similarity of protection patterns is particularly true for the MJpc and single-end substrates. The lower affinity for the residues in the MJcj IRR CD may be a conse-quence of the need to accommodate binding and clea-vage of the IRL CD post-IRR cleaclea-vage at the same active CC, implying that cleavages are sequential and that the cleavage of IRL occursin trans. We thus conclude that the IRR CD is bound in cis at its cognate CC in all three substrates (Figure 10A, B).
Secondly, in the MJcj substrate, the CDs of both IRL and IRR are protected in a similar manner by the protein (compare L2, L5, L6 and L9 to 11 with R2, R3, R7 and R11 in Figure 9 and 7B, lane 3). This result suggests that the CD of IRL in the MJcj substrate is extensively bound
at the same CC as the IRR CD. Since the two CDs in the IS2 MJcj substrate are separated by a single base pair, their observed extensive protection (summarized in Figure 9) should result from initial binding of both CDs (the IRLin transand the IRRin cis) at a single active CC (Figure 10B). This represents the first phase of the SC II complex in IS2. A similar scenario may apply to IS21 [29], IS1665[30] and IS256in Tn4001[28].
Thirdly, the MJpc substrate shows evidence of disen-gagement of the IRL CD from the TPase (Figure 9). In the covalently joined substrate, three sets of residues within the IRL CD are bound moderately tightly (L2 (T), L5 and L6 (GA) and L9 to L12 (GGGG)); of these, only two residues (L9 and L10) are protected in the pre-cleaved substrate (see also the protection patterns labeled (a) in Figures 7B and 8A). This is not the case for the IRR CD where binding is even more extensive than in the MJcj. Based on two lines of evidence, we conclude that the partially cleaved junction is not posi-tioned at the IRL CC after right end cleavage, as sug-gested in our original hypothesis. First, the apparent disengagement of the IRL CD suggests that it is not bound extensively at its cognate CC. Secondly, the IRR CD in the precleaved substrate remains bound at its cognate CC as judged by the similarity of its protection pattern to that of the single-end substrate. We propose then, that the protection patterns observed for the MJpc substrate represent those of a temporary (and artifac-tual) transition state and that complete disengagement of the IRL CD would follow the two sequential single-strand cleavages at the IRR CC (Figure 10B). After a
Figure 9Comparisons of protection patterns of the bottom strands of the single-end, MJcj and MJpc substrates. The sequence shown
conformational change, re-engagement of the IRL CD at a new site, its cognate CC, would then occur to produce a second complex in SC II (Figure 10C).
There is additional evidence for this temporary transi-tion state. Two differences within the CDs of the two MCJ substrates at residues R1 (T) and R5 to R8 (TTTC) make the profile of the IRR CD in the MJpc substrate almost identical to that of the single-end substrate (Figure 9; see also the gel in Figure 7B, lane 4, protection patterns labeled (b) and (c)). Also, there are subtle differences in the protection patterns of the IRR PBD in the two MCJ substrates; residues R11 to R15, which are protected in the MJcj substrate, are disengaged in the MJpc substrate (Fig-ure 7B, compare lanes 3 and 4, protection patterns labeled (d)), again making its protection pattern almost entirely like that of the single-end substrate (Figure 9). We note
that major changes in protection patterns do not affect the PBDs. There is a basic similarity but not identity in the protection patterns within the PBDs IRR (R17 to R19 and R26 to R31) and IRL (L15 to L18 and L21 to L28) in each of the three substrates (Figure 9).
It is now well understood that the process of transposi-tional recombination is controlled by a series of confor-mational changes within the transpososome that drive the process forward unidirectionally. These may be trig-gered by cleavages [57], host proteins [58], divalent cations [59], the role of terminal cognate nucleotides [60] and associated transposition proteins [61]. It appears here that sequential cleavages at the abutted IRR and IRL CDs of the first phase in the SC II transpososome of IS2 would provoke the conformational change that is required for the establishment of the second phase that is
* *
IRR
Active IRR C&
IRL C&
IRL
(A) (B) (C)
SC I
SC II
BS
BS
* *
*
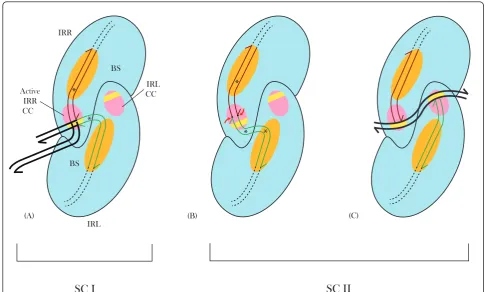
Figure 10Schematic model for the IS2transposition pathway. Each synaptic complex is shown as a dimer with a DNA binding site (BS;
orange) to which protein binding domains (PBD) of the right and left inverted repeats (IRR, red and IRL, green) are bound, and a catalytic center (CC; pink). Each CC possesses a binding tract (orientation I), for the extensive sequence-specific binding of the cleavage domain (CD) and a tract (yellow band; orientation II), at which target or host DNA may be complexed selectively and/or non-specifically.(A)Synaptic Complex I. The CD of IRR is bound in orientation Iin cisat its cognate active CC. The IRL CD is bent (asterisk) and complexed at the active CCin transin orientation II, with adjacent host DNA (bold black lines). The 3’OH tip of the cleaved IRR CD is positioned at a 3’5’phosphodiester bond between the first and second residues of the host DNA near the 5’end of the tip of IRL. Broken black lines represent the coding sequence of IS2.(B)Synaptic Complex II- first phase. Abutted CDs of the MCJ separated by a single base pair spacer (bold black dot), are bound in orientation I at the active IRR CC.Transbinding of the IRL CD is facilitated by two bends (asterisks), within the CD and at the outer end of the PBD. Red arrows identify sequential single-strand cleavages at the 3’ends of the CDs.(C)Synaptic Complex II- second phase. The CD of IRL, free from flanking DNA, binds to its cognate CC in orientation I. Exposed 3’OH groups at the ends of both CDs (half arrows) are juxtaposed to the target DNA, non-specifically bound (curved bold black lines) in the orientation II tracts of the CCs. BS: binding site; CC: catalytic center; CD: cleavage domain; IRR/ IRL: right and left inverted repeats; MCJ: minicircle junction; PBD: protein binding domain.
Lewiset al.Mobile DNA2012,3:1
http://www.mobilednajournal.com/content/3/1/1
needed for final strand transfer reactions into the target DNA.
The sequence of the IRL CD has evolved to permit selective binding in SC I without compromising extensive sequence-specific binding in SC II
In earlier studies we proposed that the non-conserved base pairs in IRL were necessary for efficient recipient end function and were sufficient to prevent binding of the CDin cis to its cognate active site in SC I, without compromising binding proficiency in SC II [24]. Foot-printing data for the MJcj substrate support these sup-positions. Six of the eleven residues within IRL CD in the bottom strand of the MJcj substrate are bound by the protein. The non-conserved residues at positions L2 and L5 are protected, as is the run of guanines at posi-tions L9 (non-conserved) to L12 (Figure 9). Protection of this guanine/cytosine run is characteristic of strong extensive binding in the single-end IRR substrate and is not observed in the single-end IRL substrate (Figure 6). Thus, two of the three residues in the IRL CD that are involved in selective binding in SC I, are also utilized in extensive sequence-specific binding in SC II. It seems likely that this extensive sequence-specific binding of the IRL CD in the MJcj substrate results partially from its proximity to the extensively bound IRR CD. In addition, given the proximity of selective binding of the IRL CD and the non-specific and/or selective binding of the adjacent host DNA in the L79 single-end substrate (Figure 6), we propose that the nature of (or the absence of) the DNA adjacent to the cleavage domain of IRL plays a decisive role in determining whether it is involved in selective binding or extensive sequence-specific binding.
Evidence for bending of the DNA in MCJ and single-end substrates from footprinting data is corroborated by curvature propensity plot data from the MJcj sequence
The differences in the protection patterns of the MJcj and MJpc may be due to perturbation, generated as sug-gested above by the binding of both CDs at a single active site. Perturbation in the MJcj substrate is indicated by the presence of five enhanced residues in the PBD of IRR and four enhanced residues in the CD and the PBD of IRL. In contrast, in the MJpc substrate, only a single residue (R24) is enhanced in the PBD of IRR (Figure 9; see also Figure 7B, lanes 3 and 4 and Figure 8), suggesting not only that perturbation of the IRR DNA is relieved follow-ing cleavage but that the remainfollow-ing enhanced R24 resi-due in both substrates is indicative of intrinsic bending at that site. In addition, the location of the enhanced region within the PBD of the IRR single end substrate (see resi-dues R25 and R29 to R30; Figure 6) is similar to that in the two MCJ substrates (see residue R24; Figure 9), sug-gesting a single bend in IRR DNA in all three substrates.
In a similar vein, enhanced residues in IRL are observed at two identical locations in the MJcj and MJpc sub-strates, that is, residue L3 in the CD and L14 at the outer end of the PBD (Figures 8 and 9). An enhanced residue is also observed at L15 in MJpc. In addition the enhanced region in the CD of the IRL single-end substrate (see residues L1, L3, L6 to L8 and L10; Figure 6) is in the same location in the MCJ substrates (see residues L3 and L8; Figure 9), suggesting that the tip of IRL is bent in all three substrates to accommodate bindingin transto its CD at the active IRR CC as illustrated in Figure 10A, B. Thus the presence of enhanced residues that are at com-mon or near comcom-mon locations in the single end, MJcj and MJpc substrates may be indicative of bending at intrinsically bent sites (see below).
The observation that these sequences, which are con-sistently bent at approximately the same positions in SC I and SC II, occur at regions associated with guanine/cyto-sine-rich tracts in the CDs prompted us to evaluate their intrinsic curvature (that is, the permanent or time-aver-aged deflexion of the DNA axis when no external force is applied) by analyzing the abutted terminal repeats of IS2 with the bend.it server (see Methods). The purpose of using this tool was to evaluate whether regions are inher-ently curved during the interactions between CDs within the SC II complex. According to the curvature propensity plot obtained (Figure 11A (i)), three strong maxima are evident in the IRR and IRL regions of the MJcj sequence: two in the PBDs (R25, L25) and one in the IRL CD (L6). In addition, a weak maximum is observed in the IRR cleavage domain at R9. With the exception of L25 in the IRL PBD, the remaining positions match or are located close to the enhanced residues in the footprinting gels (compare with Figure 9) but the position of L25 still appears to be related to the enhancement data in the MCJ substrates, in that both sets of data suggest that there is a bend at the outer half of the PBD of IRL. A fifth maximum is also present at L60 which corresponds to the location of the indigenous PIRLpromoter. This is
expected, for promoter sequences are well known to be characterized by intrinsically curved DNA [62,63]. To better understand exactly how this curvature profile translates in terms of DNA architecture, we generated a three-dimensional representation (Figure 11A (ii)) using the same MCJ DNA and obtained an S-like structure which is typical of some regional anisotropic flexibility. As stated above, this seems to result from an overrepre-sentation of guanine/cytosine-rich tracts in the CDs, which, in conjunction with other properly phased sequences, results in a preferential curvature.
Figure 11Curvature analyses for the minicircle junction and IS2target sites.(A)(i) Predicted curvature profiles obtained by the bend.it server for a 200-bp region encompassing the MCJ. Colored regions are: IRR (yellow and red), IRL (blue and yellow), protein binding domains (yellow), cleavage domains (red and blue). Numbered base pairs correspond to the four maxima found in these regions, which also match or are located in close vicinity to enhanced residues. The maximum located at position L60 corresponds to the region harboring the indigenous PIRL promoter. (ii) Three-dimensional representation of the region encompassing the MCJ where the five curvature maxima appear as highlighted bases. The region shaded green represents the intrinsic curvature of the PIRLpromoter.(B)Predicted curvature profiles of four representative regions reported in the literature to harbor IS2target sites. Each window represents a 200-bp fragment encompassing the target site(s) (filled circles). Regions R1 to R4 were arbitrarily chosen in order to facilitate the comparison between graphs. Although some disparity exists when comparing the relative intensity of the peaks (which results from comparing different DNA sequences), all four regions appear to be conserved. Coding references or nucleotide sequences given in brackets are in accordance with the nomenclature given in the original publication. Additional predicted curvature profiles are shown in Additional file 3.(C)Three-dimensional representations of the four regions encompassing IS2target sites (highlighted in green). S-like (and L-like) shaped regions were preferentially obtained and intrinsic curvature was observed to occur next to the insertion site. Additional data on the three-dimensional representation of IS2target sites can be found as Additional file 4. bp: base pair; IRR/IRL: right and left inverted repeats; MCJ: minicircle junction.
Lewiset al.Mobile DNA2012,3:1
http://www.mobilednajournal.com/content/3/1/1
promoter within the MCJ sequence. Since the curvature maxima at L6 and R25 correspond to enhancements in both the single-end substrates and the MCJ substrates as described above, we interpret the enhancements in the L79 (IRL) substrate as the result of bending to accommodate binding of both IRL CDsin transin SC I (see the bend in IRL in Figure 10A) and in the MJcj substrate as bending to accommodate binding of the abutted CDs of the MCJ to a single CC in SC II (Figure 10B); indeed, observed perturbations of the DNA in the footprinted gels of the MJcj and MJpc substrates or of the single ends may result from the DNA being bent by the protein in the same direction as the intrinsic sequence-dependent curvature [64]. We note that there is no enhancement of the residues in the PBD of the L79 (IRL) single-end substrate corresponding to the L25 maximum of the MCJ sequence (see below). In addition, the weak curvature maximum at R9 in the MJcj sequence is probably a relic of the type of IRR CD to CD interaction described earlier, for elements with two right ends. Thus the intrinsic curvature data not only corroborate the footprinting data but also support the idea that interaction of the CDs at a single active CC requires the adoption of a bent structure.
Intrinsic curvature of IS2target sites
Because binding of the IRL CDin transat the active CC within SC I and SC II seems to require the DNA to adopt a bent structure, we wondered whether IS2target sites could also be structurally constrained. Therefore we decided to look at the predicted curvature of 200 bp-sized sequences from several IS2target sites reported in the literature. A representative sample of these is shown in Figure 11B (the remaining curvature profiles are pre-sented in Additional file 3). An interesting feature of the data is a consistent periodic behavior of the predicted curvature of sequences flanking the target sites. Subse-quent analysis led to the division of the target sites into four regions (R1 to R4), a profile which was roughly simi-lar in all of the DNA sequences examined. R1 holds a local minimum in predicted curvature, R2 a local maxi-mum harboring a shoulder peak that sometimes appears as two well resolved peaks and regions, and R3 and R4 hold a local minimum and maximum respectively. IS2 insertion sites (black dots) mapped preferentially within the sub-sequences of R2 with a mean curvature of 4.4 ± 1.9 degrees per 10.5 bp helical turn. It is thus tempting to assume that the choice of insertion site might depend on DNA curvature at the target with the decision for inte-gration based on subsequences of R2 having a certain range of curvature values. This similarity between curva-ture profiles is reflected in the three-dimensional struc-ture of each region (Figure 11C) where an S-like (and sometimes L-like) structure is preferentially adopted. IS2
insertion sites were found to be located between two bent regions ([65,66]; Figure 11C, i, ii) or alternatively exactly at a bent region ([67,68]; Figure 11C, iii, iv). Addi-tional three-dimensional representations of the curvature profiles are also presented in Additional file 4.
A model for the two-step transposition pathway of IS2; CD to CD interactions require that IRL adopt a bent structure in SC I and SC II
We describe here a refined version of our model for SC I and SC II [24]. For SC I, single bends of the IRR PBD and of the IRL CD are required to synapse the CDs in two different orientations, I and II respectively, at the single active CC as illustrated in Figure 10A. For the first phase of the SC II complex, binding of the two CDs separated by a single base pair suggest that the CDs are complexed in orientation I at the active IRR CC. Two bends of IRL, at the CD and the outer end of the PBD and a single bend of the IRR PBD are needed to achieve this binding arrangement (Figure 10B), where sequential cleavage reactions would occur to generate the second phase of the complex (Figure 10C).
Intrinsic curvature data have indicated that both MCJ DNA and target sites adopt bent structures that apparently share identical profiles (compare Figure 11A (i) and 11B). Given the large number of target sites analyzed (Addi-tional file 4), it is tempting to assume that curving propen-sity might play some role in target site selection although it is not clear how and to what extent this would affect the mechanics of transposition. A similar dependence between transposition and target curvature has been shown to exist for IS231[38], where target sites contain alternate gua-nine/cytosine- and adenine/thymine-rich tracts that pro-mote bending in opposite directions of the regions flanking the consensus target sequence. In a more recent example, Koboriet al. [69] reported a target site for the spontaneous insertion of IS10located within an intrinsi-cally bent DNA region of the commonly used vector pUC19. Likewise, we observe from Figure 11C that IS2 preferentially inserts in the close vicinity of curved regions or specifically at a bent region. This concept has been incorporated into the model of the second phase of the SC II complex, where curved target DNA is now bound non-specifically across each CC permitting strand transfer to the target by each donor end (Figure 10C).
Methods
Bacterial strains and media
of pLL2522, the plasmid with the fused orfAB and
GFPuvgenes.
Cultures were routinely grown in lysogeny broth media at 37°C, supplemented where necessary with car-benicillin (Cb, 50μg/mL) or chloramphenicol (Cm, 20
μg/mL). For the overexpression of the fusedorfAB::GFP genes in plasmid pLL2522, cultures were grown at 28°C in a 2× yeast extract and tryptone (2 × YT) medium supplemented with Cm, Cb and arabinose (6 mg/mL).
DNA procedures
DNA procedures were essentially as described earlier [10,11,24].
Plasmid constructs
pLL2522, which contained the fused orfABand GFPuv genes, has been described in detail previously [31].
Preparation of the OrfAB-GFP fusion protein under native conditions
Plasmid pLL2522 was transformed into BL21(DE3)pLysS cells (Stratagene Inc.). Single colonies were inoculated into 40.0 mL of 2 × YT medium supplemented with Cm, Cb and arabinose and inoculated in baffled flasks over-night at 28°C. Harvested pellets were checked for bright fluorescence, washed with 3.0 mL Native Wash Buffer (Qiagen, Valencia, CA, USA) and frozen at -70°C for 15 min. Three milliliters of B-PER Protein Extraction Reagent (Thermo Scientific, Pierce Protein Research Pro-ducts, Rockford, IL, USA), supplemented with 4.0μL of Benzonase (Novagen-EMD4Biosciences, La Jolla, CA, USA), per 40 mL of overexpressed culture and 3.0 mL Protease Arrest (Calbiochem/EMD La Jolla, CA, USA) per milliliter of lysate was added to the frozen pellet, which was allowed to thaw on ice on a horizontal rotary shaker for 60 min. The lysate was nutated at 4°C for 1 h and subjected to a hard spin at 10,000 ×g for 45 min at 4°C. It was then purified through Ni-NTA His-tag tech-nology. 6 × His-tag purification of the protein was achieved by gravity flow affinity chromatography using Ni-NTA agarose (Qiagen) under native conditions essen-tially following the manufacturer’s instructions. The crude lysate was loaded on to a 1.0 mL bed of the nickel-charged resin in a 5.0 mL column for chromatographic separation followed with UV light. The protein bound as a tight brightly fluorescing band at the top of the column and remained bound through washings with 10 mM to 60 mM imidazole, when a slight dissociation of the band was observed. To circumvent continued dissociation, the band was eluted with 250 mM imidazole and its progress through the column followed. Peak fractions (fluorome-trically determined) were subjected to diagnostic 12% PAGE using acrylamide and bis-acrylamide (Ac:Bis; 30%:8%, respectively) polyacrylamide gels [31]. Fractions
showing both the 74-kDa OrfAB::GFP and the 17-kDa OrfA proteins were pooled (approximately 700μL), con-centrated to about 75μL in a YM-10 Microcon Centrifu-gal Filter Device (Millipore, Billerica, MA, USA), dialyzed overnight in Slide-A-Lyzer cassettes (Thermo Scientific, Pierce Protein Research Products) and stored in 50% gly-cerol at -20°C. The concentration of the fused OrfAB-GFP protein was measured with spectrophotometry at 397 nm and that of the control GFP at 280 nm and 397 nm. Comparative levels of fluorescence of GFP and the fusion proteins were measured with fluorometry and used to confirm the concentration data.
Oligonucleotides used in gel retardation and DNA footprinting experiments
The right single end (IRR) was represented by an 87-bp substrate R87. The IRR sequence is shown between the brackets. Top strands were labeled at the 5’end and bot-tom strands at the 3’end. The top strand (primer A) sequence was as follows: 5’GCTGACTTGACGGGA CGGGGATCC[TTAAGTGATAACAGATGTCTGGAA ATATAGGGGCAAATCCA]ATCGACCTGCAGGCA-TATAAGC3’; the bottom strand (primer B) sequence was as follows: 5’GCTTATATGCCTGCAGGTCGAT[TGGA TTTGCCCCTATATTTCCAGACATCTGTTATCACT-TAA]GGATCCCCGTCCCGTCAAGTCAGC3’.
The left single end (IRL) was represented by the 78-bp substrate L79. The IRL sequence is shown between the brackets. The top strand sequence (primer A) was as fol-lows: 5’ACGCGGAGTGAATTCGAGCTC[TAGACT GGCCCCCTGAATCTCCAGACAACCAATATCACT-TAA]ATAAGTGATAGTCTTA3’; bottom strand (primer B) sequence was as follows: 5’TAAGACTATCACTTAT [TTAAGTGATATTGGTTGTCTGAAGATTCAGGG GGCCAGTCTA]GAGCTCGAATTCCACTCCGCGT3’.
The covalently closed MCJ was represented by the 114-bp substrate, MJcj. The abutted IRR (bold) and IRL sequences, shown in the brackets, are separated by a single base pair guanine/cytosine spacer. The top strand sequence (primer A) was as follows: 5’ GGTACCCGGC-CATGG[ttaagtgataacagatgtctgggaaatataggggcaaatcca]C [TAGACTGGCCCCCTGAATCTCCAGACAACCAA-TATCACTTAA]ATAAGTTATAGTCTT3’; bottom strand (primer B) sequence was as follows: 5’ AAGACTA-TAACTTAT[TTAAGTGATATTGGTTGTCTGGAGA TTCAGGGGGCCAGTCTA]G[
TGGATTTGCCCCTA-TATTTCCAGACATCTGTTATCACTTAA]GGATCCC
CGGGTACC3’.
The precleaved (nicked) MCJ was represented by the 114-bp MJpc substrate. Two oligonucleotides were needed to create the top strand. The first, a 56-mer oli-gonucleotide contained the IRR sequence (bold font) terminated with an A-3’OH at the junction and was labeled at its 5’ end. The sequence for the top strand
Lewiset al.Mobile DNA2012,3:1
http://www.mobilednajournal.com/content/3/1/1
(primer A1) was as follows: 5’GGTACCCGGGGATCC
[TTAAGTGATAACAGATGTCTGGAAATATAGGG
GCAAATCCA]3’.
The second primer, a 58-mer oligonucleotide, termi-nated at its 5’end with a cytosine representing the sin-gle spacer nucleotide. It was labeled at its 5’end. Its sequence (Primer A2) was: 5’ C[TAGACTGGCCCCCT-GAATCTCCAGACAACCAATATCACTTAA] ATAAGTTATAGTCTT3’. The bottom strand was iden-tical to that described for the MJcj substrate.
5’- and 3’- end labeling and annealing of the oligonucleotides
5’-end labeling of the primers:A 20-μL labeling reaction contained 30 units of T4 polynucleotide kinase (New England Biolabs, Ipswich, MA, USA), 2.0μL of 10X T4 polynucleotide kinase reaction buffer, 20μM of the pri-mer, 50μCi of the gamma32P-labeled adenosine tripho-sphate (g32PATP) (6000 Ci/mmole). The reaction was incubated at 37°C for 30 min and heat killed at 90°C for 5 min.
3’-end labeling of the primers: The 50-μL reaction contained 20 units of terminal transferase in 1X reaction buffer (USB Corp, Cleveland, OH, USA), 20μM of the oligonucleotide and 50 μCi ofa32PddATP. The reaction was incubated at 37°C for 1 h, terminated with 10μL 2 M ethylenediaminetetraacetic acid (EDTA) and heat killed at 70°C for 10 min.
A 100-μL annealing reaction contained 10rmol and 13
rmol of the labeled and unlabeled strands respectively, 20 mM tris(hydroxymethyl)aminomethane-chloride (Tris-Cl) pH 8.0, and 100 mM sodium chloride. The reaction was placed in a boiling water bath, cooled to 65°C, held there for 15 min and allowed to cool to room temperature. Annealed oligonucleotides were stored at -20°C.
Protein-DNA complex formation and EMSA
Protein-DNA binding reactions were carried out in 20-μL reaction mixtures with 20 mM Tris-Cl, pH 8.0.Cl, 1 mM EDTA, 1.0μg/mL calf thymus DNA, 2 nM of the radioac-tively labeled annealed primers and 80 nM of the partially purified preparation of the OrfAB-GFP fusion protein. Reactions were incubated for 30 min at room temperature and electrophoresed through 5% 19:1 Ac:Bis native polya-crylamide gels at 4°C for 1,000 Vhr.
In-gel cleavage assays of OrfAB complexed with IRR substrates
DNA substrates used in complex formation: An 87-bp IRR substrate (see description of oligonucleotides) and a 50-bp IRR substrate [31] were used in the preparation of protein-DNA complexes. Three types of complexes were formed: (a) with the 50-bp substrate alone, (b) with the 87-bp substrate alone and (c) with a mixture of the 50-bp
and 87-bp substrates. Complexes were electrophoresed as described above.
In-gel excision of the complexes and activation of the TPnase:Complexes were excised and activation effected based partly on the protocol of Bhasinet al. [36]. Essen-tially the gel was wrapped and exposed to X-ray film for 30 min. It was then superimposed over the developed film and complexes excised based on the location of the images. Each excised gel slice was cut in half and placed into sepa-rate 2.0-mL eppendorf tubes. To one tube, 1 mL of an acti-vation buffer (20 mM 4-(2-hydroxyethyl)-1-piperazineethanesulfonic acid, 100 mM K glutamate and 10 mM magnesium chloride or magnesium acetate) was added. To the second control tube, 1 mL of the same buf-fer lacking Mg++was added. Gels were incubated at 37°C for 5 min and rinsed twice with 1.0 mL nuclease free water (Ambion/Life Technologies, Grand Island, NY, USA).
Elution of DNA from gel slices:The gels were crushed with a micro pestle in 1.0 mL of a‘crush and soak’buffer (10 mM Tris.Cl, 1% SDS and 10 mM EDTA) and nutated at 4°C overnight. The gel pieces were pelleted at 14 K rpm in a microcentrifuge at room temperature for 10 min then rinsed in 500μL of the same buffer. The resulting 1.5 mL supernatant was then reduced to about 400μl with three consecutive 14 K rpm spins in a YM-10 Microcon Centri-fugal Filter Device (Millipore). Each sample was then sub-jected to seven buffer exchange (topped up with 400 mL Tris-EDTA pH 8.0) spins at 14 K rpm for 16 min at room temperature. Samples were dried down to a pellet in a Savant SpeedVac DNA concentrator (Savant Instruments, Inc., Holbrook, New York, USA) and resuspended in 2.5μL nuclease-free water, 2.5μL of gel loading buffer (GE Healthcare Biosciences, Piscataway, NJ, USA), placed in a boiling water bath for 5 min and stored at -20°C.
DNA sequencing reactions:These were carried out essentially as described previously [10,11,24].
Hydroxyl radical footprinting protocols
Two reactions, one for the footprinting experiment and the other for the free DNA control, were prepared for each substrate as described for the EMSA protocol but with two modifications. Hydroxyl radicals were generated by the Fenton reaction [70]. Reactions were carried out in 70-μL volumes and protein was added to the footprint-ing tube only, at a final concentration of 225.7 nM. The tubes were incubated at room temperature for 30 min and then subjected to OH radical cleavage. Final concen-trations of 5 mM ferrous ammonium sulfate ((NH4)2 Fe
(SO4)2.6H2O), 10 mM EDTA and 0.05% hydrogen