Design and selection of agricultural machinery using a quality
function deployment technique
A. Ashok Kumar
1*, V. K. Tewari
2, J.Maiti
3, Brajesh Nare
2 (1. College of Agricultural Engineering, Madakasira, India;2. Agricultural and Food Engineering Department, IIT Kharagpur, India;
3. Industrial and Systems Engineering Department, IIT Kharagpur, India)
Abstract: The demand of agricultural machinery has been increasing day by day due to lack of availability of human power and increasing the cost of cultivation. The agricultural machinery development is hundreds of time what they were several years ago. The growth of agro industry depends on the farmers; so the production of farm products must be based on farmer’s requirement. Even though they are producing required products still there is a gap between farmers and designers. The most agricultural machinery operator having suffered injuries on shoulder, wrist and elbow, most researchers have concentrated their attention on propelling efficiency or biomechanics issues, not operation interface based on operator s’ requirements. Though some innovative changes have been introduced in the engineering aspect, they are not as popular as expected in rural and urban areas because of the lack of knowledge from farmers. Hence a study was proposed to compile the farmer’s requirements and designers possibilities by using a simple technique of Quality function deployment (QFD). A survey was conducted to identify the farmers, dealers problems and requirements by a group of technical people and the opinions were compared and finally the majority opinions were sorted out and fitted in QFD approach to identify the major needs and problems of farmers for designing and development of machinery based on their opinions’ at the production level of agro industry.
Keywords: QFD, agricultural machinery, house of quality, selection technique
Citation: Ashok Kumar, A., V. K. Tewari , J.Maiti, and B. Nare. 2015. Design and selection of agricultural machinery using a quality function deployment technique. Agric Eng Int: CIGR Journal, 17(4):91-99.
1 Introduction
1Agriculture demands more power and energy to produce food to feed the ever increasing world population. Inefficient tractor implement operations increase the cost of production. The need to maintain agriculture profitability is, however, very much dependent upon both the land and machinery productivity. Management decisions related to agricultural machinery can affect plantation profits in many ways. Operational efficiency of tractor can be improved by maximizing work output or minimizing the fuel consumption.
As competition becomes more intense, agricultural machinery producing companies are adopting quality as a source of advantage. To survive, they have to achieve
Received date: 2015-06-06 Accepted date: 2015-08-25 *Corresponding author: A. Ashok Kumar , Email: [email protected]
higher customer satisfaction. Currently the Agricultural Industry is in the midst of change. The agricultural machinery development is hundreds of time what they were several years ago. Even though there are different technologies were available to optimize the customer’s
requirements and designers considerations a Quality function deployment (QFD) was selected due to its accuracy. QFD is a design-oriented nature serves not only as a valuable resource for designers but also a way to summarize and convert feedback from farmers into information for designers also.
attributes may be overlooked. Linear programming is one of the first mathematical models to be used in QFD optimization. It is often used to allocate resources to the various engineering characteristics in order to maximize overall customer satisfaction. Many papers have been published in this field (e.g. Moskowitz and Kim, 1987; Askin and Dawson, 2000). Goal programming is also a very popular method for QFD optimization process (Karsak et al., 2003a/b; Chen and Weng, 2003). Dawson and Askin (1999) proposed a nonlinear mathematical programming model for determining the optimal engineering characteristics during new product development. In some cases, the values of the engineering characteristics are discrete. Dynamic programming can be used to solve the type of optimization problem where only a few alternatives are available for the engineering characteristics (Lai et al., 2004). To capture the vagueness in product design, fuzzy mathematics was introduced to QFD methodology (Kim et al, 2000; Vanegas and Labib, 2001; Karsak, 2004; Chen et al., 2004).
Quality function deployment (QFD) is one of the structured methods which could be aimed at satisfaction of the customer (Marsot, 2005; Wilkinson, 2007). It has advantages such as customer-oriented development process, better integration of design team, reduction of the produce development period, and effectiveness in policy decision-making. Hence a study was conducted to identify the farmers problems related to agricultural machinery usage by conducting a survey and also to know what’s the farmers exactly expecting from
agricultural machinery manufacturers. Hence a study was proposed to compile the farmer’s requirements and designers possibilities by using a simple technique of
utilized the systematic strategy, QFD, to extract bottleneck techniques in design of agricultural machinery to satisfy the farmer’s requirements also for growth of agro industry.
2 Materials and methods
There are four steps in building an HOQ, describes
as follows: Step 1: CRs are also known as the voice of
the customers. Customer requirements are usually collected by focus groups and expressed in customer own phrase. Quality deployment is included in this step to
generalize customer requirements; Step 2: Drs are also
known as the design requirements or engineering characteristics. Product characteristics are described in the language of the engineer; refered to customer as voice of the design team. The Drs are used to describe how well the design team has satisfied the demands from the
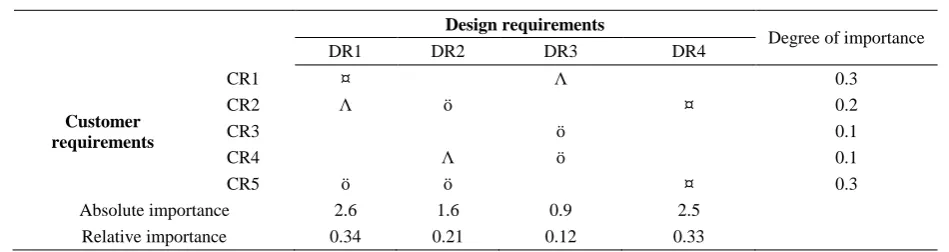
customers; Step 3 . Relationship matrixes. The
relationship matrix indicates how much each DR affects each CR (Table 1). The rating scale can be presented in the score (5; 3; 1) or symbols (¤ strong;ö Medium;Ʌ
Weak). A cell (I, j) in the relation matrix is assigned (¤ strong = 5; ö Medium = 3; Ʌ Weak = 1) to manifest a
strong, medium or weak relationship between the i th CR
and jth DR, respectively; Step 4. Priorities of the DR.
the outcomes obtained from proceeding steps are used to figure a final rank order of DRs. The absolute and relative weighting of CRs and the relation ratings. For each DR, the absolute weighting rating is computed by the following relation.
(1)
The AIj is absolute weight age rating of DRj, j= 1…
n, Wi= Degree of weightage of CRi, i= 1… m, and Rij =
Relationship rating,, representing the strength of the
relation between Cri and DRj. The absolute weightage
rating can be translated in to the relative weightage rating,
RIj,by
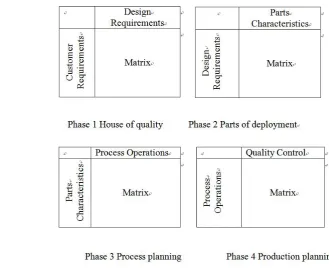
Figure 1 Four phases of quality function deployment process
)
1
(
1
,
1
m
m
i
i
W
ij
R
j
AI
)
2
(
1
,
1
n
n
i
k
AI
AI
j
RI
j
If the RIj is larger, the DR is more important. In
this study, the first two matrices (phase 1: house of quality and phase 2: parts of development) of the QFD
process were concentrated on developing and
modifications required as per the farmers requirements. The procedure consists of three phases:
Phase 1: House of quality. The matrix of HOQ
was built comprising CRs and DRs. Step 1: CRs. A
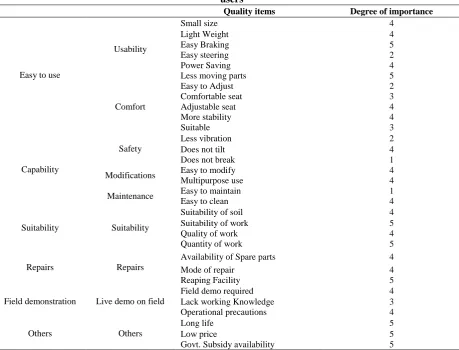
case study was conducted in Guntur District (one of the 9 coastal districts of Andhra Pradesh) which is about 100 kms and having fifty seven mandals and famous for dry land and wet land cultivation. The total geographical area of the district is 11328 sq kms, which forms 4.12% of the total state’s area. One hundred dealers were selected from different reputed agricultural machinery production companies in India and also the number of farmers who were in the field of agricultural since many years are interviewed by a technical team to know their requirements and problems facing at the time of usage of farm products The dealers and farmers opinions were compared and finally the majority opinions were sorted out and given in Table 2 expressed as CRs, were developed to be a questionnaire. The quality items of CRs were listed in the first column of the matrix.
Step 2: DRs. The DRs deployed by a cross-function team, comprising field surveyors, data collection team, problem identification team, research and development team,
marketing team filled in the first row of matrix. Step 3:
relationship matrix. The design team members filled in
the relationship ratings of CRs and DRs. Step 4:
priorities of the DRs. The relative weighting of function DRs were calculated.
Phase 2: Parts of deployment. To build a matrix like phase 1, nevertheless the two dimensions were succeeding as DRs and parts characteristics (PCs). DRs and their degree of importance were filled in column (step 1); PCs deployed by engineering group were filled in row (step 2). DRs and PCs made the second relationship matrix (step 3). Relationship ratings were filled in by the cross-function team; the relative weighting of parts could be calculated by step 4.
Phase 3: Bottleneck technique. Concentrate on the DRs corresponding to PCs and regarding to ranking of PCs to determine bottleneck techniques. This study defined the relative importance of PCs over 10 as a datum. If the correlation between the items of DRs and PCs was strong or the comparative weighting of PCs was stronger, it could be regarded as a bottleneck technique. It is a parts characterization and identification stage of the technical team based on farmer’s requirement and desires.
3 Results and discussion
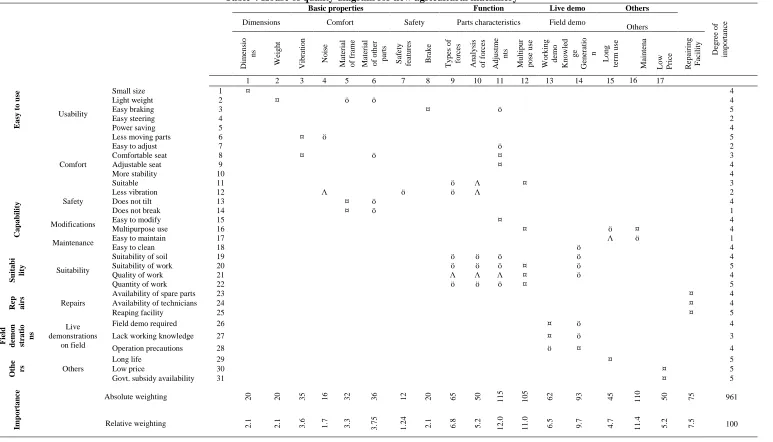
Phase I: House of quality: There were 32 copies of the questionnaire. The degree of importance of CRs is showed in Table 2. Among them, “Less moving parts” “Easy braking” “Suitability of work”, “Quality of work”, “repairing facility”, “long life”, “low price” and “Government subsidy availability” were the most important items. There were 18 DRs (Table 3) deployed by the engineering group of the cross-function team. After establishing CRs and DRs, the matrix of HOQ
Table 1 Typical house of quality matrix with a 5-3-1 rating scheme Design requirements
Degree of importance
DR1 DR2 DR3 DR4
Customer requirements
CR1 ¤ Ʌ 0.3
CR2 Ʌ ö ¤ 0.2
CR3 ö 0.1
CR4 Ʌ ö 0.1
CR5 ö ö ¤ 0.3
Absolute importance 2.6 1.6 0.9 2.5
Relative importance 0.34 0.21 0.12 0.33
could be built. The corresponding relationship of CRs and DRs could be filled with symbols (¤ strong = 5; ö Medium = 3; Ʌ Weak = 1) one by one as the related
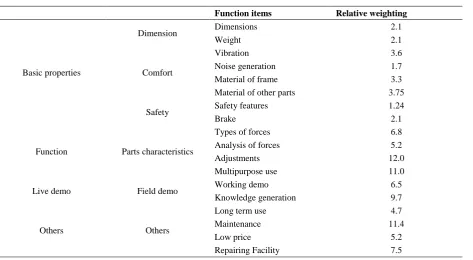
matrix (Table 4). The final result was that the most important items of DRs were “Adjustments”, “Multipurpose use”; and “Easy maintenance”, “Working demo”, the corresponding weightings constituted the
function elements near or over 10% in Table 3.
Phase 2: Parts deployment: In order to find out the PCs of the agricultural machinery, the parts deployment of the agricultural machinery was therefore conducted. After finishing parts deployment in just the some manner as the preceding the HOQ, the cross-function team filled the corresponding relations of DRs and PCs in association notation (¤ strong = 5; ö Medium = 3; Ʌ Weak = 1) as shown in Table 5. The final calculated result was that the “Number of moving parts”, “Type of material”, “Life”, and “Service facility”, were most important, and
the relative importance ratings were 11.1%, 16.0%,
17.9%, and 17.9% respectively.
Phase 3: Determination of the bottleneck techniques: It showed that the weighting of DRs greater than or nearer 10 included four items, according to priority, which were they are Type of forces (12.0%), Analysis of forces (11.0%), working demo (9.7%) and long-term use
(11.4%) (Table 5). Bottleneck techniques aimed at the
four DRs to find out the strong relation items from correspondence to the correlation coefficients on the PC list individually, including number of moving parts, type of material, long life, and repair and servicing facility. As far as the corresponding weighting of part items, there were: number of moving parts(11.1%), type of material (16.0%), long life (17.9%), and repair and servicing facility(17.9%). Because of number of moving parts only got few correlation coefficients of strong item and lower weighting of PCs, it was eliminated. The remaining three items were defined as the bottleneck techniques after discussion
Table 2 Customer requirements obtained by interview and observations of agricultural machinery users
Quality items Degree of importance
Easy to use
Usability
Small size 4
Light Weight 4
Easy Braking 5
Easy steering 2
Power Saving 4
Less moving parts 5
Comfort
Easy to Adjust 2
Comfortable seat 3
Adjustable seat 4
More stability 4
Suitable 3
Capability
Safety
Less vibration 2
Does not tilt 4
Does not break 1
Modifications Easy to modify 4
Multipurpose use 4
Maintenance Easy to maintain 1
Easy to clean 4
Suitability Suitability
Suitability of soil 4
Suitability of work 5
Quality of work 4
Quantity of work 5
Repairs Repairs
Availability of Spare parts 4
Mode of repair 4
Reaping Facility 5
Field demonstration Live demo on field
Field demo required 4
Lack working Knowledge 3
Operational precautions 4
Others Others
Long life 5
Low price 5
Table 3 Design requirements deployed by the cross function team Function items Relative weighting
Basic properties
Dimension Dimensions 2.1
Weight 2.1
Comfort
Vibration 3.6
Noise generation 1.7
Material of frame 3.3
Material of other parts 3.75
Safety Safety features 1.24
Brake 2.1
Function Parts characteristics
Types of forces 6.8
Analysis of forces 5.2
Adjustments 12.0
Multipurpose use 11.0
Live demo Field demo Working demo 6.5
Knowledge generation 9.7
Others Others
Long term use 4.7
Maintenance 11.4
Low price 5.2
Table 4 House of quality diagram for new agricultural machinery
Basic properties Function Live demo Others
D egr ee of im por ta nc e
Dimensions Comfort Safety Parts characteristics Field demo
Others E asy t o u se D im ensi o ns W eig ht V ib ra ti on N oi se Ma te ria l of f ra m e Ma te ria l of ot he r pa rts S af ety fe atu re s B ra ke Type s of for ce s A na ly si s of f or ce s A dj ust m e nt s Mul ti pur pose use W or ki ng de m o K now le d ge G ene ra ti o n Long te rm use Ma in te na nc e
Low Pric
e R epa iring F ac il it y
1 2 3 4 5 6 7 8 9 10 11 12 13 14 15 16 17
Usability
Small size 1 ¤ 4
Light weight 2 ¤ ö ö 4
Easy braking 3 ¤ ö 5
Easy steering 4 2
Power saving 5 4
Less moving parts 6 ¤ ö 5
Comfort
Easy to adjust 7 ö 2
Comfortable seat 8 ¤ ö ¤ 3
Adjustable seat 9 ¤ 4
More stability 10 4
Suitable 11 ö Ʌ ¤ 3
C
ap
ab
il
ity Safety
Less vibration 12 Ʌ ö ö Ʌ 2
Does not tilt 13 ¤ ö 4
Does not break 14 ¤ ö 1
Modifications Easy to modify 15 ¤ 4
Multipurpose use 16 ¤ ö ¤ 4
Maintenance Easy to maintain 17 Ʌ ö 1
Easy to clean 18 ö 4
S u ita b i li ty Suitability
Suitability of soil 19 ö ö ö ö 4
Suitability of work 20 ö ö ö ¤ ö 5
Quality of work 21 Ʌ Ʌ Ʌ ¤ ö 4
Quantity of work 22 ö ö ö ¤ 5
R
ep
ai
rs Repairs Availability of spare parts Availability of technicians 23 24 ¤ ¤ 4 4
Reaping facility 25 ¤ 5
Fie ld d em o n st rat io ns Live demonstrations on field
Field demo required 26 ¤ ö 4
Lack working knowledge 27 ¤ ö 3
Operation precautions 28 ö ¤ 4
O
th
e
rs Others
Long life 29 ¤ 5
Low price 30 ¤ 5
Govt. subsidy availability 31 ¤ 5
Imp
or
tan
ce Absolute weighting 20 20 35 16 32 36 12 20 65 50
115 105 62 93 45 110 50 75 961
Relative weighting 2.1 2.1 3.6 1.7 3.3
Table 5 Parts of deployment matrix for new agricultural machinery
Function
al
Deploy
ment
Body Support Drive System Brake System Other Other
Weightin
g
Frame
Number
of
Moving
Parts
Type
of
Material
Power
Assistive
System
Location
of
Handle
Braking
Device
P
arking
Device
Life
Servic
e
Cost
Maintenance
1 2 3 4 5 6 7 8 9 10 11
Basic Properties
Dimension Dimensions 1 ö Ʌ ö 2.1
Weight 2 ö ö 2.1
Comfort
Vibration 3 ö ¤ 3.6
Noise generation 4 ö Ʌ 1.7
Material of frame 5 ö 3.3
Material of other parts 6 ö 3.75
Safety
Safety features 7 ö ¤ 1.24
Parking Brake 8 ¤ 2.1
Absorbability 9 ö 6.8
Brake 10 ¤ ö Ʌ 5.2
Function Parts Characteristics
Types of forces 11 Ʌ 12.0
Analysis of forces 12 Ʌ 11.0
Adjustments 13 ¤ 6.5
Live demo Field demo Working demo 14 9.7
Knowledge creation 15 4.7
others
Others
Long term use 16 ¤ ¤ 11.4
Low price 17 ¤ ¤ ¤ 5.2
Maintenance 18 ¤ 7.5
Importance Absolute Weighing 21 51.6 73.9 26 32.5 19.32 21.9 83 83 26 26 464.2
4 Conclusions
A quality function deployment was successfully implemented in the design and selection of agricultural machinery. From this study it was concluded that, major group of farmers not satisfied with the available machinery due to bulky in construction, non suitability of multipurpose operations, and more maintenance. It was also observed that, due to lack of working knowledge of machinery, 9.7 percent of farmers are not showing interest to purchase advanced machiney and 11.4 percent of the farmers raised about long-term use and servicing and spare parts availability. In this study a relationship matrix was developed in-between farmer’s requirements and designer considerations, so that by having this, the customer requirements may be fulfilled as well as the growth of agro-industries may be possible which helps to increase the job opportunities’.
References
Askin, R.G., and D.W. Dawson. 2000. Maximizing customer satisfaction by optimal specification of engineering characteristics. IIE Transactions,;32(1):9–20.
Chen, L.H., and M.C. Weng. 2003. A fuzzy model for exploiting quality function deployment. Mathematical and Computer Modelling, 38(5–6):559–570.
Chen, Y., J. Tang, R.Y.K. Fung, and Z. Ren. 2004. Fuzzy regression-based mathematical programming model for quality function deployment. International Journal of Production Research, 42(5):1009–1027.
Dawson, D., and R.G. Askin. 1999. Optimal new product design using quality function deployment with empirical value functions. Quality and Reliability Engineering International, 15(1):17–32.
Hauser, J.R., and D. Clausing. 1988. The house of quality Harvard Bus. Rev, 3():63-73.
Karsak, E.E., S. Sozzer, and S.E. Alptekin. 2003a. Product planning in quality function deployment using a combined analytic network process and goal
programming approach. Computers and Industrial Engineering, 44(1): 171-190.
Karsak, E.E. 2004. Fuzzy multiple objective decision making approach to prioritize design requirements in quality function deployment. International Journal of Production Research, 42(18):3957–3974.
Karsak, E.E., S. Sozer, and S.E. Alptekin. 2003b. Product planning in quality function deployment using a combined analytic network process and goal programming approach. Computers and Industrial Engineering, 44(1):171–190.
Kim, K., H. Moskowitz, A. Dhingra, and G. Evans. 2000. Fuzzy multicriteria models for quality function deployment. European Journal of Operational Research, 121(3):504–518.
Lai, X., M. Xie, and K.C. Tan. 2004. Optimizing product design using the Kano model and QFD. Proceedings of the 2004 IEEE International Engineering Management Conference. IEEE EMS Singapore Chapter: Singapore, 1085–1089.
Marsot, J. 2005. QFD: a methodological tool forintegration of ergonomics at the design stage. Applied Ergonomic,36(2):185-192
Moskowitz, H., and K. Kim. 1987. QFD optimizer: A novice friendly quality function deployment decision support system for optimizing product/service designs. Computers and Industrial Engineering, 32(3):641–655. Park, T., and K.J. Kim. 1998. Determination of an optimal set
of design requirements using house of quality. Journal of Operations Management, 16:569–581.
Vanegas, L.V., and A.W. Labib. 2001. A fuzzy quality function deployment (FQFD) model for deriving optimum targets. International Journal of Production Research, 39(1):2555–2572.