Phenotyping of poplar seedling leaves based on a 3D visualization method
Chunhua Hu
1,
Pingping Li
2*,
Zhou Pan
1(1. School of Information Science and Technology, Nanjing Forestry University, Nanjing 210037, China; 2. School of Biology and Environment, Nanjing Forestry University, Nanjing 210037, China)
Abstract: In plant research, there is a demand for non-destructive and non-invasive trait measurement methods for phenotyping that can be used to accurately analyze various aspects of plants, such as stem length, leaf area, and leaf inclination. In this study, a method for measuring the leaf geometric characteristics of poplar seedlings based on 3D visualization via the use of time-of-flight (ToF) and digital cameras was proposed. Firstly, the average distance density function method was applied to process outliers of leaves. Secondly, to improve the accuracy of data fitting, a specific method using the angle of adjacent two-point normal vectors was introduced to filter redundant data, kept essential sample values as the control points, and then used the control points to fit the leaf surface based on non-uniform rational B-splines (NURBS). At the same time, NURBS was used to fit the trunk according to its control points and an iterative method to fit the other branches. Finally, 3D visualization of poplar seedlings was achieved, and leaf traits, including leaf width, leaf length, leaf area, and leaf inclination angle, were calculated. To obtain accurate results, multiple experiments were conducted including assessments of poplar seedlings exhibiting normal growth and those grown under water shortage. The results of the proposed method were compared with the real values of the leaves. The RMSE for leaf width, leaf length, leaf area, and leaf angle were 0.18 cm, 0.21 cm, 1.14 cm2, and 1.97°, respectively. The results proved that this approach could be used to accurately measure the leaf characteristics of poplar seedlings via visualization.
Keywords: NURBS, poplar seedling, 3D visualization, leaf geometrical characteristics
DOI: 10.25165/j.ijabe.20181106.4110
Citation: Hu C H, Li P P, Pan Z. Phenotyping of poplar seedling leaves based on a 3D visualization method. Int J Agric & Biol Eng, 2018; 11(6): 145–151.
1 Introduction
Plant phenotyping is extremely complex because phenotypes result from interactions between genotypes and numerous environmental factors[1]. With the rapid development of sequencing technologies, researchers have increasingly recognized the importance of plant phenotype research, which has been referred to as phenomics. Plant phenotypes include complex traits, and examples of direct measurement parameters for these traits include root morphology[2], biomass[3], fruit characteristics[4], drought stress response[5] and leaf characteristics[6-8]. To meet future needs, plant breeders wish to be able to develop strategies for new procedures to increase breeding efficiency and optimize plant quality or processing. One important aspect of these phenotyping methods is the exact measurement of a plant’s morphological characteristics. Rapid and reliable predictions of plant traits are essential for monitoring plant growth states, and common morphological traits include parameters such as main stem height, leaf length, leaf initiation angle, leaf width, leaf thickness and leaf area[6]. In these parameters, leaves are important parts of plants Leaf phenotypes can reflect a plant’s growth state, particularly for hardwood seedlings.
During the several years preceding, many plant phenotype
Received date: 2018-01-14 Accepted date: 2018-06-28
Biographies:Chunhua Hu, PhD, Associate Professor, research interests: digital image processing and 3D visualization of hardwood tree, Email: chunhh@ 163.com; Zhou Pan, Graduate Student, research interests: 3D visualization of hardwood tree, Email: [email protected].
*Corresponding author: Pingping Li, PhD, Professor, research interests: agricultural engineering and environmental engineering. School of Biology and Environment, Nanjing Forestry University, Nanjing 210037, China. Tel/Fax: +86-25-85427299, Email: [email protected].
measurements relied on human assessments and measurements[9,10], which are both laborious and time-consuming. Recently, with the rapid development of computer sensor technology and other electronic technologies, an increasing number of automated methods for morphological characteristics detection of plant leaves have been proposed[11,12]. These technologies involve performing measurements using 2D images or 3D models. Several technologies that rely on 2D images include PHENOPSIS, an automated platform to investigate the development of Arabidopsis
two-waveband combinations from hyperspectral data by considering the difference between reflectance values at 760 nm and 739 nm. Rosell Polo et al.[20] developed a LIDAR-based
non-destructive instrument for measuring vegetative volume and surface area in tree-row plantations. Yin[21] introduced an intrusive approach to model full plant geometry and topology using off-the-shelf 3D scanners to obtain data of plant leaf and stem points. Kaminuma[22] reconstructed 3D models using a laser range finder. In these 3D models, polygonal meshes were used to represent leaves and petioles; morphological traits were subsequently quantified. Lou[23] described a method called multi-view stereo (MSV) 3D reconstruction. This method used structure from motion to estimate a camera’s parameters from a sequence of images and reconstruct accurate, dense point clouds. Biskup[24] designed a stereo vision system with two cameras to build 3D models of soybean plant foliage and analyzed the angle of inclination of leaves and its changes over time. ToF cameras can also be used to measure plant traits[25-27]. Chaivivatrakul[25] proposed and demonstrated the effectiveness of automatic corn plant phenotyping based on 3D holographic reconstruction. In this approach, point cloud image data were acquired using a ToF 3D camera. This method can be applied to estimate stem major axis length, stem minor axis length, stem height, leaf area, leaf length and leaf angle. Grift[27] developed an approach for measuring root collar diameter (RCD) based on an optical ToF principle. This diameter was obtained using the time information generated by the shadow of an object passing a pair of receivers.
The major objective of this study is to examine the phenotyping of poplar seedlings. With respect to measuring the morphological characteristics of poplar seedlings, general digital imaging cannot measure 3D information for poplar leaves, and it is inconvenient to mount a LIDAR sensor on a mobile robot arm. This study presents a novel method for measuring poplar seedling leaf traits by using a digital camera and a ToF camera. Digital camera was used to obtain plant leaf color features and texture features, while ToF camera was used to acquire a plant’s 3D spatial information (x, y, z) and construct a 3D model of this plant. Leaf traits, including leaf width, leaf length, leaf area and leaf inclination angle, were also calculated.
2 Methods and materials
2.1 Sample collection platform
A Sony camera, a ToF camera (SR4000, MESA Imaging, Switzerland) and a camera bracket were prepared for data collection. To ensure that the center point was the same for both cameras, the Sony camera and ToF camera were mounted on the same center position on the bracket. The SR4000 camera can capture 3D data for infrared radiation-reflective objects in a 10 m field. It can be connected to a computer via USB or Ethernet. Specific software was developed to obtain 3D information (x, y, z) within the camera’s field of view. In addition, a 144×176 depth image was saved.
2.2 SR4000 calibration
To obtain accurate data for a plant, MATLAB camera calibration toolbox was chosen to establish the camera parameters. In this experiment, ToF camera (SR4000, MESA Imaging, Switzerland) was fixed to a bracket with a known height. As shown in Figure 1, a checkboard of 3.5 cm×3.5 cm was drawn. Six checkboard corners in each row and four checkboard corners in each column were chosen, and nine depth images in different directions were acquired. Information obtained from different
locations was entered into a Matlab calibration toolbox, which was used to obtain the camera parameters and correct depth images.
Figure 1 SR4000 calibration
2.3 Leaf segments based on the distance density function
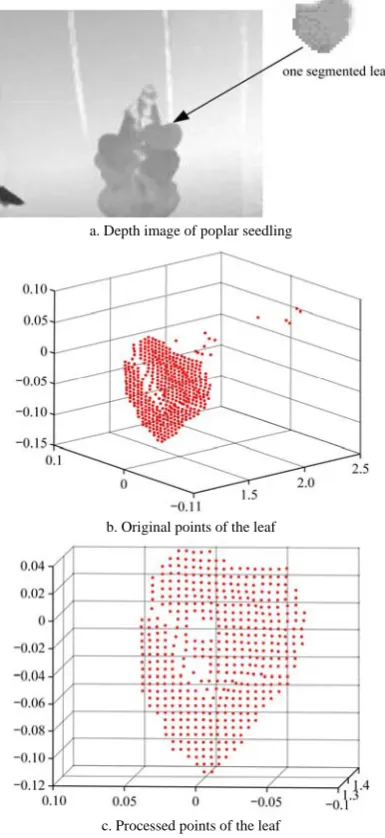
3D point cloud coordinates (x, y, z) of poplar seedlings were captured by ToF camera. Moreover the digital camera was used at the same center point to acquire images of these seedlings’ leaves and branches. Depth images were rectified using the calibration parameters, and the PSO-Otsu method was used to segment poplar seedlings[28] , so that color and depth images of poplar leaves can be obtained based on the edges of the leaf shape. X-coordinates and Y-coordinates were determined based on the depth images. Figure 2a shows segmentation of the depth of a leaf depth image, whereas Figure 2b shows the corresponding 3D coordinates of the scattered points. Certain parameters cannot be determined from the leaf data shown in Figure 2b. Thus, leaf outliers should be trimmed. Multiple methods for the removal of abnormal values have recently been explored, including statistical methods, the Dixon method and the support vector machine cluster method based on the minimum error approach. Besides, a clustering method is not practical because this experiment involves the processing of online sample data rather than fixed classification data. Based on analyses of a great amount of experimental data in this study, the use of the mean distance density method to filter redundant 3D points of leaves was proposed.
In this experiment, outliers were removed using the distance density method via calculation of the density of data points and their adjacent points. Density was defined as the reciprocal of the average distance of all data points. The outliers are in low-density regions, so for different densities, data sets will allow for the good detection of abnormal values. Relevant definitions are as follows: a set of data points was given in which N is the number of points, the weighted standard Euler distance between any two points is computed, and the average distance density is:
2 1 1 1 ( 1) N N i j
i j i i
a σ d N − = = + − ⎛ ⎞ ⎜ ⎟ ⎝ ⎠ = −
∑ ∑
x x(1) 3 1 ( ) d a T d = (2)
Where da is the average weighted standard Euler distance between data points; Td is the global average distance density; xi (i=1,2,3,…,N) is the standard 3D data point, and σi is the standard deviation for the ith sample. For any xi, the k-nearest neighbor points were chosen, and the average distance density Ti was calculated.
is non isolated point is isolated point d d i T T i i T T i ⎧ ≥ − ⎪ ⎨ <
⎪⎩ (3)
demonstrated that the proposed method is efficient for filtering outliers.
a. Depth image of poplar seedling
b. Original points of the leaf
c. Processed points of the leaf
Figure 2 Processing outliers of 3D point clouds
2.4 3D reconstruction for poplar leaves based on NURBS
The non-uniform rational B-spline (NURBS) method for describing a complex free-form surface has high precision. In recent years, this method has become a widely utilized approach for surface reconstruction[29, 30]. Many software applications have adopted the NURBS method for the rebuilding of free-form surfaces. When an irregular surface is created, this method is effective. It can describe freeform surfaces, can accurately represent quadric arcs and quadric surfaces, provide a common mathematical form, and be used to solve for two-dimensional shape information from unified data. The NURBS method also has the advantages of flexible operation, stable calculation, rapidity, and obvious geometric interpretations.
Leaf texture is difficult to create using partial tangent surface fitting or triangle fitting. In this study, the original texture information was preserved and the NURBS method[28] was used to fit the entire poplar leaf. The choice of control vertex substantially influences the fitting effect, and further selection is required for the data point cloud to appropriately choose the control point cloud after removing outliers. In this study, ToF camera acquisition was applied to collect cloud points for poplar seedlings. One important aspect is that there are few redundant points which
eventually have a substantial influence on 3D leaf reconstruction. Therefore, this study proposed the angle of two adjacent normal vectors method to remove redundant points.
For data points pi, i=1,2,…,n, n is the number of leaf points after removing outliers, the k-nearest neighbor method was used to find adjacent data points, and the NURBS method was used to fit the surface. The angle between two normal vectors can measure a surface’s degree of curvature; therefore, the normal angle was introduced to extract the fitting control points. The normal ni at the point pi and ni+1 at the point pi+1, i=1,2,3…,n–1 were calculated,
and the normal angle βbetween ni and ni+1 was then computed. If
the angle of the current point to its eight neighborhood points was larger or smaller than certain threshold values, this point was considered to be redundant and be trimmed. In this study, β<2 and β>60 were the selected thresholds. If the eight points in its neighborhood were within the range defined by these thresholds, the point was retained. Certain data points were left to serve as control points, and the NURBS method was used to fit the 3D data points; the results of data point fitting are shown in Figure 3. Figure 3a indicates a fitting surface obtained using the proposed method. Figure 3b depicts the 3D visualization of the corresponding leaf and its texture; its morphology is similar to that observed in the original image.
a. NURBS surface b. Leaf visualization Figure 3 3D visualization of hardwood seedlings based on
NURBS
2.5 Measuring poplar leaf traits
2.5.1 Measuring poplar leaf length and width
The growth of poplar seedlings involves different stages during which all leaf characteristics including width, length, angular and area were dramatically changed. Particularly during the early growth phase, the rapid growth of leaves must be considered and regular measurement is necessary. There are many measurement methods, including manual methods, LAI instrument-based approaches and nondestructive measurement methods based on various types of sensors[31]. In this study, a new measurement method based on the use of a ToF camera is proposed for obtaining accurate leaf widths and leaf lengths.
To obtain correct leaf widths and lengths, a projection method was applied to measure leaf size. The 3D data that obtained by removing outliers, as described in Section 2.3, were directly projected to a 3D fitting surface, as shown in Figure 4. The length
L=|ynmax–ynmin| and the width W=|xnmax–xnmin| were rapidly
computed, where ynmax, ynmin, xnmax and xnmin are the maximum
length, minimum length, maximum width and minimum width, respectively.
2.5.2 Measuring poplar leaf area
sum of each area were calculated according to the fitting surface mesh. For each partial area i (i=1,2,3…M, where M was the number of sections), the triangular area was calculated using the vector cross product of two adjacent sides of the triangle. As
shown in Figure 5, 1 2 i
S = BA BCG× G . Leaf area was calculated
by summing all Si values for i=1,2,3…M.
Figure 4 Surface data for a poplar leaf
Figure 5 NURBS fitting mesh surface for a poplar leaf 2.5.3 Measuring poplar leaf angle
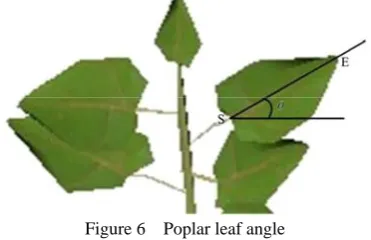
Poplar leaves grow rapidly and their water demand is relatively large. Leaf angle inclination can reflect not only a leaf’s photosynthesis but also the plant’s water shortage status. In this study, poplar seedlings were chosen as the research objects. This research mainly identified whether poplar seedlings were experiencing water shortage based on the fact that leaf inclination angles decrease when these plants need water. To accurately assess poplar growth states, inclination angle was defined as the angle between horizontal direction and the leaf inclination line (the straight line from the petiole end to the top of the leaf) and the angle for a new leaf was accessed.
Figure 6 Poplar leaf angle
3 Results and discussion
In this experiment, a Sony camera and a SR4000 3D depth camera (ToF) were mainly used as visual sensors, whereas a computer (Intel i5 CPU, 4G memory, Win7, 64-bit operating system) was utilized to process 3D data and calculate leaf traits.
Many poplar seedlings were planted in early March of this year in our campus’s natural environment. When these poplar seedlings had a few leaves that could be sampled, data collection for these samples was began including color images and 3D information acquired using the Sony camera and the ToF camera. To control water conditions for the examined plants, these seedlings were moved into a greenhouse when they had a few leaves, where all experiments were performed. The experimental objectives were to not only observe the growth states of the poplar seedlings but also follow their water shortage symptoms. Therefore, experimental samples were divided into two groups, with normal watering for one group and short watering for the other group. To obtain leaf widths, lengths and areas, a LI-3000C area meter were used to measure the area of each leaf and a traditional ruler were used to measure leaf widths, lengths and angles. The SR4000 camera was used to capture 3D information for seedlings, and depth information and depth gray-scale images were also obtained. The depth image resolution was 144×176. To obtain accurate texture information for leaves, the depth camera was replaced with a digital camera and adjusted the center of the camera to the same height as the depth camera to capture color image information for the seedlings. 3D visualization of sampling was constructed using VC++ 2010 and OpenGL. In this experiment, 3D visualizations of poplar seedlings during normal growth and under water shortage conditions were constructed.
An experiment comparing a Delaunay triangulation fitting algorithm and the NURBS fitting algorithm was carried out. The shape of the NURBS surface is determined based on control points. For modeling objects, Delaunay triangulation provides a set of triangles to use as polygons in the model. The NURBS fitting algorithm used the method described in Section 2.4 to select control points to fit the whole leaf and then rendered leaf texture using 3D data. Meanwhile, leaf texture was hard to visualize using Delaunay triangulation. Experimental results showed that especially for low-resolution images of plant leaves, the NURBS fitting surface was smoother and closer to the original leaf shape and showed the true growing condition of leaves in a more natural manner. Figure 7 shows 3D images of normal and water-deprived poplar seedlings. With respect to fitting time, Delaunay triangulation took 2.1 s, while NURBS fitting took 1.7 s.
The Delaunay triangulation fitting algorithm not only requires more data but also includes extra step of constructing triangles to complete fitting. In cases involving the fitting of a large number of leaves, Delaunay triangulation fitting could be less efficient than NURBS fitting.
a. Normal poplar seedling b. Water-deprived poplar seedling Figure 7 3D visualization of poplar leaves
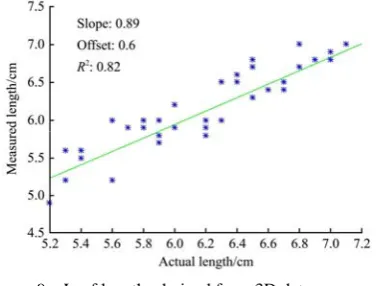
the growth states of these poplar seedlings, samples were collected from leaves of different ages, including tender leaves, new leaves, mature leaves and old leaves. As new leaves grow faster, new leaves are represented in the analysis. The method described in Section 2.4 was used to reconstruct poplar seedlings and calculated leaf lengths, leaf widths, leaf areas and leaf angles using the algorithm described in Section 2.5. Multiple experiments and analyzed data for each leaf; results for the manual collection group and the non-destructive measurement group were then compared. The characteristics of all new leaves were evaluated individually. Figure 8 describes the results for new leaf width measurements. The leaf width regression slope was 0.99, the offset was -0.07, and the root mean square error (RMSE) was 0.18 cm. Figure 9 shows the results for new leaf length measurements obtained via the proposed 3D reconstruction method compared with the manual method. The regression line for leaf length had a slope of 0.89, the offset was 0.6, and the square of the correlation coefficient was 0.82. The RMSE was 0.21 cm. Figure 10 presents the results for new leaf area measurements. The leaf area regression slope was 0.89, the offset was 1.93, and the RMSE was 1.14cm2. Figure 11 describes the results for leaf angle measurements. The leaf angle regression slope was 0.96, the offset was 0.39, and the RMSE was 1.97°. These results indicated that the proposed measurement approach can be used to effectively measure poplar leaf traits with little error, particularly for leaf width and leaf length.
Figure 8 Leaf widths derived from 3D data vs manual measurement
The number of leaves was 40, and the regression formula obtained was:
y=0.99x–0.07, RMSE=0.18 cm
Figure 9 Leaf lengths derived from 3D data vs manual measurement
The number of leaves was 40, and the regression formula obtained was:
y=0.89x+0.6, RMSE=0.21 cm
Figure 10 Leaf areas derived from 3D data vs manual measurement
The number of leaves was 40, and the regression formula obtained was:
y=0.89x+1.93, RMSE=1.14 cm2
Figure 11 Leaf angles derived from 3D data vs manual measurement
The number of leaves was 40, and the regression formula obtained was:
y=0.96x+0.39, RMSE=1.97°
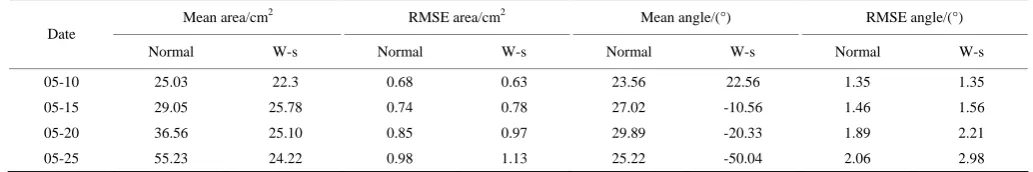
constantly upward throughout the entire growth process. These experimental results showed that the proposed method can be
effectively used to discern water shortage based on leaves’ geometric characteristics.
Table 1 Measurement areas and angles based on the 3D reconstruction method
Mean area/cm2 RMSE area/cm2 Mean angle/(°) RMSE angle/(°)
Date
Normal W-s Normal W-s Normal W-s Normal W-s
05-10 25.03 22.3 0.68 0.63 23.56 22.56 1.35 1.35
05-15 29.05 25.78 0.74 0.78 27.02 -10.56 1.46 1.56
05-20 36.56 25.10 0.85 0.97 29.89 -20.33 1.89 2.21
05-25 55.23 24.22 0.98 1.13 25.22 -50.04 2.06 2.98
4 Conclusions
In this study, a method for measuring morphological traits of poplar leaves based on 3D visualization was proposed, and data were collected using a ToF camera and a digital camera. Collected data for targeted samples were segmented, filtered by an outlier filtering method to address abnormal values, and filtered redundant data points based on the normal angle of two consecutive points to improve the speed of data fitting and the authenticity of the visualized leaves. The NURBS algorithm was then used for the fitting of leaves based on these control points. Repeated experiments and analyses and comparisons based on the obtained results indicated that the method proposed in this paper could be used to effectively reconstruct poplar seedlings.
Poplars grow rapidly in the summer, and their growth requires sufficient water. It is necessary to automatically record the growth status of poplar seedlings. In this study, experiments in which access both normal poplar seedlings and water-deprived poplar seedlings were also conducted. Based on our 3D models, leaf traits, including leaf width, leaf length, leaf area and leaf angle for these seedlings were calculated. Compared with manual measurement, the proposed method optimizes the speed and accuracy with which these features can be determined. Results confirmed that the normal samples and water shortage samples exhibited different leaf traits; therefore, the proposed method can be applied for automatic detection and irrigation in poplar nursery fields.
Acknowledgments
This work was financially supported by the National Key Research and Development Program of China (2017YFD0600905-1), the Priority Academic Program Development of Jiangsu Higher Education Institutions and the Jiangsu Government Scholarship for Overseas Studies (JS-2014-013).
[References]
[1] Granier C, Tardieu F. Multi-scale phenotyping of leaf expansion in response to environmental changes: the whole is more than the sum of parts. Plant Cell Environ., 2009; 32: 1175–1184.
[2] Kumar P, Huang C, Cai J, Miklavcic S J. Root phenotyping by root tip detection and classification through statistical learning. Plant Soil, 2014; 380: 193–209.
[3] Muraya M M, Chu J, Zhao Y, Junker A, Klukas C, Reif J C, et al. Genetic variation of growth dynamics in maize (Zea mays L.) revealed through automated non-invasive phenotyping. Plant Journal for Cell & Molecular Biology, 2017; 89(2): 366–380.
[4] Monforte A J, Diaz A I, Caño-Delgado A, van der Knaap E. The genetic basis of fruit morphology in horticultural crops: Lessons from tomato and melon. Journal of Experimental Botany, 2014; 65(16): 4625.
[5] Zhao C, Gao X, Ma R, Chen L, Chen T, Ren J. Responses of and seedlings to different draught stress of soil in ecophysiological characteristics.
Journal of Glaciology & Geocryology, 2012; 34(1): 147–154.
[6] An N, Palmer C M, Baker R L, Cody Markelz R J, Ta J, Covington M F, et al. Plant high-throughput phenotyping using photogrammetry and imaging techniques to measure leaf length and rosette area. Computers & Electronics in Agriculture, 2016; 127(C): 376–394.
[7] Lu H, Tang L, Whitham S A, Mei Y. A robotic platform for corn seedling morphological traits characterization. Sensors, 2017; 17(9):2082. [8] Heuvelink E. Evaluation of a dynamic simulation model for tomato crop
growth and development. Annals of Botany, 1998; 83: 413–422. [9] Jonckheere I, Fleck S, Nackaerts K, Muys B, Coppin P, Weiss M, et al.
Review of methods for in situ leaf area index determination: Part I: theories, sensors and hemispherical photography. Agricultural and Forest Meteorology, 2004; 121(1-2): 19–35.
[10] Fanourakis D, Briese C, Max J F J, Kleinen S, Putz A, Fiorani F, et al. Rapid determination of leaf area and plant height by using light curtain arrays in four species with contrasting shoot architecture. Plant Methods, 2014; 10(1): 1–9.
[11] Yun T. A novel approach for retrieving tree leaf area from ground-based LiDAR, Remote Sensing, 2016; 8(11): 942–962.
[12] Ran N L, Sagi F, Hanan E. Plant growth parameter estimation from sparse 3D reconstruction based on highly-textured feature points, Precision Agriculture, 2013; 14(6): 586–605.
[13] Granier C, Aguirrezabal L, Chenu K, Cookson S J, Dauzat M, Hamard P, et al. PHENOPSIS, an automated platform for reproducible phenotyping of plant responses to soil water deficit in Arabidopsis thaliana permitted the identification of an accession with low sensitivity to soil water deficit. New Phytologist, 2006; 169(3): 623–35.
[14] Tisné S, Serrand Y, Bach L, Gilbault E, Ben Ameur R, Balasse H, et al. Phenoscope: an automated large-scale phenotyping platform offering high spatial homogeneity. Plant Journal for Cell & Molecular Biology, 2013; 74(3): 534–44.
[15] Hartmann A, Czauderna T, Hoffmann R, Stein N, Schreiber F. HTPheno: An image analysis pipeline for high-throughput plant phenotyping. BMC bioinformatics, 2011; 12(1): 148.
[16] Yun T, Chen B, Li W, Sun Y, Xue L. Using point cloud data for tree organ classification and real leaf surface construction. Bulgarian Chemical Communications, 2017; 49(1): 288–296 .
[17] Golbach F, Kootstra G, Damjanovic S, Otten G, van de Zedde R. Validation of plant part measurements using a 3D reconstruction method suitable for high-throughput seedling phenotyping. Machine Vision and Applications, 2016; 27: 663–680.
[18] Tanaka S, Kawamura K, Maki M, Muramoto Y, Yoshida K, Akiyama T. Spectral index for quantifying leaf area index of winter wheat by field hyperspectral measurements: a case study in gifu prefecture, central Japan. Remote Sensing, 2015; 7: 5329–5346.
[19] Behmann J, Mahlein A K, Paulus S, Kuhlmann H, Oerke E C, Plümera L. Calibration of hyperspectral close-range pushbroom cameras for plant phenotyping. ISPRS Journal of Photogrammetry and Remote Sensing, 2015; 106: 172–182.
[20] Rosell Polo J R, Sanz R, Llorens J, Arnó J, Escolà A, Ribes-Dasi M, et al. A tractor-mounted scanning LiDAR for the non-destructive measurement of vegetative volume and surface area of tree-row plantations: A comparison with conventional destructive measurements. Biosystems Engineering, 2009; 102(2): 128–4134.
[21] Yin K, Huang H, Long P, Gaissinski A, Gong M, Sharf A. Full 3D plant reconstruction via intrusive acquisition. Computer Graphics, 2016; 35(1): 272–284.
Plant, 2004; 38: 358–365.
[23] Lou L, Liu Y, Han J, Doonan J H. Accurate multi-view stereo 3D reconstruction for cost-effective plant phenotyping. International Conference Image Analysis & Recognition. Springer International Publishing, 2014; pp.349–356.
[24] Biskup B, Scharr H, Schurr U, Rascher U. A stereo imaging system for measuring structural parameters of plant canopies. Plant, Cell and Environment, 2007; 30 (10): 1299–1308.
[25] Chaivivatrakul S, Tang L, Dailey M N, Nakarmi A D. Automatic morphological trait characterization for corn plants via 3D holographic reconstruction. Computers and Electronics in Agriculture, 2014; 109(C): 109–123.
[26] Klose R, Penlington J, Ruckelshausen A. Usability study of 3D time-of-flight cameras for automatic plant phenotyping. Bornimer Agrartechnische Berichte, 2009; 69: 93–105.
[27] Grift T E, Oberti R. Development of low-cost, root collar diameter
measurement devices for pine seedlings. Computers and Electronics in Agriculture, 2006; 52: 60–70.
[28] Hu C H, You Y D, Li P P. 3D visualization of broad-leaved seedlings leaves combined depth image with digital image. International Conference on Computer Science and Communication Engineering (CSCE2015), Suzhou, China, 2015; 6: 244–249.
[29] Zhang Y H, Liang T, Liu X J, Liu L, Cao W, Zhu Y. Modeling curve dynamics and spatial geometry characteristics of rice leaves. Journal of Integrative Agriculture, 2017; 16(10): 2177–2190.
[30] Ghasemi H, Brighenti R, Zhuang X Y, Muthu J, Rabczuk T. Optimization of fiber distribution in fiber reinforced composite by using NURBS functions. Computational Materials Science, 2014; 83(8): 463–473.