On the Behavior of Lateral Pipe-Soil Interaction in Ultra-Soft Clayey Soil
Using Large Scale-Laboratory Tests
Aram Mohammed Raheem
*Civil Engineering Department, University of Kirkuk, Iraq
Received 05 May 2018; received in revised form 16 July 2018; accepted 20 September 2018
Abstract
One of the most essential challenges in the deep offshore environments is the lateral pipe-soil interaction
movement in very soft soils. Thus, several comprehensive large-scale physical models with dimensions of (2.4
m*2.4 m*1.8 m) have been constructed to examine the behaviour of lateral pipe-soil interaction on a simulated
seabed. In this study, large-scale model tests were performed through a special loading frame, using instrumented
pipes placed on ultra-soft clayey soil to quantify the lateral pipe-soil interaction by using a precise remote gridding
system. The effects of several real field conditions such as pipe end conditions, pipeline material, soft soil shear
strength, rate of loading, and pipe size were inspected extensively. It was shown that the fixed-end boundaries
developed more resistance up to 50% against lateral displacement in comparison to the free-end boundaries.
Moreover, the maximum resistance of the plastic pipe was 64% more than the steel pipe.
Keywords: lateral pipe-soil interaction, ultra-soft soil, remote gridding system, large scale testing
1.
Introduction
Oil-gas production and pipeline technology have started a continuous growth since the establishment in California in the
past century [1]. Once offshore oil and gas equipment are advanced in deep-water, long pipelines are required in each field and
are frequently been used to carry the hydrocarbons to seashore. As the hydrodynamic packing is a problematic in shallow water
condition, pipelines are normally covered in a trench or protected by using different stabilization methods. In deep water
environment, the possibility of protecting the pipe is impossible and expensive, due to technical challenges [2]. Consequently,
the pipelines in deep-water are placed directly on the seabed. The axial resistance is generated in the pipe-soil interaction zone
because of the extraordinary axial strains that initiated by high operating pressure and temperature [3].
As the oil and gas development has focused into deeper water, the charge of the pipeline system for such process has
suddenly amplified. Deepwater pipelines are rested on the seabed and partially penetrated into the soil. This penetration varies
based on the submerged weight of the pipeline and the soil strength of the seabed [4]. In general, the pipeline seabed is
consisted of ultra-soft soil with extremely low undrained shear strength of 0.01 kPa at ambient temperature [5]. Thus, the
bending stresses that are generated in the pipe insulators change immediately when a contact between the pipe and the soil is
happening. During the system operation, the pipelines are required to sustain high cyclic temperatures and pressures. These
circumstances produce high stresses with movement and cause buckling in the pipe. There is misunderstanding of the breakout
resistance of the pipes that are embedded partially in extremely low shear strength seabed layer. The formation of the soil
berms and restriction of pipe movement are triggered by the lateral movement of the pipes. Hence, a better quantification for
the ultra-soft soil resistance is required during lateral movements of the pipes. High-pressure and high-temperature (HP/HT)
challenges are well visualized in shallow water conditions. However, such HP/HT conditions are extraordinary complex in
deep-water conditions [6]. To maintain the pipelines during their lifetime span with growing of HP/HT applications, it has
become necessary to use advanced innovative methods in deep-water conditions, especially in West Africa and Gulf of Mexico.
In the deep-water applications, the design pipelines are very complex, due to the existence of severe conditions and the
challenge of maintaining the flow with the same production. High temperature, high pressure, large movement, and lateral
buckling are the main causes for the global instability of the entire system that lead to break the pipelines at critical locations
[7]. Hence, in order to address the pipelines issues depending on progressive engineering research [8], it is essential to use
precious experimental study for various expected field conditions. Most of the previous laboratory studies are concentrated on
inspecting the variation of the load with the penetration for the pipes into the seabed [9].
In the previous studies, an external loading system was used to push the pipes into the soil without actual simulation for
the real field conditions [10]. In the laboratory studies, the loading technique is the most critical element affecting the
simulation of the field conditions. As the pipeline is subjected to combined loading represented by high temperature and lateral
movement coupled with buckling, the enhancement of the assessment system for the moving pipe resistance is necessary for
designing the deep seabed pipelines. For better understanding the pipe behavior, it is required to analyze three parts of the pipe
thoroughly. Firstly, it is required to characterize the physical parameters of the pipe, surface properties, weight, and loading
conditions represented by pressure, temperature, and cyclic loading. Secondly, it is necessary to study the moving pipe-soil
interaction with the soil properties in the vicinity of the pipe. Thirdly, it is vital to perform an extensive investigation for
analytical methodology, including the important time variations represented by loading, soil movement (formation of soil
berms), ground topography, and pipe-soil interaction characteristics. The second part has the most uncertainties because of the
variation in the soil properties and the absence of reliable analytical methods for the lateral pipe-soil resistance [11].
A laboratory pull-out test with numerical analysis was implemented on buried submarine pipelines to study the lateral soil
resistance in sand and soft clay [12]. Based on the study results, a number of experimental equations were recommended to
quantify the lateral resistance of the soil with the displacement of the pipelines. In addition, it was shown that the lateral soil
resistance affected the pipes varies with the pipe diameter and soil properties. Another study was also performed on pipe-soil
interaction study using model tests to concente on the lateral movement and depending on different weights of the pipe with
different initial embedment [13]. This study gave an explanation for the berms formation with the effect of the berms on the
lateral soil resistance. Moreover, pipe-soil interaction analyses were investigated using laboratory model experiments in Bohai
sand. This study calculated the breakout resistance using upper-bound method. The previous studies have used experimental
works to inspect the lateral behaviour of pipe-soil interaction. However, these studies have rarely investigated the effects of
several crucial factors such as the end conditions of the pipe (free or fixed), ultra-soft soil strength, pipeline material, loading
rate, and influenced area of the deformed soil.
Hence, the main objective of this study is to examine the pipe-soil interaction performance in ultra-soft soil (soft soil with
shear strength < 1 kPa) under the effect of lateral loading tested using a large-scale laboratory model. The particular objectives
of this study aim to:
(1) Establish an approach or design a method to capture soil displacement field and trace berms formation preciously at the
vicinity of the pipe using several reliable large-scale model tests.
(2) Implement parametric investigation of the lateral pipe-soil interface considering the results of pipe end conditions (free,
and fixed), soft soil shear strength, pipeline material, pipe size, rate of loading, and influenced area of soil.
2.
Methods and Materials
2.1. Large-scale soil box
A large-scale experimental model test was used to mimic the pipe-soil interaction where ultra-soft clay soil was used as a
the seabed topography is an additional critical problem since the pipes are deformed and then partially buried in the ultra-soft
soil. As the pipe starts sliding on the soil due to the HP/HT reaction of the oil and gas in the pipe, depending on buried depth
and pipe movement, soil is moved forming berms and producing higher stresses and deformation in the pipes. The
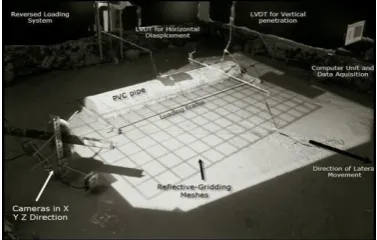
experimental model for this study is shown in Fig. 1. Large ultra-soft soil sample with dimensions of 2.4 m length, 2.4 m width
and 1.8 m height was fabricated and prepared in CIGMAT (Center for Innovative Grouting Materials and Technology) in order
to simulate the field seabed conditions reliably. The machine that used to examine the sliding pipe was displacement controlled
and the pipe was linked to the loading machine using a strong string. A plastic pipe that has a diameter (D) of 6 cm was used to
represent the insulation surface of the authentic pipe. The used plastic pipe had a length of 1.2 m. In order to locate the path of
soil deformation during lateral loading, three cameras in three different directions X, Y and Z with CIGMAT Remote Gridding
System (CRGS) were used and consequently; the data that obtained from the cameras were recorded and programed. With the
aim of making the soil deformation observable for the camera, colour flocks were mixed on the top surface of the seabed soil.
For the first time in this study, CRGS was set up to facilitate the cameras for suitable coordinating the soil deformation and pipe
movement. In this work, it was also significant to develop a cyclic loading scheme in a way that the pipe moves freely without
any external constraint.
Fig. 1 Lateral pipe soil interaction testing facility at CIGMAT (Center for Innovative Grouting Materials and Technology)
2.2. Ultra-soft soil preparation
All the experimental tests of the pipe-soil interaction were performed on ultra-soft soil representing the real seabed
prepared from commercially available Wyoming bentonite. It was necessary to prepare a homogeneous slurry by mixing
bentonite clay powder with water at different ranges of water content to retain the shear strength in the limit of 0.02 kPa to 0.2
kPa. Raheem et al. [14] has introduced equations as a key correlation between water content and shear strength in the mix
design as identified below:
Su= -6*ln(w/c%)+15; when w/c < 300% and LL < 500% (1)
Su= 14.4*e(-0.004*w/c%)+1/(e(w/c%-LL%)); when w/c > 300% and LL > 500% (2)
where Su is undrained shear strength, w/c represents soil moisture content, and LL is liquid limit.
A total of 92 data was collected from the literature to develop the strong relationship that identified in both equations 1
and 2 [15-16]. The proposed equations were verified against the experimental data with a coefficient of correlation (R2) of 0.91.
When the seabed soil has been prepared, vane shear tests were performed at different locations to ensure that the anticipated
undrained shear strength was maintained. In all the batches, the shear strength distribution was in a very good match with the
shear strength of the tested soil with inconsistency up to 8% [17].
The CIGMAT blender was equipped with a vacuum port using a jubilee connection. A vacuum up to 30 kPa was applied
at the beginning of the final stage and upheld all over to complete de-airing slurry. Then, the slurry was moved to the soil tank
for proper consolidation via six drainage-opened pipes that were fabricated during big tank construction. At the beginning of
completely. In order to resemble the field situation, a free water layer was placed on the soil surface right before the test. For
the sake of the consistency of the undrained shear strength, both the water content and vane shear tests were performed at
different points on a regular basis before, during and after each large-scale test. The precision of the used vane shear device for
the torque measurement and angular displacement was 0.01 N cm and 0.0573o, respectively. The thickness of the soil profile
under the pipe depends on several factors such as the soil resistance, the pipe diameter, the direction of pipeline movement, the
applied moving amplitude, the subsoil properties, and the pipeline laid technique [12-13]. Hence, the soft soil profile of the
model tests were considered to have a minimum thickness of 0.305 m.
2.3. Instrumentation
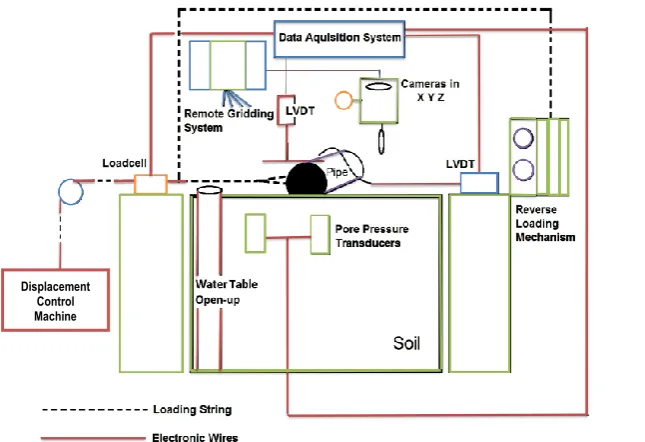
The pipe sliding resistance rested on ultra-soft soil was observed using a load cell presented in Fig. 2. The load cell was
accurate up to 0.045 N. The displacement of the pipe in both vertical and horizontal directions was measured by two sets of
linear variable differential transducers (LVDT). Moreover, the excess pore water pressure was quantified using a pore pressure
transducer placed beneath the pipe invert, since the position is expected to be the most critical location during performing the
experimental tests.
Fig. 2 Schematic of the lateral loading testing setup
2.4. Lateral loading frame
In this study, a detailed loading system was designed to examine the lateral pipe-soil behaviour for different model pipes.
The significant advantage of this system includes:
(1) Least external influence
In this design, attempts have been performed to reduce the external influences and operations from the loading actuator.
Particularly, the pipe is permitted to track its normal behaviour during expansion because the loads are applied in one
changeable direction. In addition, the pipe is not constrained by any sensing instruments or loading apparatus during the
movement. To avoid the friction forces or any additional vertical loads, the lateral and horizontal LVDTs are linked with the
pipes, using a light-weighted frictionless arch-shaped rod with a slippery edge.
(2) Least external influence
Using this design, the lateral forces are transferred to the pipelines through the solid loading frame where the frame
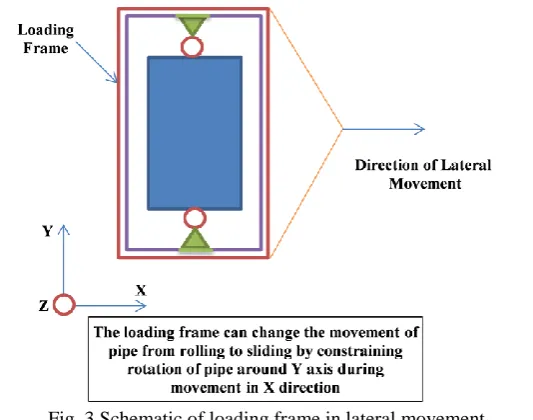
dimensions are changeable based on the pipe length and size. The pipe is located inside an aluminium rectangular frame that Displacement
can induce two different modes of frame-pipe boundary as identified in Figs. 3 and 4 respectively. The loading frame can
adjust the movement of the pipe from rolling to sliding by restraining the pipe around Y-axis during movement in X-direction.
This is used to simulate the effect of high pressures and temperatures on the pipelines. At any time increment, CRGS assist the
cameras to synchronize the pipe movement and the soil deformation as shown in Fig. 5.
Fig. 3 Schematic of loading frame in lateral movement
To apply CRGS accurately, the following steps are essential:
(1) Collecting the CRGS model sheets by copying the alignments (gridlines) from a standard parent model outside the soil
chamber to transparent sheets. The transparent sheets are placed on the projector and reflected in the soil model. Both the
distance and angle of the projector were considered to have alignments forming 5 cm by 5 cm squares on the entire surface
of the soil model. The distance and angle of the projector are kept straight and perpendicular to the whole surface of soil
model.
Fig. 4 Loading mechanism in lateral setup Fig. 5 CRGS application on real laboratory test
(2) Calibrating and correlating the variations in the angles and shapes of the produced grids to the new topography of the
simulated seabed soil in every single square. In Fig. 6, consider “pattern 1” is produced in the soil model and because of the pipe movement, a number of the gridline squares become “shape A”. With a quick prediction, it is clear that the new
gridline denotes a reduction in the elevation of the soil in the studied area. Nevertheless, the major challenge is to
quantitatively relate any alteration in the configuration or angle of the gridline to the new topography of the model. This
challenge was addressed using different soil topography with different slopes where these models were built in CIGMAT
laboratory. As a result, the new gridlines patterns were accurately photographed and recorded to construct a database.
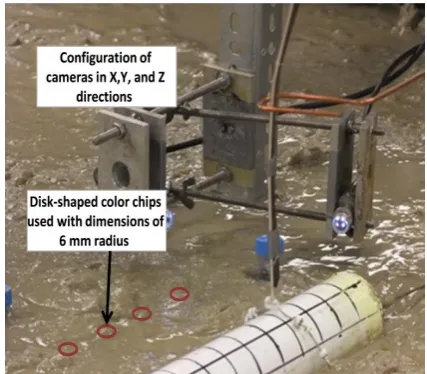
(3) Placing light-weighted colour chips with disk-shaped that has a diameter of 6 mm on the exterior face of the soil model
before the beginning of the test. When the test is started, the tiny chips move with the ultra-soft soil particles (undrained
shear strength ranges from 0.02 to 0.2 kPa) and the chips can be tracked easily due to their distinct colours [15]. It is highly
(4) The test should be run and both the soil and pipe movements with displacements should be recorded using three cameras in
x, y, and z directions concurrently.
(5) For any time change increment, the photos are recorded and grids (node connections) in each photo are appointed to
mathematical coordinates using computer-programming methods. Certain commercial detailed software has the ability to
repeatedly define points of distinctive appearance (flashy gridlines from the rest of the photos). To closely obtain the
geometry of the heaves and berms, it is required to combine the coordinates of the nodes from different cameras in X, Y,
and Z as identified in Figs. 6 and 7.
Fig. 6 CRGS simulation for axial full scale testing Fig. 7 Camera set-up during experimental work
3.
Results and Discussions
3.1. Fix-end and free-end lateral loading
In this part of the study, the focus was to examine the impact of the pipe end condition on the lateral resistance behaviour
of pipe-soil interaction. The lateral loads were transferred to the pipeline via solid loading frame where the frame dimension
was adjusted according to the pipe size and length. The pipe was rested inside an aluminium rectangular frame, which was
capable of inducing two different modes for frame-pipe boundaries as:
(1) Free-end boundary, and
(2) Fixed end boundary
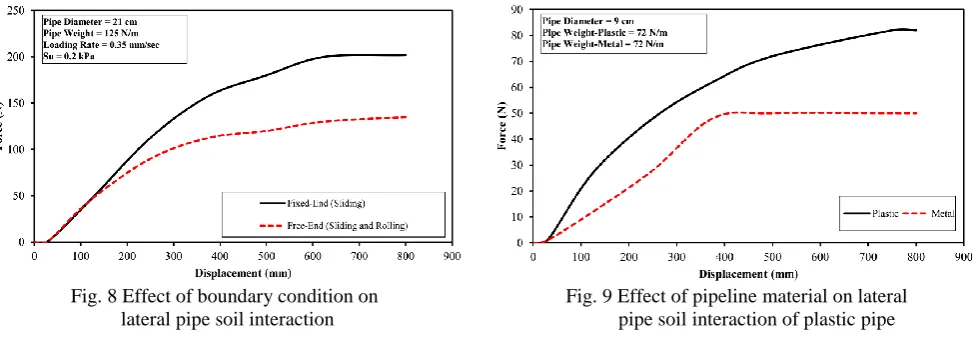
The results of the lateral pipe soil interaction for both of free-end and fixed-end boundaries are shown in Fig. 8. For this
study, the fixed-end boundaries developed more lateral resistance up to 50% compared to the free-end boundaries. It is clearly
shown that the lateral resistance smoothly reached the maximum resistance without breakout behaviour at any point. In the free
end boundary, the lateral resistance initially increased until it has reached the maximum resistance of 135 N at a displacement
of 800 mm. When the pipe moves laterally, it was observed that the berms accumulate in the front of the pipe and plausibly
more force is required to mobilize both of the berm and the pipe. Meanwhile, the skin friction between the pipe and the soil
increases and reaches the point where there is no sliding between the pipe surface and the soil. At this point, the pipe rotates and
passes over the generated berms. As a result, both the lateral resistance and the skin friction significantly drop and the pipe can
slide again. The new berms begin to form on the top of the old berms and sliding-rolling cycles will be repeated.
3.2. Effect of pipeline material
For this part of the study, the emphasis was to investigate the effect of different material surfaces on the lateral resistance
behaviour of the pipe-soil interaction. A plastic pipe with a length of 120 cm and a diameter of 9 cm with a dead load of 72 N/m
and a steel pipe with the same diameter and length with a dead load of 72 N/m were used for this part of the study. To ensure
the boundaries were considered as free-end and the undrained shear strength of the underneath soil was 0.08 kPa, which
measured before, during and after each test to ensure the soil consistency. As shown in Fig. 9, the plastic pipe reached the
maximum resistance of 82 N at a displacement of 800 mm or 889% of the pipe diameter without any breakout resistance. While,
the metal pipe smoothly reached the maximum resistance of 50 N at a displacement of 500 mm or 556% of the pipe diameter
without any breakout resistance. The maximum resistance of the plastic pipe was 64% more than the steel pipe as the soil in the
plastic interface tends to adhere more rigorously to the pipe because the coefficient of adhesion for the used plastic pipe is
higher than the steel pipe.
3.3. Effect of soil strength
Herein, the importance was to simulate the effect of different seabed strengths on the lateral resistance behaviour of
pipe-soil interaction. The soil shear strength is kept less than 1 kPa during all the experimental tests [14]. To study the effect of
the soil undrained shear strengths on the lateral responses, in both studied cases of free-end and fixed-end boundaries, a plastic
pipe with a length of 120 cm and a diameter of 21 cm with a dead load of 125 N/m was laid first on a soil with undrained shear
strength of 0.02 kPa for 24 hours to study the vertical penetration. Then, the lateral test was performed with a constant rate of
0.35 mm/sec. Later, the same test was repeated for soils with shear strengths of 0.08 kPa and 0.2 kPa respectively. To ensure
the soil homogeneity, continuous measurement of undrained shear strength before, after and during the test was performed in
five areas of the soil box at reasonable time interval.
Fig. 8 Effect of boundary condition on lateral pipe soil interaction
Fig. 9 Effect of pipeline material on lateral pipe soilinteraction of plastic pipe
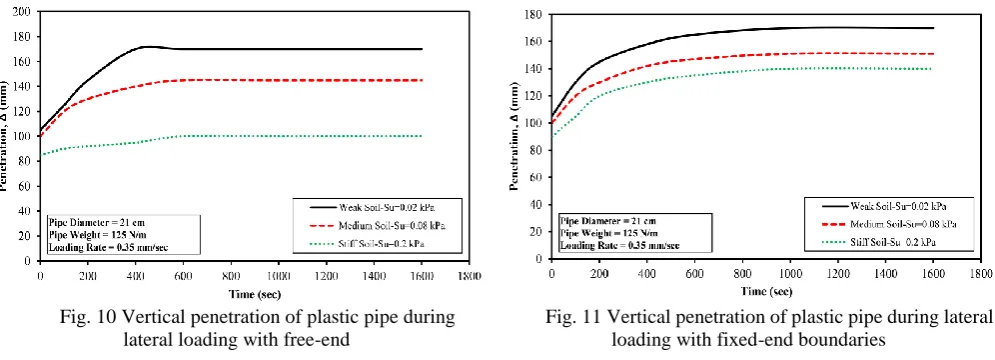
In the free-end boundary case, the pipe was laid on the first soil with shear strength of 0.02 kPa where the vertical
penetration was observed to be 10.5 cm after 24 hours as shown in Fig. 10. The pipe exhibited a maximum penetration of 170
mm after a lateral displacement of 185 mm. For both the second and third soil conditions with shear strengths of 0.08 kPa and
0.2 kPa and after 24 hours of pipe laying, the vertical penetrations were 100 mm and 85 mm respectively. As the pipe moved
laterally in the second soil condition, the maximum vertical penetration was observed to be 145 mm after a lateral displacement
of 213 mm. In the third soil condition, the maximum vertical penetration was observed to be 130 mm after a lateral
displacement of 248 mm. With the increase in the soil undrained shear strength, both initial and final penetrations of plastic
pipe reduced and the maximum penetrations shifted slightly to the right.
In the fixed-end case, the vertical pipe penetration increased gradually during the lateral movement as shown in Fig. 11.
The ultimate vertical pipe penetration of the fix-end boundary case was almost the same as the free-end boundary condition in
weak soil that has undrained shear strength of 0.02 kPa. The end boundary condition (free or fixed) has no effect on the weak
soil since the pipe bed is weak. Hence, the pipe rotating (free-end) or sliding (fixed-end) gives almost the same vertical
penetration. However, in stiff soil with undrained shear strength of 0.2 kPa, the ultimate vertical pipe penetration of the fix-end
boundary case was 40% more than the free-end boundary case as shown in Fig. 11. In the stiff soil situation, the free-end
condition gives the pipe the rotation that facilitates the pipe movement with lower vertical pipe penetration whereas the
Fig. 10 Vertical penetration of plastic pipe during lateral loading with free-end
Fig. 11 Vertical penetration of plastic pipe during lateral loading with fixed-end boundaries
The effect of soil undrained shear strengths on the force displacement responses of laterally loaded pipe using free-end
boundaries have been demonstrated in Fig. 12. For the three studied soil conditions of weak soil (Su= 0.02 kPa), medium soil
(Su= 0.08 kPa) and stiff soil (Su= 0.2 kPa), and after a displacement of 800 mm (3.8 of the pipe diameter), the pipe reached the
maximum lateral resistances of 90 N, 115 N and 138 N respectively. In addition, the lag in the lateral resistance increase was
observed to be faster in stiffer soil.
Fig. 12 Effect soil shear strength on lateral pipe soil interaction with free end boundaries
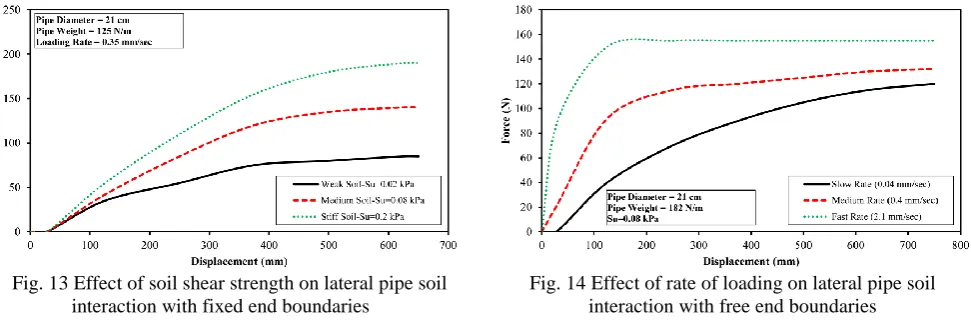
The result of the lateral pipe-soil interaction on the three different soil conditions for the fixed end boundary case is shown
in Fig. 13. With the increase in the soil shear strength for each test, the maximum lateral resistance is increased notably by 65%
for the medium soil (four times increase in the shear strength) and 124 % for the stiff soil (10 times increase in the shear
strength). By changing the condition from free-end boundary to fixed-end boundary, the lateral resistance of the stiff soil is
increased by 38%, while this increase was 22% for the medium soil, and with no increase for the weak soil. When the soil
becomes stiffer, the lateral resistance increases since the pipe requires more force to begin the movement. For the soil with
medium to relatively high strength, the fixed-end condition provides more lateral resistance since the pipe requires more force
to slide; whereas the free-end condition affords less lateral resistance because the pipe needs less force to start sliding.
3.4. Rate of loading
In this part of the study, it was significant to mimic the influence of different loading rate caused by different flows in the
pipes on the lateral resistance behaviour of the pipe-soil interaction. A plastic pipe with a length of 120 cm and a diameter of 21
cm holds a dead load of 182 N/m where this pipe has been loaded under three different displacement rates of 0.04 mm/sec, 0.4
mm/sec and 2.1 mm/sec respectively [15]. With an increase in the rate of displacement from 0.04 mm/sec to 0.4 mm/sec and
0.04 mm/sec to 2.1 mm/sec, the maximum lateral resistance of the pipe increased by 10% and 29% respectively. As shown in
Fig. 13 Effect of soil shear strength on lateral pipe soil interaction with fixed end boundaries
Fig. 14 Effect of rate of loading on lateral pipe soil interaction with free end boundaries
The main reason for the significant increase in the maximum lateral resistance after the increase in the loading rate could
be justified only by analyzing the history of excess pore water pressure below the pipe. The variation of excess pore water
pressure during lateral movement with different rates of loading is shown in Fig. 15. When the pipe starts moving, the excess
pore water pressure instantly increases and reaches a plateau, however; less excess pore water pressure is generated as the pipe
and is dragged faster. On the other hand, the resistance stresses at the interface of the pipe is reversely related to the pore water
pressure, which is very similar to the effective stress when the growth of the pore water pressure decreases. Therefore, the
increase of the loading rate will also increase the maximum lateral resistance.
Fig. 15 Variation of excess pore water pressure during lateral movement with different rates of loading
Fig. 16 Effect of pipe size on lateral pipe soil interaction with free end boundaries
3.5. Effect of pipe size
To simulate the impact of different pipe sizes on the behaviour of the lateral pipe-soil interaction, two plastic pipes with a
length of 120 cm and a diameter of 6 cm as a “small pipe” and 21 cm as a “big pipe” were used for this part of the study as
shown in Fig. 16. The experimental test was performed with a constant rate of 0.13 mm/sec in a soil with undrained shear
strength of 0.2 kPa for both small and big pipes. The small pipe reached the maximum lateral resistance of 25 N at a small
displacement of 250 mm. However, the big pipe gradually reached the maximum lateral resistance of 138 N at a displacement
of 800 mm or 380 % of the pipe diameter (3.8 D) and no breakout resistance was observed. The maximum lateral resistance of
the pipe with larger diameter is higher since the pipe has more weight and penetration, hence; extra force is required to start
moving.
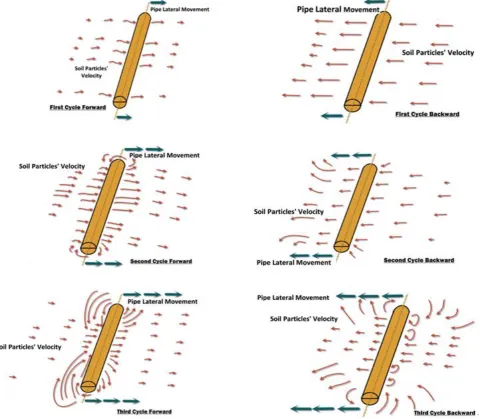
3.6. Influenced area of soil
To study the influence of cyclic loading on the influenced area of surrounding soil, a plastic pipe with a length of 120 cm
and a diameter of 21 cm has a dead load of 125 N/m and was tested under a displacement rate of 0.13 mm/sec for this part of the
analysis. The test was performed in three full cycles, each full cycle includes one forward and one backward movement. In the
at the second and third cycles, the soil particles reveal a complicated behaviour and the area of the disturbed soil increases as
shown in Fig. 17. By employing CRGS, the surface displacement field of the soil particles was achieved as shown in Fig. 18.
Such complicated behaviour is expected to happen because the soft soil is losing strength with the repeated cyclic loading. In
addition, it is anticipated that the pipeline exhibits more movements with more cyclic loadings. Hence, the joints in the pipeline
are exposed to break over the time since the cyclic loadings weaken the surrounding soil and provide the pipeline mo.
Fig. 17 Gradual increase in the area of influenced (disturbed) soil during lateral loading of pipe
4.
Conclusions
Large-scale model test was effectively instrumented, tested and simulated the real behavior of the lateral pipe-soil
interaction using plastic and metal pipe on ultra-soft soil. In these large-scale laboratory testing; effects of several fundamental
factors such as pipe end condition (fixed, and free), pipeline material, soft soil shear strength, rate of loading, pipe size and
influenced area of soil were examined comprehensively. In addition, cycles of close photogrammetry approaches were applied
through innovated CIGMAT Remote Gridding System (CRGS) to capture soft soil surface displacement field and berm
formation at the vicinity of the pipe. The study has revealed the following outcomes:
(1) The fixed-end boundaries developed more lateral resistance up to 50% compared to the free-end boundaries. As the pipe
starts to move laterally, it was noticed that the berms accumulate in the front of the pipe and possibly more force is needed
to mobilize both of the berm and the pipe.
(2) The maximum resistance of the plastic pipe was 64% more than the steel pipe, as the soil in the plastic pipe interface tends
to stick more rigorously to the pipe since the coefficient of adhesion for the used plastic pipe is higher than the steel pipe.
(3) The ultimate vertical penetration of the fix-end boundary case was almost the same as the free-end boundary in the weak
soil (Su=0.02 kPa). However, in the stiff soil with undrained shear strength of 0.2 kPa, the ultimate vertical penetration of
the fix-end boundary case was 40% more than the free-end boundary case.
(4) With the increase in the soil shear strength for each test, the maximum lateral resistance notably increased by 65% for
medium soil (four times increase in the shear strength) and 124 % for stiff soil (10 times increase in the shear strength).
When the soil becomes stiffer, the lateral resistance boosts since the pipe needs more force to start the movement.
(5) With the increase in the rate of displacement from 0.04 mm/sec to 0.4 mm/sec and 2.1 mm/sec, the maximum lateral
resistance increased by 10% and 29% respectively. When the pipe begins moving, the excess pore water pressure
instantly raises and attains a plateau, however; less excess pore water pressure is produced as the pipe is dragged faster.
(6) The study suggested that the size of the pipe is a key factor in the formation of the maximum lateral resistance. Clearly, the
small pipe with a diameter of 6 cm reached the maximum lateral resistance of 25 N at a small displacement of 250 mm. As
for the big pipe with a diameter of 21 cm gradually reached the maximum lateral resistance of 138 N at a displacement of
800 mm with no breakout resistance.
Acknowledgement
This study was supported by the Center for Innovative Grouting Materials and Technology (CIGMAT), University of
Houston, Houston, Texas, USA. The help of the Professor Vipulanandan and the graduate student Mohammed Sarraf
Joshaghani is highly appreciated.
Conflicts of Interest
The authors declare no conflict of interest.
References
[1] P. J. Guo, and D. F. E. Stolle, “Lateral pipe–soil interaction in sand with reference to scale effect,” Journal of Geotechnical and Geoenvironmental Engineering, vol. 131, no. 3, pp. 338-349, March 2005.
[2] S. Chatterjee, D. J. White, and M. F. Randolph, “Coupled consolidation analysis of pipe–soil interactions,” Canadian Geotechnical Journal, vol. 50, pp. 609-619, June 2013.
[4] M. Salem, and R. El-Sherbiny, “Comparison of measured and calculated consolidation settlements of thick underconsolidated clay,” Alexandria Engineering Journal, vol. 53, pp. 107-117, March 2014.
[5] C. Vipulanandan, and A. M. Raheem, “Characterizing ultra-soft soils and anchor-soil interaction for deepwater
applications,” Proceedings of the Twenty-fifth International Ocean and Polar Engineering Conference Kona, Big Island, Hawaii, USA, pp. 1048-1054, June 2015.
[6] C. Tveramo,“Pipeline walking of high pressure/temperature flow lines,” Master Thesis, Department of Marine Technology, Norwegian University of Science and Technology, 2013.
[7] J. R. Oliveira, M. S. Almeida, M. C. F. Almeida, and R. G. Borges, “Physical modeling of lateral clay-pipe interaction,” Journal of Geotechnical and Geoenvironmental Engineering, vol. 136, no. 7, pp. 950-956, January 2010.
[8] D. A. S. Bruton, M. Bolton, M. Carr, and D. White, “Pipe-soil interaction with flowlines during lateral buckling and pipeline walking - The SAFEBUCK JIP,” Offshore Technology Conference, Curran Associates, Houston, May 2008. [9] M. Y. Fattah, B. S. Zbar, and H. H. M. Al-Kalali, “Experimental study on the effect of embedment depth of buried flexible
pipe subjected to static load,” Global Journal of Engineering Science and Research Management, vol. 2, no. 12, pp. 113-122, December 2015.
[10] Guidelines for the design of buried steel pipe, American Lifelines Alliance (ALA), 2001.
[11] S. Mebarkia, “Effect of high-pressure/high-temperature flow lines and soil interaction on subsea development,” Proceedings of Offshore Technology Conference (OTC 18107), pp. 1-6, May 2006.
[12] Y. Wang, R. Liu, and L. Wang, “Experimental and upper bound analysis of lateral soil resistance for shallow-embedded pipeline in Bohai sand,” ASCE, Journal of Pipeline Systems Engineering and Practice, vol. 9, no. 4, pp. 1-13, June 2018. [13] W. Liu, and A. Liu, “Numerical research on the lateral global buckling characteristics of a high temperature and pressure
pipeline with two initial imperfections,” PLoS ONE, vol. 13, no. 3, March 2018.
[14] A. M. Raheem, C. Vipulanandan, and A. Ayoub, “Shear strength relationship for very soft clayey soils,” Proceeding of CIGMAT Conference and Exhibition, Houston, USA, March 2013.
[15] M. S. Joshaghani, A. M. Raheem, and M. M. R. Mousavi, “Analytical Modeling of Large-Scale Testing of Axial Pipe-Soil Interaction in Ultra-Soft Soil,” American Journal of Civil Engineering and Architecture, vol. 4, no. 3, pp. 98-105, April 2016.
[16] A. M. Raheem, and M. S. Joshaghani, “Modeling of shear strength-water content relationship of ultra-soft clayey soil,” International Journal of Advanced Research, vol. 4, no. 4, pp. 537-545, April 2016.
[17] A. M. Raheem, C. Vipulanandan, and M. S. Joshaghani, “Non-destructive experimental testing and modeling of electrical impedance behavior of untreated and treated ultra-soft clayey soils,” Journal of Rock Mechanics and Geotechnical Engineering, vol. 9, pp. 543-550, April 2017.
Copyright© by the authors. Licensee TAETI, Taiwan. This article is an open access article distributed under the terms and conditions of the Creative Commons Attribution (CC BY-NC) license