VOLUME 38, ARTICLE 5, PAGES 127
,
154
PUBLISHED 10 JANUARY 2018
http://www.demographic-research.org/Volumes/Vol38/5/ DOI: 10.4054/DemRes.2018.38.5
Research Article
Integrating occupations: Changing occupational
sex segregation in the United States from
2000 to 2014
Patricia A. Roos
Lindsay M. Stevens
© 2018 Patricia A. Roos & Lindsay M. Stevens.
This open-access work is published under the terms of the Creative Commons Attribution 3.0 Germany (CC BY 3.0 DE), which permits use, reproduction, and distribution in any medium, provided the original author(s) and source are given credit.
1 Introduction 128
2 Historical trends in feminization and masculinization 129
3 The ‘how’ of integration 130
4 The unevenness of integration 131
5 Data and methods 132
5.1 Data 132
5.2 Variables 134
6 Analysis 135
6.1 Changing occupational integration, 2000 to 2014 135 6.2 The social demography of feminizing and masculinizing occupations 141 6.3 Who works in feminizing vs. masculinizing occupations? 143
7 Discussion 147
8 Acknowledgements 150
Integrating occupations:
Changing occupational sex segregation in the United States
from 2000 to 2014
Patricia A. Roos1
Lindsay M. Stevens2
Abstract
BACKGROUND
Declining occupational sex segregation in the late 20th century helped to usher in unprecedented occupational and economic advancement for women. As the 21st century dawned, that advancement stalled.
OBJECTIVE
We examine how occupational integration occurred in the early decades of the 21st century by focusing on (1) the extent of occupational feminization and masculinization and (2) occupational succession. More broadly we examine how the representation of women in detailed occupational categories changed between 2000 and 2014, regardless of whether they were historically ‘male’ or ‘female,’ and how sociodemographic characteristics contributed to uneven shifts in occupational integration.
METHODS
We use Integrated Public Use Microdata Series data to estimate the percentage point female at the detailed occupation level, specifically the 5% census microdata sample for 2000, and two 1% American Community Survey (ACS) samples for 2013 and 2014.
RESULTS
Despite a stall in overall integration, there was much fluctuation within detailed occupations. Moreover, occupational inroads have been uneven in the post-2000 period. Women gained entry into the same types of professional and managerial occupations they entered between 1970 and 2000, especially in the health professions. Men increased their representation in lower-level, nonprofessional occupations.
1 Corresponding author. Department of Sociology, Rutgers University, New Brunswick, USA.
Email:[email protected].
CONTRIBUTION
Rather than focus solely on predominantly male or female occupations, we focus more broadly on how occupations feminize and masculinize. More occupations masculinized than previously. Moreover, those in feminizing occupations are more likely to be advantaged (e.g., white, citizens, and educated), while those in masculinizing occupations are more likely to be disadvantaged (e.g., black, Hispanic, and poor English speakers).
1. Introduction
Researchers, policy makers, and the general public have long been interested in why women and men continue to work in such different occupations. Stark occupational segregation by sex has endured for as long as statistics have been kept. We remain interested in this topic because occupational sex segregation is shorthand for gender inequity in women’s opportunities, both occupationally and economically. It was not until the 1970s that overall sex segregation began to decline in any substantial way. That decline continued more slowly in the 1980s and 1990s due in large measure to women’s inroads into traditionally male occupations, especially in professional and managerial fields. Occupational integration has long been seen as a boon for women’s occupational and economic advancement (Cohen 2013; Hegewisch and Hartmann 2014; Mandel 2013; Reskin and Roos 1990). Indeed, Blau and Kahn (2016) argue that gender differences in occupational distribution remain the most important explanation for the remaining wage gap.
As the new century dawned, researchers began to report on a stall in overall occupational sex desegregation, relying for the most part on indexes of dissimilarity (Cotter, Hermsen, and Vanneman 2004, 2009; Cohen, Huffman, and Knauer 2009; England 2010; Hegewish and Hartmann 2014; Tomaskovic-Devey et al. 2006).3 For example, from 1950 to 1990 there were steep declines in occupational segregation: The indexes declined from 60.8 to 48.4. Between 1990 and 2000 there was a smaller decline, from 48.4 to 46.6, meaning that by 2000 about 47% of workers would need to switch occupations for men and women to be represented equally (Cotter, Hermsen, and Vanneman 2004: Table 6).
We know substantially less about what has happened since the stall began, although this recent period is of great interest to the popular press (e.g., Dewan and
3Researchers focus on multiple types of stalls when discussing trends in gender inequality (e.g., in labor force
Gebeloff 2012; Miller 2017). In this paper, we explore how sex integration shifted in recent decades. Rather than using indexes of dissimilarity, we follow a different tradition in integration research, focusing on how the representation of women in detailed occupational categories changed between 2000 and 2014 (e.g., Reskin and Roos 1990). Traditionally, researchers have studied predominantly male occupations that feminized. We examine masculinization as well. More broadly, we examine how occupations shifted to become more or less segregated by sex, regardless of whether those occupations were initially ‘male’ or ‘female.’ We also examine how the integration occurred by focusing on its unevenness, specifically by sociodemographic characteristics such as race and immigrant status (e.g., Dill, Price-Glynn, and Rakovski 2016; Gatta and Roos 2005). With these foci we examine sex integration in process.
2. Historical trends in feminization and masculinization
Since the 1970s, significant changes in occupational structure, and culture and attitudes more broadly (e.g., Coontz 2011), increased women’s representation in the labor force, and increased their inroads into male occupations (Hegewisch and Hartmann 2014; Mandel 2013; Reskin and Roos 1990). At the aggregate level, by 1970 women made up 38% of the workforce. By 1980, their overall percentage increased by 4.6% (to 42.6%), and another 2.4% by 1988 (to 45%; Reskin and Roos 1990: Table 1.6). Mandel (2013: Table 1) finds that increased female representation between 1970 and 2007 reflected their inroads into high-paid occupations: By 2007 their representation in the top wage decile was nearly equal to men’s. Our data shows that between 2000 and 2014, women’s representation at the aggregate level slowed to less than one half of one percentage point (+.35%), from 47.93 to 48.28%, another form of stall.
In the 1970 to 1990 period, occupational feminization occurred more frequently than masculinization (occupations disproportionately increasing vs. decreasing their representation of women respectively). Reskin and Roos (1990: Table 1.6) show that 33 traditionally male occupations (>60% male in 1970) feminized disproportionately between 1970 and 1980. In contrast, only three traditionally female occupations (>60% female in 1970) masculinized disproportionately.4 Following a similar logic for mixed-sex occupations, Gatta and Roos (2005: Table II) find that 37 occupations feminized
4 Reskin and Roos’s (1990) figures are calculated using a detailed occupational classification comparable
disproportionately between 1970 and 1990, nine remained stable, and only four disproportionately masculinized.5
Because most of the occupational sex integration that occurred between 1970 and 1990 was women moving into traditionally male occupations, researchers focus on the conditions, barriers, and stimuli to women’s advancement in these occupations (e.g., Reskin and Roos 1990). Other researchers (e.g., Williams 1993) examine male entry into female occupations, especially the female professions. Here we study broader processes of feminization and masculinization across the occupational spectrum, not just predominantly male occupations that feminized or predominantly female occupations that masculinized.
3. The ‘how’ of integration
As noted, we follow in the tradition of integration research that uses change in occupational percentage point female to demonstrate how feminization and masculinization occur. Relying on a set of case studies of traditionally male occupations that feminized in the 1970s, Reskin and Roos (1990) posit a dual queuing approach to demonstrate how occupational integration operates, addressing issues of both supply and demand. Although their main interest was in explaining occupational feminization, their logic holds for masculinization as well. Importantly, they describe the changing representation of women in the context of occupational succession, or how occupational integration was patterned by sex, race, and immigrant status. For example, they describe how in the 1800s Irish men replaced native white women in the United States textile mills as the latter moved to middle-class jobs like teaching that white men were leaving. Cigar making also shifted from female to male and back to female again, as the location of work shifted from home to the factory, and from less to more skilled, and back to less skilled again (page 15). Also focusing on a historical view, Branch (2011) describes how structural mechanisms led to variations in integration by race, sex, and class. Using an intersectional lens, she demonstrates how employers relied on a “hierarchy of preferences” to choose among race and sex groups.
In their study of mixed occupations (those between 45% and 55% female in 1990), Gatta and Roos (2005: 370) demonstrate the theoretical usefulness of studying how “nominally integrated” occupations increased or decreased their representation of women. Their findings show that “paths to equity” vary within currently mixed occupations: Some integrated occupations feminized between 1970 and 1990, and a much smaller number masculinized or remained stable (2005: Table II). They also
5 Gatta and Roos (2005) use the same data and classification as Reskin and Roos, for 1970, 1980, and 1990.
addressed occupational succession, demonstrating empirically how occupational integration was patterned by race, immigration status, and other sociodemographic characteristics.
4. The unevenness of integration
Much of the rich research on the unevenness of integration addresses occupational choice, a focus not possible with our data. Instead we examine how occupational outcomes are patterned by race and other sociodemographic characteristics. Such sociodemographic unevenness suggests that it is important to examine more recent data, and to do so in an intersectional way (e.g., Browne and Misra 2003; McCall 2005).
Our data demonstrates that women's representation in the labor force only increased by +.35% between 2000 and 2014. As Reskin and Maroto (2011: 82) argue, “It makes sense to look at which groups advanced most and least and in what sectors.” This unevenness in sex integration suggests that the observed stall at the aggregate level will likely vary across occupations. Accordingly, we examine the extent to which women’s representation shifts at the detailed occupational level. We expect to see variation by race and other sociodemographic characteristics (e.g., citizenship, immigrant status, English language proficiency, and poverty), similar to those Gatta and Roos (2005) find for earlier years. Researchers demonstrate the importance of demographic factors other than gender on occupational mobility. Alegria and Branch (2015) show that focusing solely on gender oversimplifies the role of race and immigrant status on career success in US STEM fields. Dill, Price-Glynn, and Rakovski (2016) demonstrate the importance of racial/ethnic status on men’s participation in predominantly female direct health care work. Finally, Cotter, Hermsen, and Vanneman (2004) confirm variation across race/ethnic groups in occupational integration.
We expect feminization of traditionally male professions to continue, reflecting declines in sex gaps in education and experience. Using data for 1980 to 2010, Blau and Kahn (2016) find that women increased both their educational attainment and their labor market experience relative to men. Indeed, by 2011, women’s average level of schooling was higher than men’s, and they were more likely than men to have at least an advanced degree (page 4; see also Buchmann, DiPrete, and McDaniel 2008).
1; see also Dill, Price-Glynn, and Rakovski 2016). Although these employment declines in middle-skill occupations were substantially greater for women than men (Autor 2010: 10), women were more likely to move from middle- to high-skill occupations, while men moved to the “tails of the distribution,” especially low-skill occupations. These findings illustrate the hollowing out of the middle class (Kalleberg 2009, 2011; Williams 2013), suggesting continued shifts of educated women into professional occupations and men into low-skill occupations.
We address two research questions. First, does the stall in sex integration at the aggregate level persist throughout the occupational structure? We examine which detailed occupations disproportionately feminized and masculinized between 2000 and 2014 and whether earlier patterns of integration continued or shifted over time. Second, we examine occupational succession, specifically focusing on the social demography of occupational change: Who works in feminizing and masculinizing occupations respectively? By focusing broadly we are able to identify sex integration in process, even if those occupations have not yet shifted their composition to predominantly male or female occupations, and indeed perhaps never will.
5. Data and methods
5.1 Data
We examine changing occupational sex segregation from 2000 to 2014 using microdata for detailed occupational categories available from Integrated Public Use Microdata Series (IPUMS)(Ruggles et al. 2015;https://usa.ipums.org/usa/sda/). For 2000, we use the 5% census microdata sample. To generate a sufficient sample size for 2014, we combined two 1% American Community Survey (ACS) samples, 2013 and 2014, referring to the two latter as 2014.
With respect to sample selection, we use all those for whom a detailed occupational code was available.6 The age range for this selection was 16 to 93 in 2000, and 16 to 96 in 2014. We weighted our analyses by the recommended IPUMS weight variable (perwt for 2000, and perwt/2 for 2013/2014). We spent considerable time assessing the comparability between the 2000 and 2014 detailed occupational classifications and created a comparable four-digit code (occ2014).7 We feel confident in our comparisons, given that all the occupational classifications are based on detailed US data.
Our analytic strategy presents data at both the occupational and individual levels addressing our two research questions. In Table 1 we examine which detailed occupations disproportionately shifted their sex composition between 2000 and 2014. To compare our findings with previous decades, we calculated the detailed occupation’s sex type in 2000. This variable was coded ‘male’ when the percent female in 2000 was less than 40%, ‘mixed’ when it was inclusive 40%–60%, and ‘female’ when it was greater than 60%. We then address the social demography of occupational change: Who works in feminizing vs. masculinizing occupations?8 We estimate descriptive statistics for occupational characteristics typically addressed in analyses of this sort, and determine if these vary by feminizing, stable, and masculinizing occupations (Table 2). Turning to individual-level data, we then estimate a logistic regression to determine which sociodemographic characteristics lead to masculinization and which to feminization between 2000 and 2014 (Tables 3 and 4). Our estimates are calculated for samples with no missing values on included variables.
6There are two exceptions to this general rule: (1) we excluded anyone who was unemployed with no work
experience in the last five years or earlier or never worked, and (2) we excluded anyone in occupations that could not be made comparable between 2000 and 2014.
7 We were successful in creating an occupational classification with a large number of comparable codes
(n=448), with 475 codes in 2000, and 478 codes in 2014. An appendix that shows our decision making is available upon request. We specify the 2000 codes and names, the 2014 codes and names, our new code based on the 2014 OCC code (“occ2014”), the percentage female for each year calculated with occ2014 codes, and the change in percentage female between 2000 and 2014. We use several reference documents to create “occ2014”:https://usa.ipums.org/usa/resources/codebooks/2000_PUMS_codebook.pdf,https://usa.ipu ms.org/usa/volii/occ_acs.shtml, andhttps://usa.ipums.org/usa/volii/acs_occtooccsoc.shtml.
8We use ‘feminized’ and ‘masculinized’ to refer to changing occupational sex composition (e.g., ‘sex type’),
5.2 Variables
Our first order of business was to calculate a measure of occupational integration, which we use as our major differentiating independent variable in Table 2, and then as a dependent variable in Tables 3 and 4. We first coded whether the respondents were in occupations that feminized, remained stable, or masculinized between 2000 and 2014, and then aggregated individuals into occupations. As noted, we determined whether an occupation masculinized or feminized by looking at the overall change in female representation between 2000 and 2014: We coded a person as being in a masculinizing occupation when the representation of women declined by at least four percentage points and as being in a feminizing occupation when the representation of women increased by at least four percentage points. All other occupations were labeled as stable. We chose a four-percentage-point cutoff, which was approximately ten times the overall change of +.35%.9 For the descriptive analysis, we use the three-category integration variable (Table 2). We simplified the multivariate analysis (Tables 3 and 4) by looking only at those occupations that changed disproportionately. Thus we recoded integration as 1 for those in a masculinizing occupation and 0 for those in a feminizing occupation.
We chose other variables that were both available in the data and that researchers typically examine. We focus on race and immigrant status, but look more broadly at a range of demographic and work variables. We use these as dependent variables in the descriptive analysis (to determine how occupational integration affected occupational characteristics in 2014), and as independent variables in the multivariate analysis (to determine at the individual level how occupational characteristics predict placement in masculinizing vs. feminizing occupations in 2014). Several variables were coded 0/1: Hispanic, citizen, foreign-born, poor English speaking ability, poverty, professional/manager work, worked for wages during reference day/week (vs. self-employed), usually worked 35 or more hours per week in the previous year, and worked 50 to 52 weeks in the previous year (see Tables 3 and 4). Age was coded in years. Three variables were recoded and estimated as dummy variables: (1) marital status (married – spouse present [the reference category], formerly married/separated, and never married); (2) race (white [the reference category], black, and other [including those who
9We chose the criterion of 4% to be consistent with how previous researchers define ‘disproportionate.’
indicate multiple races]); and (3) education (less than high school, high school or some college, and four years or more of college [reference category]). Measurement is self-explanatory in the variable name, as indicated on the tables.
To examine the unevenness of integration by race and sex, we undertook an intersectional analysis. We conducted multivariate analyses within sex, predicting sex integration (Tables 3 and 4). We considered creating dummy variables for race–sex groups (e.g., white women, black women, and other race men) or dummy variables for race–sex–Hispanic groups (e.g., white Hispanic women, black non-Hispanic men, and other race Hispanic women). Such comparisons would quickly get cumbersome (e.g., six dummy variables for the first set and 12 in the second) and indeed would not present the most substantively interesting comparisons. Instead, like Williams and Villemez (1993) and Dill, Price-Glynn, and Rakovski (2016), we use race and other characteristics to predict which men (and then women) are in masculinizing vs. feminizing occupations.
6. Analysis
6.1 Changing occupational integration, 2000 to 2014
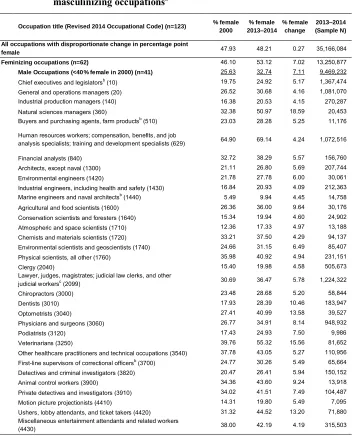
Table 1: Occupations with disproportionate change in percentage point female between 2000 and 2013‒2014, organized by feminizing and masculinizing occupationsa
Occupation title (Revised 2014 Occupational Code) (n=123) % female 2000
% female 2013‒2014
% female change
2013‒2014 (Sample N) All occupations with disproportionate change in percentage point
female 47.93 48.21 0.27 35,166,084 Feminizing occupations (n=62) 46.10 53.12 7.02 13,250,877
Male Occupations (<40 % female in 2000) (n=41) 25.63 32.74 7.11 9,469,232
Chief executives and legislatorsb (10) 19.75 24.92 5.17 1,367,474
General and operations managers (20) 26.52 30.68 4.16 1,081,070
Industrial production managers (140) 16.38 20.53 4.15 270,287
Natural sciences managers (360) 32.38 50.97 18.59 20,453
Buyers and purchasing agents, farm productsb (510) 23.03 28.28 5.25 11,176
Human resources workers; compensation, benefits, and job
analysis specialists; training and development specialists (629) 64.90 69.14 4.24 1,072,516
Financial analysts (840) 32.72 38.29 5.57 156,760
Architects, except naval (1300) 21.11 26.80 5.69 207,744
Environmental engineers (1420) 21.78 27.78 6.00 30,061
Industrial engineers, including health and safety (1430) 16.84 20.93 4.09 212,363 Marine engineers and naval architectsb (1440) 5.49 9.94 4.45 14,758
Agricultural and food scientists (1600) 26.36 36.00 9.64 30,176
Conservation scientists and foresters (1640) 15.34 19.94 4.60 24,902
Atmospheric and space scientists (1710) 12.36 17.33 4.97 13,188
Chemists and materials scientists (1720) 33.21 37.50 4.29 94,137 Environmental scientists and geoscientists (1740) 24.66 31.15 6.49 85,407
Physical scientists, all other (1760) 35.98 40.92 4.94 231,151
Clergy (2040) 15.40 19.98 4.58 505,673
Lawyer, judges, magistrates; judicial law clerks, and other
judicial workersc (2099) 30.69 36.47 5.78 1,224,322
Chiropractors (3000) 23.48 28.68 5.20 58,844
Dentists (3010) 17.93 28.39 10.46 183,947
Optometrists (3040) 27.41 40.99 13.58 39,527
Physicians and surgeons (3060) 26.77 34.91 8.14 948,932
Podiatrists (3120) 17.43 24.93 7.50 9,986
Veterinarians (3250) 39.76 55.32 15.56 81,652
Other healthcare practitioners and technical occupations (3540) 37.78 43.05 5.27 110,956 First-line supervisors of correctional officersb (3700) 24.77 30.26 5.49 65,664 Detectives and criminal investigators (3820) 20.47 26.41 5.94 150,152
Animal control workers (3900) 34.36 43.60 9.24 13,918
Private detectives and investigators (3910) 34.02 41.51 7.49 104,487
Motion picture projectionists (4410) 14.31 19.80 5.49 7,095
Ushers, lobby attendants, and ticket takers (4420) 31.32 44.52 13.20 71,880 Miscellaneous entertainment attendants and related workers
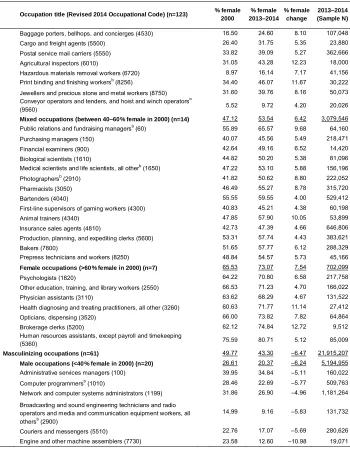
Table 1: (Continued)
Occupation title (Revised 2014 Occupational Code) (n=123) % female 2000
% female 2013‒2014
% female change
2013‒2014 (Sample N)
Baggage porters, bellhops, and concierges (4530) 16.50 24.60 8.10 107,048
Cargo and freight agents (5500) 26.40 31.75 5.35 23,880
Postal service mail carriers (5550) 33.82 39.09 5.27 362,666
Agricultural inspectors (6010) 31.05 43.28 12.23 18,000
Hazardous materials removal workers (6720) 8.97 16.14 7.17 41,156 Print binding and finishing workersb (8256) 34.40 46.07 11.67 30,222 Jewellers and precious stone and metal workers (8750) 31.60 39.76 8.16 50,073 Conveyor operators and tenders, and hoist and winch operatorsb
(9560) 5.52 9.72 4.20 20,026
Mixed occupations (between 40‒60% female in 2000) (n=14) 47.12 53.54 6.42 3,079,546 Public relations and fundraising managersb (60) 55.89 65.57 9.68 64,160
Purchasing managers (150) 40.07 45.56 5.49 218,471
Financial examiners (900) 42.64 49.16 6.52 14,420
Biological scientists (1610) 44.82 50.20 5.38 81,096
Medical scientists and life scientists, all otherb (1650) 47.22 53.10 5.88 156,196
Photographersb (2910) 41.82 50.62 8.80 222,052
Pharmacists (3050) 46.49 55.27 8.78 315,720
Bartenders (4040) 55.55 59.55 4.00 529,412
First-line supervisors of gaming workers (4300) 40.83 45.21 4.38 60,198
Animal trainers (4340) 47.85 57.90 10.05 53,899
Insurance sales agents (4810) 42.73 47.39 4.66 646,806
Production, planning, and expediting clerks (5600) 53.31 57.74 4.43 383,621
Bakers (7800) 51.65 57.77 6.12 288,329
Prepress technicians and workers (8250) 48.84 54.57 5.73 45,166
Female occupations (>60 % female in 2000) (n=7) 65.53 73.07 7.54 702,099
Psychologists (1820) 64.22 70.80 6.58 217,758
Other education, training, and library workers (2550) 66.53 71.23 4.70 166,022
Physician assistants (3110) 63.62 68.29 4.67 131,522
Health diagnosing and treating practitioners, all other (3260) 60.63 71.77 11.14 27,412
Opticians, dispensing (3520) 66.00 73.82 7.82 64,864
Brokerage clerks (5200) 62.12 74.84 12.72 9,512
Human resources assistants, except payroll and timekeeping
(5360) 75.59 80.71 5.12 85,009
Masculinizing occupations (n=61) 49.77 43.30 ‒6.47 21,915,207 Male occupations (<40 % female in 2000) (n=20) 26.61 20.37 ‒6.24 5,194,955
Administrative services managers (100) 39.95 34.84 ‒5.11 160,022
Computer programmersb (1010) 28.46 22.69 ‒5.77 509,763
Network and computer systems administrators (1199) 31.86 26.90 ‒4.96 1,181,264
Broadcasting and sound engineering technicians and radio operators and media and communication equipment workers, all othersb (2900)
14.99 9.16 ‒5.83 131,732
Couriers and messengers (5510) 22.76 17.07 ‒5.69 280,626
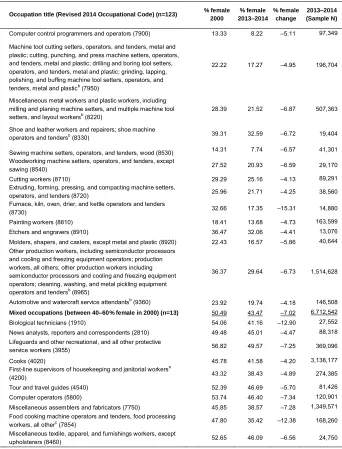
Table 1: (Continued)
Occupation title (Revised 2014 Occupational Code) (n=123) % female 2000 % female 2013‒2014 % female change 2013‒2014 (Sample N)
Computer control programmers and operators (7900) 13.33 8.22 ‒5.11 97,349
Machine tool cutting setters, operators, and tenders, metal and plastic; cutting, punching, and press machine setters, operators, and tenders, metal and plastic; drilling and boring tool setters, operators, and tenders, metal and plastic; grinding, lapping, polishing, and buffing machine tool setters, operators, and tenders, metal and plasticb (7950)
22.22 17.27 ‒4.95 196,704
Miscellaneous metal workers and plastic workers, including milling and planing machine setters, and multiple machine tool
setters, and layout workersb (8220) 28.39 21.52 ‒6.87 507,363
Shoe and leather workers and repairers; shoe machine
operators and tendersb (8330) 39.31 32.59 ‒6.72 19,404
Sewing machine setters, operators, and tenders, wood (8530) 14.31 7.74 ‒6.57 41,301 Woodworking machine setters, operators, and tenders, except
sawing (8540) 27.52 20.93 ‒6.59 29,170
Cutting workers (8710) 29.29 25.16 ‒4.13 89,291
Extruding, forming, pressing, and compacting machine setters,
operators, and tenders (8720) 25.96 21.71 ‒4.25 38,560
Furnace, kiln, oven, drier, and kettle operators and tenders
(8730) 32.66 17.35 ‒15.31 14,880
Painting workers (8810) 18.41 13.68 ‒4.73 163,599
Etchers and engravers (8910) 36.47 32.06 ‒4.41 13,076
Molders, shapers, and casters, except metal and plastic (8920) 22.43 16.57 ‒5.86 40,644 Other production workers, including semiconductor processors
and cooling and freezing equipment operators; production workers, all others; other production workers including semiconductor processors and cooling and freezing equipment operators; cleaning, washing, and metal pickling equipment operators and tendersb (8965)
36.37 29.64 ‒6.73 1,514,628
Automotive and watercraft service attendantsb (9360)
23.92 19.74 ‒4.18 146,508
Mixed occupations (between 40‒60% female in 2000) (n=13) 50.49 43.47 ‒7.02 6,712,542
Biological technicians (1910) 54.06 41.16 ‒12.90 27,552
News analysts, reporters and correspondents (2810) 49.48 45.01 ‒4.47 88,318 Lifeguards and other recreational, and all other protective
service workers (3955) 56.82 49.57 ‒7.25 369,096
Cooks (4020) 45.78 41.58 ‒4.20 3,138,177
First-line supervisors of housekeeping and janitorial workersb
(4200) 43.32 38.43 ‒4.89 274,385
Tour and travel guides (4540) 52.39 46.69 ‒5.70 81,426
Computer operators (5800) 53.74 46.40 ‒7.34 120,901
Miscellaneous assemblers and fabricators (7750) 45.85 38.57 ‒7.28 1,349,571 Food cooking machine operators and tenders, food processing
workers, all otherc (7854) 47.80 35.42 ‒12.38 168,260
Miscellaneous textile, apparel, and furnishings workers, except
Table 1: (Continued)
Occupation title (Revised 2014 Occupational Code) (n=123) % female 2000
% female 2013‒2014
% female change
2013‒2014 (Sample N)
Inspectors, testers, sorters, samplers, and weighers (8740) 47.68 39.35 ‒8.33 1,004,284 Photographic process workers and processing machine
operators (8830) 59.00 54.47 ‒4.53 52,782
Adhesive bonding machine operators and tendersb (8850) 47.84 42.41 ‒5.43 13,040
Female occupations (>60 % female in 2000) (n=28) 72.21 66.05 ‒6.16 10,007,710 Claims adjusters, appraisers, examiners, and investigators (540) 64.96 60.05 ‒4.91 334,030
Credit analysts (830) 63.35 58.67 ‒4.68 30,256
Religious workers, all other (2060) 63.19 59.17 ‒4.02 101,315
Radiation therapists (3200) 72.31 64.79 ‒7.52 18,634
Physical therapist assistants and aides (3620) 76.11 71.44 ‒4.67 92,273
Crossing guards (3940) 63.59 56.20 ‒7.39 85,226
Transportation attendants (4550) 79.70 74.12 ‒5.58 137,234
Residential advisors (4640) 67.17 60.39 ‒6.78 101,390
Counter and rental clerks (4740) 61.55 54.06 ‒7.49 118,672
Models, demonstrators, and product promoters (4900) 80.27 70.01 ‒10.26 114,274 First-line supervisors/managers of office and administrative
support workersb (5000) 67.84 62.46 ‒5.38 1,573,769
Procurement clerks (5150) 64.78 59.36 ‒5.42 41,916
Tellers (5160) 89.84 85.43 ‒4.41 470,665
Credit authorizers, checkers, and clerks (5230) 78.25 72.73 ‒5.52 53,096 Customer service representatives (5240) 71.02 66.59 ‒4.43 3,323,067
File clerks (5260) 79.56 74.23 ‒5.33 438,820
Loan interviewers and clerks (5330) 85.52 78.47 ‒7.05 145,375
New account clerks (5340) 84.86 76.09 ‒8.77 17,669
Correspondence clerks and order clerks (includes 5210)b (5350) 65.11 60.96 ‒4.15 164,699 Reservation and transportation ticket agents and travel clerks
(5410) 67.18 60.67 ‒6.51 153,952
Data entry keyers (5810) 81.78 76.53 ‒5.25 489,846
Word processors and typists (5820) 91.91 86.02 ‒5.89 448,222
Statistical assistants (5920) 67.78 61.12 ‒6.66 25,078
Electrical, electronics, and electromechanical assemblers (7720) 61.10 48.68 ‒12.42 174,016
Sewing machine operators (8320) 81.24 76.58 ‒4.66 264,785
Textile winding, twisting, and drawing out machine setters,
operators, and tenders (8420) 66.71 61.94 ‒4.77 15,955
Packaging and filling machine operators and tenders (8800) 61.61 55.50 ‒6.11 366,595
Packers and packagers, hand (9640) 63.56 57.07 ‒6.49 706,881
a Feminizing occupations are those in which the percentage point change in the representation of women increased by at least 4% from 2000 to 2014.
Masculinizing occupations are those in which the percentage point change in the representation of women decreased by at least 4% from 2000 to 2014.
b The titles in 2000 and 2014 were different; we used the 2014 title. cWe created a new title.
percentage points) and masculinizing occupations (a decrease in the representation of women by at least 4 percentage points). We further subdivided each into occupations that were initially male in 2000 (<40% female), mixed (40%‒60% female), and female (>60% female). This presentation allows us to determine which occupations feminized and which masculinized by initial sex type.10
The first thing to note is that unlike the post-1970 period, approximately equal numbers of occupations feminized (n = 62) as masculinized (n = 61). This suggests a level of flux that one might not expect if we assume a stall in overall occupational integration. To assess how many persons are in disproportionately feminizing and masculinizing occupations, we include in Table 1 the number of persons employed in each detailed occupation in 2014. The data shows that 35,166,084 people worked in the 123 disproportionately changed occupations, 37.7% in feminizing occupations and 62.3% in masculinizing occupations. Thus, while approximately equal numbers of occupations feminized as masculinized, many more persons in disproportionate occupations were in masculinizing than feminizing occupations. It’s also important to recognize that most persons in 2014 were not in disproportionately changing occupations: Although approximately one-quarter of all detailed occupations changed disproportionately, 19% of all persons were in disproportionately changing occupations, compared with 81% in stable occupations.
Our feminizing male occupations (n = 41) are comparable to the 33 feminizing occupations in Reskin and Roos’s (1990) Table 1.6. Another set of mixed occupations (n = 14) feminized as well, and seven female occupations further feminized. From 2000 to 2014, women continued to make inroads into traditionally male professions and managerial occupations, a process similar to that occurring in the 1970s. The female surge into health-related professions between 2000 and 2014 extends the inroads women made into pharmacy in the 1970s and 1980s (Phipps 1990). Indeed, by 2000 pharmacy was a mixed occupation that further feminized by 2014. Other health professions feminized: Dentists, optometrists, and veterinarians all increased their representation of women by over 10%, and chiropractors, physicians and surgeons, podiatrists, and other health-diagnosing and treating practitioners by over 5%. These gains reflect in part women’s increased representation in postgraduate education (Blau and Kahn 2016; Buchmann, DiPrete, and McDaniel 2008). Despite their inroads between 2000 and 2014, however, by the latter year women were the majority sex in the health professions only among veterinarians (55% female in 2014).
A few other non-health occupations showed gains: Among feminizing male occupations, natural sciences managers; ushers, lobby attendants, and ticket takers;
10 It also allows easier comparisons with Reskin and Roos’s (1990) Table 1.6, which includes sex segregated
agricultural inspectors; and print binding and finishing workers all showed gains of at least 10%. Among feminizing mixed occupations, only animal trainers increased by at least 10%. Finally, two traditionally female occupations feminized by at least 10% (health diagnosing and treating practitioners and brokerage clerks).
Table 1 clearly supports previous findings that women have not made inroads into skilled or semiskilled production work (England 2010). Male blue-collar work11 that disproportionately changed typically masculinized, not feminized: Of the 32 disproportionately changing blue-collar occupations, only six feminized.
In comparison with Reskin and Roos's (1990) findings, the sheer number of masculinizing female occupations increased (n = 28 vs. Reskin and Roos’s three occupations), although it is important to point out that initially male and mixed occupations masculinized as well (n = 20 and n = 13 respectively). Only two female occupations masculinized by at least 10%: (1) models, demonstrators, and product promoters and (2) electrical, electronics, and electromechanical assemblers (and it’s only in the latter that the 2014 female percentage falls below 50%). The female occupations that masculinized contain no professional occupations, which is further evidence that men are not making large inroads into what have often been called the female professions (e.g., teaching, social work, nursing, and librarianship).12
6.2 The social demography of feminizing and masculinizing occupations
We turn to our second research question, on occupational succession: What is the social demography of occupational integration? Since our major independent variable for this initial analysis is integration status (feminizing, stable, and masculinizing) between 2000 and 2014, we focus only on the latter year. Table 2 summarizes our initial descriptive results. We focus on race and immigrant status, but present data more broadly for a selection of variables representing the social and demographic characteristics of the labor force. Our intention here is to be illustrative, not exhaustive.
Looking first at column 1 for all occupations, we see the social and demographic characteristics for the overall workforce. The mean age is 42, and 48% are currently
11 We include in this category occ2014 codes 6200 to 9750: construction and extraction occupations;
installation, maintenance, and repair workers; production occupations; and transportation and material moving occupations.
12We reran Table 1 with a larger cut point (7%, or 20 times the change in percentage point female from 2000
married living with their spouse. Three-quarters of the labor force is white, with substantial percentages of black (12%) and Hispanic (15%). The vast majority are US citizens (92%), with 17% foreign-born. Only 4% speak English not well or not at all, but a troubling 12% are below the poverty level, consistent with recent reports of high levels of inequality in the United States (Jank and Owens 2012). A bit less than one-third (31%) have four or more years of college, 37% work in professional or managerial occupations, 91% work for wages, and approximately two-thirds of workers usually work for wages in reference week and work 50 to 52 weeks last year.
Table 2: Social demographic characteristics of feminizing, stable, and masculinizing occupations, 2014
2014
Variables All occupations Feminizinga Stableb Masculinizingc
Mean age (in years) 42.4 45.7 42.4 40.5
Percent currently married with spouse 48.4 61.2 48.2 41.6
Percent white 75.5 80.6 75.7 70.7
Percent black 11.7 7.5 11.7 14.6
Percent Hispanic 15.4 8.8 15.6 18.6
Percent US citizen 91.8 94.8 91.8 89.8
Percent foreign-born 17.4 15.2 17.3 19.6
Percent speaking English not well or not at all 4.3 1.3 4.2 6.6
Percent below poverty level 12.4 5.7 12.6 15.1
Percent with four or more years of college 30.6 62.8 29.6 17.7
Percent working in professional or managerial
occupations 36.9 73.7 37.2 12.2
Percent working for wages in ref day/week 90.6 85.1 90.1 96.8
Percent usually working 35 or more hours per
week in previous year 66.4 76.6 65.6 66.2
Percent working 50‒52 weeks last year 65.5 75.8 64.9 63.5
aFeminizing occupations are those in which the percentage point change in the representation of women increased by at least 4%
from 2000 to 2014.
b Stable occupations are those in which the percentage point change in the representation of women is less than 4% from 2000 to 2014.
c Masculinizing occupations are those in which the percentage point change in the representation of women decreased by at least 4% from 2000 to 2014.
Note: All proportions reported as percentages for presentation purposes.
number of hours and in weeks worked), and working in professional/managerial occupations. For each of these variables, the percentages are highest for feminizing occupations and decline across the row (e.g., to stable and masculinizing occupations). Masculinizing occupations contain a higher percentage of black, Hispanic, and foreign-born people, those speaking English not at all or not well, working for wages (rather than self-employed), and below the poverty level. For these variables, the highest percentages are in the masculinizing column and decline as one moves to the left (to feminizing occupations).13
6.3 Who works in feminizing vs. masculinizing occupations?
Our final analysis on occupational succession addresses how social demographic characteristics affect who works in feminizing and masculinizing occupations. Thus integration is our dependent variable. The data demonstrates that occupational change is strongly patterned by race and other sociodemographic characteristics. Tables 3 and 4 present results for a logistic regression of occupational integration for 2014. We include in these models only those persons in the 123 occupations that changed disproportionately. We first present the means for our models, separately for total, males, and females (Table 3), and then the multivariate logistic regression estimates, for total, males, and females (Table 4).14
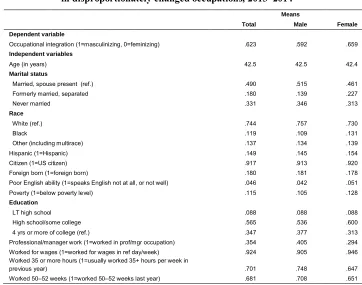
Table 3 shows that workers in disproportionately changing occupations had an average age of 42; approximately 62% worked in masculinizing occupations. The modal marital status was married and living with their spouse (49%), most were citizens (92%), and white (74% of the sample vs. 12% and 14% who were black and other/multiracial respectively). There were sizable minorities who were Hispanic (15%), foreign-born (18%), below poverty (12%), and those with poor English language proficiency (5%). A little over one-third of the sample had four or more years of college (35%), and 35% worked in professional or managerial occupations. A full 92% worked for wages (as opposed to self-employment), 70% usually worked 35 or
13 We reran Table 2 with the 7% cut point for disproportionate occupations, and the results were nearly
identical. The one difference was for percent foreign born: with the 7% cut point, 22% of those in feminizing occupations were foreign born, compared with 19% in masculinizing occupations (the 4% cut point yielded 15% and 20%, respectively).
14Our multivariate analysis is modeled on Gatta and Roos’s (2005) multinomial logit, although we simplify
more hours per week, and 68% worked 50 to 52 weeks in the previous year. Focusing on sex differences, men were more likely than women to be married with their spouse present (52 vs. 46%), have four or more years of college (38 vs. 31%), and work full time (either hourly or weeks worked; 75% vs. 65% and 71% vs. 65% respectively). Women, on the other hand, were more likely than men to be formerly married (23% vs. 14%), to be in poverty (13% vs. 10%), and to be in masculinizing occupations (66% vs. 59%).
Table 3: Means for a model of occupational integration, US men and women in disproportionately changed occupations, 2013‒2014a
Means
Total Male Female Dependent variable
Occupational integration (1=masculinizing, 0=feminizing) .623 .592 .659
Independent variables
Age (in years) 42.5 42.5 42.4
Marital status
Married, spouse present (ref.) .490 .515 .461
Formerly married, separated .180 .139 .227
Never married .331 .346 .313
Race
White (ref.) .744 .757 .730
Black .119 .109 .131
Other (including multirace) .137 .134 .139
Hispanic (1=Hispanic) .149 .145 .154
Citizen (1=US citizen) .917 .913 .920
Foreign born (1=foreign born) .180 .181 .178
Poor English ability (1=speaks English not at all, or not well) .046 .042 .051
Poverty (1=below poverty level) .115 .105 .128
Education
LT high school .088 .088 .088
High school/some college .565 .536 .600
4 yrs or more of college (ref.) .347 .377 .313
Professional/manager work (1=worked in prof/mgr occupation) .354 .405 .294 Worked for wages (1=worked for wages in ref day/week) .924 .905 .946 Worked 35 or more hours (1=usually worked 35+ hours per week in
previous year) .701 .748 .647
Worked 50‒52 weeks (1=worked 50‒52 weeks last year) .681 .708 .651
a Includes only those in occupations whose percentage point representation of women changed disproportionately from 2000 to
2014, either positively by at least 4% (feminizing) or negatively by at least 4% (masculinzing).
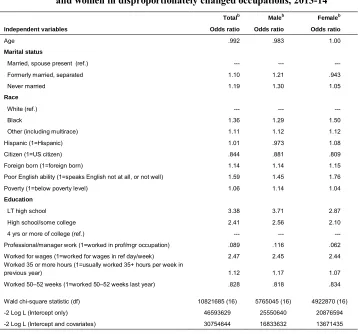
occupations and 0 = feminizing occupations), our odds ratios represent the odds of being in a masculinizing vs. feminizing occupation in 2014. Given the large sample size in the IPUMS data, all of the coefficients are significant (p<.0001).
Table 4: Logistic regression for a model of occupational integration, US men and women in disproportionately changed occupations, 2013-14a
Totalb Maleb Femaleb
Independent variables Odds ratio Odds ratio Odds ratio
Age .992 .983 1.00
Marital status
Married, spouse present (ref.) --- ---
Formerly married, separated 1.10 1.21 .943
Never married 1.19 1.30 1.05
Race
White (ref.) --- ---
Black 1.36 1.29 1.50
Other (including multirace) 1.11 1.12 1.12
Hispanic (1=Hispanic) 1.01 .973 1.08
Citizen (1=US citizen) .844 .881 .809
Foreign born (1=foreign born) 1.14 1.14 1.15
Poor English ability (1=speaks English not at all, or not well) 1.59 1.45 1.76
Poverty (1=below poverty level) 1.06 1.14 1.04
Education
LT high school 3.38 3.71 2.87
High school/some college 2.41 2.56 2.10
4 yrs or more of college (ref.) --- ---
---Professional/manager work (1=worked in prof/mgr occupation) .089 .116 .062
Worked for wages (1=worked for wages in ref day/week) 2.47 2.45 2.44 Worked 35 or more hours (1=usually worked 35+ hours per week in
previous year) 1.12 1.17 1.07
Worked 50–52 weeks (1=worked 50–52 weeks last year) .828 .818 .834
Wald chi-square statistic (df) 10821685 (16) 5765045 (16) 4922870 (16)
-2 Log L (Intercept only) 46593629 25550640 20876594
-2 Log L (Intercept and covariates) 30754644 16833632 13671435
a Includes only those in occupations whose percentage point representation of women changed disproportionately from 2000 to
2014, either positively by at least 4 percent (feminizing) or negatively by at least 4 percent (masculinizing). b
Estimates calculated for the sample with no missing values on included variables. Dependent variable: 1=masculinizing, 0=feminizing.
The multivariate results replicate our descriptive findings. For the total population, those respondents with personal variables typically associated with marginal labor market location are more likely to be in masculinizing occupations (odds ratios greater than 1). Those with characteristics typically associated with higher labor market rewards are more likely to be in feminizing occupations (odds ratios less than 1). Nonwhites (either black or other races) are significantly more likely to be in masculinizing occupations. In comparison to whites, blacks have 1.36 times the odds, and other races 1.11 times the odds, of being in masculinizing occupations. Similarly, those who are foreign-born (OR = 1.14), who have poor English speaking skills (OR = 1.59), or have never married (OR = 1.19, relative to married) are more likely to work in masculinizing occupations. In comparison with college graduates, those with less than a high school diploma or high school/some college are significantly more likely to be in masculinizing occupations (OR = 3.38 and OR = 2.41 respectively). In contrast, citizens, those in professional or managerial work, and those working 50 to 52 weeks per year are more likely to work in feminizing occupations (OR = .844, OR = .089, and OR = .828, respectively). Full-time hours is associated with working in masculinizing occupations (OR = 1.12).
7. Discussion
Our data provides novel insights into how occupational integration unfolded in the beginning decades of the 21st century. We summarize our results here, by returning to our two research questions. First, it’s important to recognize that while a stall in occupational desegregation can exist at the level of the labor market as a whole, there can still be considerable flux in the shifting gender makeup of individual occupations. The 2000 to 2014 period continued some of the feminizing trends we saw in the 1970 to 2000 period, including continuing inroads for women into traditionally male health professions.
We also find that masculinization was more common between 2000 and 2014 than it was in earlier years. Although much of the earlier research on men’s entry into occupations examines the female professions (e.g., nursing, social work, librarianship, and teaching; Lupton 2006; Williams 2013; Wingfield 2009), our data suggests that these were not the occupations that disproportionately masculinized. Instead, men increased their representation in lower status, nonprofessional occupations.15
Second, we examine the social-demographic characteristics of those located in feminizing and masculinizing occupations. The results are unequivocal: Those in feminizing occupations are more likely to be white, US citizens, educated, currently married/with spouse, working in a professional/managerial occupation, and working full time (in hours and weeks worked). Those in masculinizing occupations are more likely to be black, Hispanic, persons speaking English poorly, working for wages (as opposed to self-employed), foreign-born, and in poverty.
Our multivariate results predicting 2014 occupational placement underscore that women have continued their inroads into traditionally male occupations much in the same way that they did in the immediate post-1970 period. What has changed after 2000 is that there is movement toward masculinization as well as feminization. Masculinization, however, is not fueled by the occupational movement of all men. Instead, it occurs among those marginal to the labor market ‒ nonwhites, foreign-born, noncitizens, the less educated, those in poverty, and those with poor English speaking skills.
What conclusions can we draw from our findings and what insights can they provide about occupational integration? As noted, our data cannot speak to the issue of choice, or to the relative importance of egalitarianism-driven vertical vs. essentialism-driven horizontal integration (Charles and Bradley 2009; Charles and Grusky 2004; see
15If the number of years examined were to be broadened beyond 2000 to 2014, there would be a larger
also England 2016). We can only know occupational outcomes in 2000 and 2014, not the choices that got workers to those occupations. Building the historical record, however, adds new data to the long conversation on occupational feminization that gained new momentum in the 1970s.
One aspect of that conversation was whether women’s inroads into male occupations constituted genuine integration, ghettoization, or resegregation (Reskin and Roos 1990: Chapter 3). At any particular point in time, we do not know whether feminization (or masculinization) will continue, reverse, or remain stable. Are feminizing occupations on a path toward genuine integration, will women become ghettoized into fields within feminizing occupations, or will these occupations resegregate as female? We are unable to fully answer these questions. We can say, however, that in most of the feminizing occupations in Table 1, women were not in 2000, and still are not in 2014, equally represented with men. For example, women were 18% of dentists in 2000 and 28% in 2014 (still a male occupation by our terminology). Optometrists were 27% female in 2000, increasing to 41% in 2014 (moving it to a mixed occupation). In pharmacy, women topped 55% by 2014 (still a mixed but perhaps beginning to resegregate as female). Several health professions were already female occupations and continued to further resegregate between 2000 and 2014, including physician assistants (64% to 68%), health diagnosing and treating practitioners (61% to 72%), and opticians (66% to 74%). The only health-care occupation into which men disproportionately increased their representation was radiation therapists, where the percent female declined from 72% to 65% (indicating that it is still clearly a female occupation).
into other health-related professions ‒ findings consistent with women’s increased education levels.
Conversely, Hispanics, nonwhites (relative to whites), those with poor English skills, the foreign-born, those working for wages (vs. self-employed), and those below the poverty line are more likely to be in masculinizing occupations. Our findings are consistent with arguments that addressed the uneven nature of occupational change by examining men’s involuntary movement into the service sector and other feminized labor (Dill, Price-Glynn, and Rakovski 2016; Gatta, Boushey, and Appelbaum 2009). Williams and Villemez (1993) find that some men enter predominantly female professions through a “trap door”: Men facing disadvantages in the labor market (often poor and/or minority) enter less desirable, often feminized, sectors of the labor market. Lupton (2006) finds that middle-class men in the United Kingdom are guided into professional careers by their families, schools, and guidance counselors, while working-class men moved into female professions, like library science, human resources, and elementary education.
Importantly, masculinization is not occurring disproportionately in the female professions, suggesting that a broader application of these researchers’ theories might be called for. Our findings are also consistent with England's (2010) argument that privileged men, unlike their marginalized counterparts, can resist moving into predominantly female occupations, particularly those that are less prestigious (see McCall 2011).
In sum, this research demonstrates the usefulness of focusing on masculinizing occupations, and not just those women making inroads into predominantly male occupations. Occupational feminization was the big story of the 1970s. Now the story has broadened to race and other sociodemographic characteristics and the role they play in sex integration. We have provided a broader picture of recent trends in occupational integration, moving beyond a focus on predominantly male or female occupations, to examine sex integration in process. Our findings illustrate the importance not just of shifts in sex composition, but also of the importance of race, immigrant status, and other sociodemographic characteristics on occupational integration.
8. Acknowledgements
References
Alegria, S.N. and Branch, E.H. (2015). Causes and consequences of inequality in the STEM: Diversity and its discontents.International Journal of Gender, Science and Technology 7(3): 321‒342.
Autor, D. (2010). The polarization of job opportunities in the U.S. labor market [electronic resource]. Washington, D.C.: The Hamilton Project.
http://www.hamiltonproject.org/papers/the_polarization_of_job_opportunities_i
n_the_u.s._labor_market_implica.
Blau, F.D. and Kahn, L.M. (2016). The gender wage gap: Extent, trends, and explanations. Bonn: Institute for Labor (IZA) (IZA discussion paper 9656).
http://ftp.iza.org/dp9656.pdf.
Branch, E.H. (2011). Opportunity denied: Limiting black women to devalued work. New Brunswick: Rutgers University Press.
Britton, D. (2000). The epistemology of the gendered organization. Gender and Society
14(3): 418‒434.doi:10.1177/089124300014003004.
Browne, I. and Misra, J. (2003). The intersection of gender and race in the labor market.
Annual Review of Sociology 29: 487‒513. doi:10.1146/annurev.soc.29.010202. 100016.
Buchmann, C., DiPrete, T.A., and McDaniel, A. (2008). Gender inequalities in education. Annual Review of Sociology 34: 319‒337. doi:10.1146/annurev.soc.
34.040507.134719.
Charles, M. and Bradley, K. (2009). Indulging our gendered selves? Sex segregation by field of study in 44 countries. American Journal of Sociology 114(4): 924‒976.
doi:10.1086/595942.
Charles, M. and Grusky, D. (2004).Occupational ghettos: The worldwide segregation of women and men. Stanford: Stanford University Press.
Cohen, P.N. (2013, November 23). How can we jump-start the struggle for gender equality? New York Times: SR9. https://opinionator.blogs.nytimes.com/2013/ 11/23/how-can-we-jump-start-the-struggle-for-gender-equality/?_r=0
Cotter, D.A., Hermsen, J.M., and Vanneman, R. (2004). Gender inequality at work. New York: Russell Sage Foundation.
Cotter, D.A., Hermsen, J.M., and Vanneman, R. (2009). The stalled gender revolution [electronic resource]. College Park: University of Maryland. http://www.bsos.
umd.edu/socy/vanneman/endofgr/default.html.
Coontz, S. (2011).A strange stirring: The feminine mystique and American women at the dawn of the 1960s. New York: Basic Books.
Dewan, S. and Gebeloff, R. (2012, May 20). More men enter fields dominated by women. New York Times: A1. http://www.nytimes.com/2012/05/21/business/
increasingly-men-seek-success-in-jobs-dominated-by-women.html.
Dill, J.S., Price-Glynn, K., and Rakovski, C. (2016). Does the ‘glass escalator’ compensate for the devaluation of care work occupations? The careers of men in low- and middle-skill health care jobs.Gender and Society 30(2): 334–360. England, P. (2010). The gender revolution: Uneven and stalled. Gender and Society
24(2): 149‒166.doi:10.1177/0891243210361475.
England, P. (2016). Sometimes the social becomes personal: Gender, class, and sexualities. American Sociological Review 81(1): 4‒28. doi:10.1177/00031224
15621900.
Gatta, M.L., Boushey, H., and Appelbaum, E. (2009). High-touch and here to stay: Future skills demands in U.S. low wage service occupations. Sociology 43(5): 968‒989.doi:10.1177/0038038509340735.
Gatta, M.L. and Roos, P.A. (2005). Rethinking occupational integration. Sociological Forum 20(3): 369‒402.doi:10.1007/s11206-005-6594-5.
Hegewisch, A. and Hartmann, H. (2014). Occupational segregation and the gender wage gap: Job half done. Washington, D.C.: Institute for Women’s Policy Research. https://www.dol.gov/wb/resources/occupational_segregation_and_wa ge_gap.pdf.
Jank, S. and Owens, L. (2012) Inequality in the United States: Understanding inequality with data [electronic resource]. Stanford: Stanford Center on Poverty and Inequality. http://inequality.stanford.edu/sites/default/files/Inequality_SlideDe ck.pdf.
Kalleberg, A.L. (2009). Precarious work, insecure workers: Employment relations in transition. American Sociology Review 74(1): 1‒22. doi:10.1177/0003122409
Kalleberg, A.L. (2011). Good jobs, bad jobs: The rise of polarized and precarious employment systems in the United States, 1970s to 2000s. New York: Russell Sage Foundation.
Landivar, L.C. (2013). Men in nursing occupations: American Community Survey highlight report. Suitland: U.S. Bureau of the Census, Social, Economic, and Housing Statistics Division. https://www.census.gov/people/io/files/Men_in_
Nursing_Occupations.pdf.
Lupton, B. (2006). Explaining men’s entry into female-concentrated occupations: Issues of masculinity and social class. Gender, Work and Organizations 13(2): 103‒
128.doi:10.1111/j.1468-0432.2006.00299.x.
Mandel, H. (2013). Up the down staircase: Women’s upward mobility and the wage penalty for occupational feminization, 1970‒2007. Social Forces 91(4): 1183‒ 1207.doi:10.1093/sf/sot018.
McCall, L. (2001).Complex inequality: Gender, class and race in the new economy. New York: Routledge.
McCall, L. (2005). The complexity of intersectionality. Signs 30(3): 1771‒1800.
doi:10.1086/426800.
McCall, L. (2011). Women and men as class and race actors: Comment on England.
Gender and Society 25(1): 94‒100.doi:10.1177/0891243210389812.
Miller, C.C. (2017, March 9). Race and class define men who take ‘women’s jobs.’
New York Times: B1. https://www.nytimes.com/2017/03/09/upshot/more-men-are-taking-womens-jobs-at-least-certain-men.html.
Miller, C.C. and Fremson, R. (2018, January 4). Forget about the stigma: Male nurses explain why nursing is a job of the future for men. New York Times.
https://www.nytimes.com/interactive/2018/01/04/upshot/male-nurses.html.
Munnich, E. and Wozniak, A. (2017). What explains the rising share of U.S. men in registered nursing? Working paper series 2017-10, Washington Center for Equitable Growth. http://equitablegrowth.org/working-papers/rising-share-men-nursing/.
Reskin, B.F. and Maroto, M.L. (2011). What trends? Whose choices? Comment on England.Gender and Society 25(1): 81‒87.doi:10.1177/0891243210390935. Reskin, B.F. and Roos, P.A. (eds.) (1990). Job queues, gender queues: Explaining
women’s inroads into male occupations. Philadelphia: Temple University Press. Ruggles, S., Genadek, K., Goeken, R., Grover, J., and Sobek, M. (2015). Integrated
public use microdata series: Version 6.0 [dataset]. Minneapolis: University of Minnesota.doi:10.18128/D010.V6.0.
Tomaskovic-Devey, D., Zimmer, C., Stainback, K., Robinson, C., Taylor, T., and McTague, T. (2006). Documenting desegregation: Segregation in American workplaces by race, ethnicity, and sex, 1966‒2003. American Sociological Review 71(4): 565‒588.doi:10.1177/000312240607100403.
Williams, C.L. (1993). Doing ‘women’s work’: Men in nontraditional occupations. Newbury Park: Sage.doi:10.4135/9781483326559.
Williams, C.L. (2013). The glass escalator, revisited: Gender inequality in neoliberal times.Gender and Society 27(5): 609‒629.doi:10.1177/0891243213490232. Williams, S.L. and Villemez, W.J. (1993). Seekers and finders: Male entry and exit in
female dominated jobs. In: Williams, C.L. (ed.).Doing ‘women’s work:’ Men in nontraditional occupations. Newbury Park: Sage Publications: 64‒90.
doi:10.4135/9781483326559.n5.
Wingfield, A. (2009). Racializing the glass escalator: Reconsidering men’s experiences with women’s work. Gender and Society 23(1): 5‒26. doi:10.1177/0891