ISSN 0975-928X
Research Note
Genetic variability and association studies in guar [
Cyamopsis
tetragonoloba
(L.) Taub.) for green fodder yield and quality traits
Rahul Kapoor
Department of Plant Breeding and Genetics
Punjab Agricultural University, Ludhiana-141 004, India Email: [email protected]
(Received: 17 Feb 2014; Accepted:14 Apr 2014)
Abstract
Seventy six clusterbean [Cyamopsis tetragonoloba (L.) Taub.)genotypes were analysed for genetic variability, correlation and path coefficients. The genotypes were significantly different for all the characters, which indicated scope for further genetic studies. High heritability along with high genetic advance (GA) was recorded number of leaves per plant, number of branches, dry matter yield and green fodder yield indicating that selection would be rewarding for characters. The PCV estimates were invariably higher than their corresponding GCV values thereby suggesting the environmental influence. High estimates of GCV and PCV were observed for leaf weight, number of leaves per plant, number of branches per plant, stem girth, dry matter yield and green fodder yield suggesting that selection based on these characters would facilitate successful isolation of desirable types. Traits like plant height, leaf length, leaf weight, number of leaves per plant and dry matter yield had positive and significant correlation at genotypic as well as phenotypic level with green fodder yield. Hence the selection based on these traits will result in improving the green fodder yield GFY in guar. Most of the yield contributing traits like plant height, leaf length, leaf weight, number of leaves per plant and dry matter yield as well as the quality traits like acid detergent fibre, neutral detergent fibre and in vitro dry matter digestibility showed direct effect on green fodder yield.
Key words:Cyamopsis tetragonoloba, Variability, Genetic advance, heritability, Green fodder yield.
Cluster bean [Cyamopsis tetragonoloba (L.) Taub.], also known as guar, is arid legume crop that is cultivated mostly in the arid and semi arid areas as it is drought resistant. The long deep taproot system enables the plant to grasp all the water in the soil making it an ultimate drought resistant crop. Therefore, it is cultivated in rainy
(kharif) season mainly as rainfed crop in the dry
habitats. Its seed is mainly used to produce guar gum, which has wide range of applications in the food, pharmaceutical and cosmetics industry guar gum is used as an effective binder, stabilizer, disintegrator and thickener (Vaughan and Geissler, 1998). India is one of the major producers of clusterbean and large quantity of its gum is exported to other countries. India accounts for 80% of the total guar produced in the world. Rajasthan occupies the largest area under guar cultivation (82.1%), followed by Haryana (8.6%), Gujarat (8.3%) and Punjab (1%) which in turn produced 64, 22, 12 and 2% guar seeds, respectively (Pathak
et al., 2010). Besides its utility as a grain crop, it is
a useful fodder crop and as a leguminous plant it also adds nitrogen to the soil, thereby enriching soil fertility. Crop residues (stubble and header trash) are a source of valuable, high protein animal feed. The crop can also be used to produce high
quality hay. In many parts of the country including Punjab, it is an important legume fodder crop grown during Kharif to produce highly nutritious and palatable fodder for the cattle. Despite the importance of this crop, only limited breeding work has been done and very little attention has been given for its genetic improvement in the past, in order to enhance the productivity levels of
Kharif cluster bean. Therefore, there is a great
opportunity for forage breeders in identifying the genetic make-ups that are superior in green fodder yield.
To reach this goal, the basic requirements are to have adequate information on the extent of variability, heritability, expected genetic gain and degree of genetic association among the different characters. In view of this, the present investigation was carried out with the objective of assessing genetic variability and characters association amongst the various yield contributing traits and quality parameters.
ISSN 0975-928X
was accommodated in 4 sq. m. plot size containing 4 rows of 4 m length with inter row spacing of 25 cm with three replications. Recommended package of practices to raise a good crop were followed. Observations were recorded on five competitive and healthy plants selected randomly from each entry on nine quantitative variables viz; plant height - PH (cm), leaf length- LL (cm), leaf width - LW (cm), number of leaves/plant - NOL, number of branches/plant – NOB, stem girth – SG (cm), leaf stem ratio - LSR, green fodder yield – GFY (g/plot) and dry matter yield – DMY (g/plot) and four quality parameters viz; crude protein - CP (%), Neutral detergent fibre – NDF (%), Acid detergent fibre - ADF (%), and In- vitro dry matter digestibility – IVDMD (%). The data were analysed for variability, correlation and path coefficient analyses. Genotypic and phenotypic coefficients of correlation were calculated from genotypic and phenotypic co-variances and variances as described by Singh and Chaudhry (1977) and Johnson et al. (1955). Genotypic and phenotypic coefficients were calculated using the formulae as used by Burton and De Vane (1953) and Johnson et al. (1955). Heritability in broad sense was estimated as suggested by Burton (1952). The expected genetic advance at 5% selection intensity was calculated by the formula as used by Johnson et al. (1955). Direct and indirect effects were calculated by the path coefficient analysis as suggested by Dewey and Lu (1959) at both phenotypic and genotypic levels.
Estimates of genetic variability
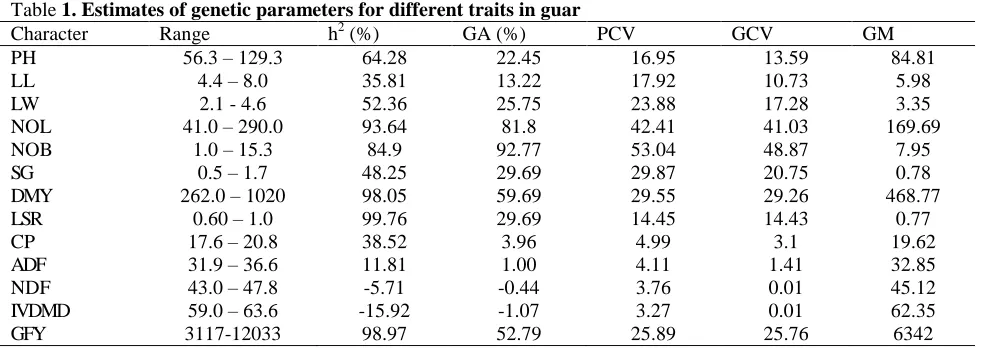
It is evident from the range of mean values for different traits among the guar genotypes being evaluated (Table 1) that these had diverse genetic background. The traits like PH (56.3 – 129.3), LL (4.4 – 8.0), LW (2.1 – 4.6), NOL (41.0 – 290.0), NOB (1.0 – 15.3) and GFY (3117 – 12033) had wide range values.
Genotypic coefficient of variation (GCV), phenotypic coefficient of variation (PCV), broad sense heritability (h2) and genetic advance as percent of mean (GA) are given in Table 2. Perusal of data revealed that GCV and PCV values were invariably higher for most of the traits except LL, LW and NOB, indicating primarily the genetic control for these traits rather the environment effect alone. Also high estimates of GCV and PCV were observed for LW, NOL, NOB, SG, DMY and GFY, suggesting that selection based on these characters would facilitate successful isolation of desirable types. However, the genetic variability together with heritability estimates would give a better idea on the amount of GA expected from selection (Burton, 1952). High values of GCV were reported for NOL, NOB, SG, DMY and GFY in accordance with the results of Shekhawat and Singhania (2005) and Vijay (1988). PH, LL and LSR along with all the four quality parameters
evaluated had low GCV values indicating little scope of genotypes for improvement in these traits. Mahla and Kumar (2006) and Sidhu et al. (1982) also reported the low GCV values for traits like PH and LL, corroborating our results.
High h2 along with high GA was recorded for NOL, NOB, DMY and GFY. Shekhawat and Singhania (2005) and Mahla and Kumar (2006) also reported similar results for many of these characters. Traits having high h2 and high GA can be improved by selection based on phenotypic performance (Singh et al., 2005a; Singh et al., 2005b ). IVDMD had lowest h2 (-15.92) followed by NDF (-5.71) thus are difficult to be improved by phenotype guided selection. Traits like PH, LW and LSR had high h2 but low values of GA indicating poor response for selection.
Genotypic and phenotypic correlation coefficients
Fodder yield is a complex character controlled by several components which reflect positive and negative effects on this trait. Yield components of fodder yield in legumes like guar consist chiefly of traits like PH, LL, LW, NOL, NOB and SG (Arora and Lodhi, 1998; Henry et al., 1986; Shekhawat and Singhania, 2005). Thus, for achieving rational improvement in fodder yield and its components, knowledge of mechanism of association, cause and effect relationship provides a basis for formulating suitable selection methods for the yield components.
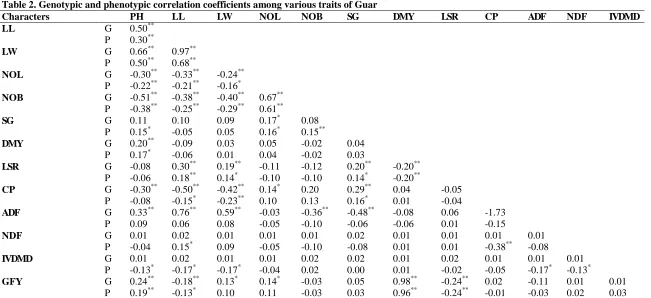
Results indicate that many yield contributing traits viz; PH, LL, LW, NOL and DMY had positive and significant correlation at genotypic as well as phenotypic level with GFY (Table 3). On the contrary, LSR exhibited a negative and significant correlation with GFY and DMY. Hence selection based on these traits will result in improving the GFY in guar. Rest of the traits under study did not exhibit significant correlation with green GFY. Traits like PH, LL and LW showed positive and highly significant correlation amongst each other but exhibited negative and highly significant correlation with NOL and NOB which were also negatively correlated amongst each other. Highest value of positive and significant correlation was observed between GFY and DMY (0.98, 0.96) closely followed by LL and LW (0.97, 0.68) whereas PH and NOB (-0.51, -0.38) exhibited highest value of negative and significant correlation.
ISSN 0975-928X
association study between forage quality traits and other fodder yield contributing traits, therefore, our study, for the first time, shed the light on association behaviour between forage quality and other fodder yield contributing traits.
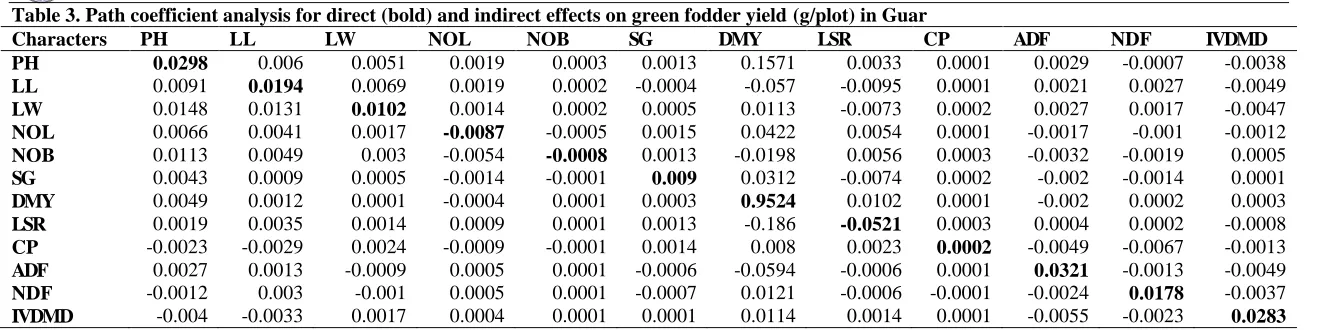
Path coefficient analysis for direct and indirect effects on green fodder yield Partitioning of the total correlation coefficient into direct and indirect effects for GFY showed a positive and high direct effect DMY (Table 4). All other traits recorded negligible indirect and direct effects on green fodder yield. Sidhu et al. (1982) also reported positive indirect effect of LL, LW, NOL on GFY. Hence, selection for taller plants with more number of broader and longer leaves and less LSR will be significant for the improvement of green fodder yield in the material under study.
References
Arora, R.N. and Lodhi, G.P. 1998. Combining ability studies for yield and its components in clusterbean. Indian J. Genet.,58(4): 525-527. Burton, G.N. 1952. Quantitative inheritance in grasses.
pp. 277-283. In: Proceedings of 6th International Grass Congress, Pennsylvania, USA.
Burton, G.W. and De Vane, E.H. 1953. Estimating genetic variability in tall fescue (Festucaarundinacea) from replicated clonal material. Agron. J., 45: 478-481
Dewey, D.R. and Lu, K.H. 1959. A correlation and path analysis of components of created wheat grass seed production. Agron. J., 51: 515-518. Henry, A., Daulay, H.S. and Krishna, G.V.S. R. 1986.
Correlation, path-coefficient analysis and Genetic diversity in clusterbean. Madras Agric. J., 73: 11-16.
Johnson, H.W., Robinson, H.F. and Comstock, R.E. 1955. Estimates of genetic and environment variability in soybean. Agron. J., 46: 314-318 Mahla, H.R. and Kumar, D. 2006. Genetic variability,
correlation and path analysis in clusterbean [Cyamopsis tetragonoloba (L.) Taub]. J. Arid Legumes, 3(1): 75–78.
Pathak, R., Singh, S.K., Singh, M. and Henry, A. 2010. Molecular assessment of genetic diversity in cluster bean Cyamopsis tetragonoloba) genotypes. J. Genet., 89: 243–246.
Shekhawat, S.S. and Singhania, D.L. 2005. Correlation and path analysis in clusterbean. Forage Res., 30(4): 196–9.
Sidhu, A.S., Pandita, M.L., Arora, S.K. and Vashistha, R.N. 1982. Studies on genetic variability and correlation coefficients in clusterbean [Cyamopsis tetragonoloba (L.) Taub.]
Haryana Agriculture Univ. J. Res., 12: 225-30. Singh, N.P., Singh, R.V., Chaudhary, S.P.S. and Singh, J. 2005a. Variability and correlation among quantitative characters in clusterbean. J. Arid Legumes, 2(1): 97–101.
Singh, R.K. and Chaudhary, B.D. 1977. Biometrical Methods in Quantitative Genetics Analysis,
Kalyani Publishers, Ludhiana, pp 288. Singh, R.V., Saini, D.D., Singh, N.P., Chaudhary, S.P.S.
and Singh, J. 2005b. Correlation and path
analysis for seed yield in cluster bean under four rainfed regimes. J. Arid Legumes, 2(1):
111–5
Vijay, O.P. 1988. Genetic variability, correlation and path analysis in clusterbean (Cyamopsis tetragonoloba (L.) Taub. (Guar). Indian J. Horti., 45: 127-31.
ISSN 0975-928X
Table 1. Estimates of genetic parameters for different traits in guar
Character Range h2 (%) GA (%) PCV GCV GM
PH 56.3 – 129.3 64.28 22.45 16.95 13.59 84.81
LL 4.4 – 8.0 35.81 13.22 17.92 10.73 5.98
LW 2.1 - 4.6 52.36 25.75 23.88 17.28 3.35
NOL 41.0 – 290.0 93.64 81.8 42.41 41.03 169.69
NOB 1.0 – 15.3 84.9 92.77 53.04 48.87 7.95
SG 0.5 – 1.7 48.25 29.69 29.87 20.75 0.78
DMY 262.0 – 1020 98.05 59.69 29.55 29.26 468.77
LSR 0.60 – 1.0 99.76 29.69 14.45 14.43 0.77
CP 17.6 – 20.8 38.52 3.96 4.99 3.1 19.62
ADF 31.9 – 36.6 11.81 1.00 4.11 1.41 32.85
NDF 43.0 – 47.8 -5.71 -0.44 3.76 0.01 45.12
IVDMD 59.0 – 63.6 -15.92 -1.07 3.27 0.01 62.35
GFY 3117-12033 98.97 52.79 25.89 25.76 6342
ISSN 0975-928X
Table 2. Genotypic and phenotypic correlation coefficients among various traits of Guar
Characters PH LL LW NOL NOB SG DMY LSR CP ADF NDF IVDMD
LL G 0.50**
P 0.30**
LW G 0.66** 0.97** P 0.50** 0.68**
NOL G -0.30** -0.33** -0.24**
P -0.22** -0.21** -0.16*
NOB G -0.51** -0.38** -0.40** 0.67** P -0.38** -0.25** -0.29** 0.61**
SG G 0.11 0.10 0.09 0.17* 0.08
P 0.15* -0.05 0.05 0.16* 0.15**
DMY G 0.20** -0.09 0.03 0.05 -0.02 0.04
P 0.17* -0.06 0.01 0.04 -0.02 0.03
LSR G -0.08 0.30** 0.19** -0.11 -0.12 0.20** -0.20** P -0.06 0.18** 0.14* -0.10 -0.10 0.14* -0.20**
CP G -0.30** -0.50** -0.42** 0.14* 0.20 0.29** 0.04 -0.05 P -0.08 -0.15* -0.23** 0.10 0.13 0.16* 0.01 -0.04
ADF G 0.33** 0.76** 0.59** -0.03 -0.36** -0.48** -0.08 0.06 -1.73 P 0.09 0.06 0.08 -0.05 -0.10 -0.06 -0.06 0.01 -0.15
NDF G 0.01 0.02 0.01 0.01 0.01 0.02 0.01 0.01 0.01 0.01
P -0.04 0.15* 0.09 -0.05 -0.10 -0.08 0.01 0.01 -0.38** -0.08
IVDMD G 0.01 0.02 0.01 0.01 0.02 0.02 0.01 0.02 0.01 0.01 0.01 P -0.13* -0.17* -0.17* -0.04 0.02 0.00 0.01 -0.02 -0.05 -0.17* -0.13*
GFY G 0.24** -0.18** 0.13* 0.14* -0.03 0.05 0.98** -0.24** 0.02 -0.11 0.01 0.01 P 0.19** -0.13* 0.10 0.11 -0.03 0.03 0.96** -0.24** -0.01 -0.03 0.02 0.03 *,** significant at 5 and 1 % respectively; G= genotypic correlation coefficient; P= Phenotypic correlation coefficient
ISSN 0975-928X
Table 3. Path coefficient analysis for direct (bold) and indirect effects on green fodder yield (g/plot) in Guar
Characters PH LL LW NOL NOB SG DMY LSR CP ADF NDF IVDMD PH 0.0298 0.006 0.0051 0.0019 0.0003 0.0013 0.1571 0.0033 0.0001 0.0029 -0.0007 -0.0038
LL 0.0091 0.0194 0.0069 0.0019 0.0002 -0.0004 -0.057 -0.0095 0.0001 0.0021 0.0027 -0.0049
LW 0.0148 0.0131 0.0102 0.0014 0.0002 0.0005 0.0113 -0.0073 0.0002 0.0027 0.0017 -0.0047
NOL 0.0066 0.0041 0.0017 -0.0087 -0.0005 0.0015 0.0422 0.0054 0.0001 -0.0017 -0.001 -0.0012
NOB 0.0113 0.0049 0.003 -0.0054 -0.0008 0.0013 -0.0198 0.0056 0.0003 -0.0032 -0.0019 0.0005
SG 0.0043 0.0009 0.0005 -0.0014 -0.0001 0.009 0.0312 -0.0074 0.0002 -0.002 -0.0014 0.0001
DMY 0.0049 0.0012 0.0001 -0.0004 0.0001 0.0003 0.9524 0.0102 0.0001 -0.002 0.0002 0.0003
LSR 0.0019 0.0035 0.0014 0.0009 0.0001 0.0013 -0.186 -0.0521 0.0003 0.0004 0.0002 -0.0008
CP -0.0023 -0.0029 0.0024 -0.0009 -0.0001 0.0014 0.008 0.0023 0.0002 -0.0049 -0.0067 -0.0013
ADF 0.0027 0.0013 -0.0009 0.0005 0.0001 -0.0006 -0.0594 -0.0006 0.0001 0.0321 -0.0013 -0.0049
NDF -0.0012 0.003 -0.001 0.0005 0.0001 -0.0007 0.0121 -0.0006 -0.0001 -0.0024 0.0178 -0.0037
IVDMD -0.004 -0.0033 0.0017 0.0004 0.0001 0.0001 0.0114 0.0014 0.0001 -0.0055 -0.0023 0.0283