Research Article
AMMI biplot analysis for stability in basmati rice (Oryza sativa L.) in different
production systems
Bharat Taindu Jain1*, A. K. Sarial2, R. P. Saharan1,HariKesh1 and Hirdayesh Anuragi1
1
Department of Genetics and Plant Breeding, CCS HAU, Hisar, Haryana, India
2
Vice-Chancellor, CSKHPKV, Palampur, Himachal Pradesh, India E-Mail: [email protected]
(Received: 14 Sep 2017; Revised: 25 May 2018; Accepted: 26 Jun 2018) Abstract
The study of G×E Interaction (GEI) is critical for evaluating the mean performance and stability of cultivars across wide range of environmental conditions. An experiment was conducted during kharif 2014-2015 for discriminating 22 basmati rice genotypes for days to 50% flowering and days to 75% maturity using AMMI and GGE stability models under four different environments
viz. direct (DSR-wet) and (DSR-dry) and indirect seeding transplanted rice (TPR) and system of rice intensification (SRI) conditions at CCS HAU farm, Kaul. Estimates of G×E interaction following Eberhart and Russell (1966) and AMMI biplot analysis as per Gauch and Zobel model (1989) were computed. For days to 50% flowering, genotypes like Pusa Basmati 6, Pusa Sugandh 3, Haryana Basmati-1 and Pusa RH 10 were identified under SRI, CSR-30 under DSR (dry) and DSR (wet) and HKR 98-476, Pusa Sugandh 2 and Pusa Sugandh 5 under TPR conditions. However, for days to 75% maturity, Pusa Sugandh 3, Pusa Basmati 1121, Pusa Basmati 1 and HKR 06-434 were adapted best to SRI, Traori Basmati, Basmati-370, HKR 98-476 and HKR 06-443 to TPR and DSR (dry) and HKR 06-487 and Pusa RH 10 to DSR (wet).
Key words
G×E interaction, AMMI biplot, GGE stability, days to 50% flowering and basmati rice. Introduction
Rice (Oryza sativa L.) is the staple food for a large proportion of the world’s population (Zhang, 2007). India is the second largest rice-growing country in the world; however, its productivity per unit area is low. In India, rice is cultivated on 44.01 million hectares with a production of 105.31 MT and productivity of 2.23 T/ha. Although more than 900 rice varieties have been released in India, many of them were no longer cultivated within a few years due to inconsistent performance in diverse environments and only a few varieties with stable performance continue under cultivation after 15 to 20 years of their release. The rice production areas in the country are very diverse in hydrology and combined to other soil and climatic factors make a difference in rice yield (Singh et al.,
1997). Rice is primarily grown by transplanting of seedling in puddled field which is very cumbersome and labour intensive as it requires 30 man days ha-1 (Parsad et.al, 2014). Due to conventional transplanting method, it has been causing a sharp decline in water table. It is imperative to shift from conventional namely transplanting method (TPR) to non-conventional cultivation techniques namely direct seeded rice (DSR). The direct seeding technique offers a useful option to reduce the limitations of transplanted paddy. Direct-seeded rice offers the advantage of faster
and easier planting, ensure proper plant population, and reduce labour, 10-12 days earlier crop maturity, more efficient water use, higher tolerance to water-deficit and often high profit in areas with assured water supply (Datta et al., 1986). To date, no specific varieties have been developed for the above non-conventional technologies. Released varieties for TPR do not perform well under non-conventional techniques. Varieties differed in their genetic potential and all varieties are not promising for diversification. The varietal response to different production systems is wide (Ghritlahre et al., 2011). To overcome such challenges estimate G×E interaction and adaptability. The Additive Main effects and Multiplicative Interaction (AMMI) model is a hybrid model involving both additive and multiplicative components. Using AMMI analysis and biplot facility, the promising rice quantitative data were analyzed for determine G×E interaction effects in different production systems of rice to identify stable genotype and to determine which genotype stable for specific environment.
Materials and Methods
design with three replications in four environments created agronomically termed production systems of rice during (kharif) rainy season of 2014-2015 at CCS Haryana Agricultural University, Rice Research Station, Kaul farm (District: Kaithal). They are conventional transplanted rice (TPR) and non-conventional viz; system of rice intensification (SRI), direct seeded dry (DSR, dry) and direct seeded wet (DSR, wet). Plot size consisted of 5 rows of 2m length and 0.20m breadth. The production systems have been described in Table 1. The data were recorded on five randomly selected plants per genotype per replication for days to 50% flowering and days to75% maturity. The G×E interaction was analyzed following Eberhart and Russell (1966) model and AMMI biplot (Gauch, 1989).
Results and Discussion
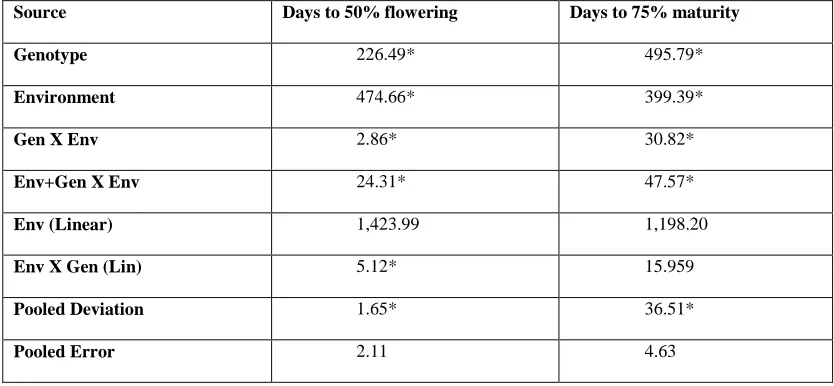
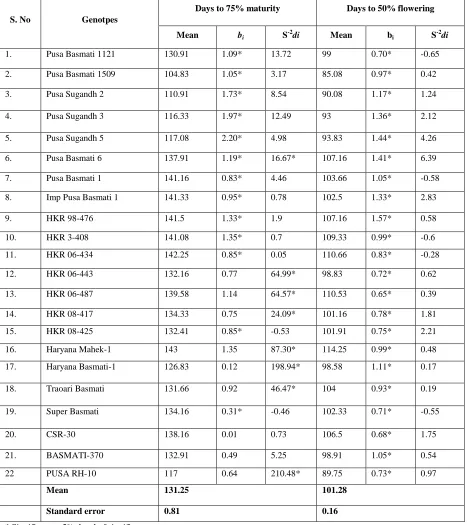
Pooled analysis of variance computed as per Eberhart and Russell (1966) model for days to 50% flowering and days to 75% maturity (Table 2) showed that the variance due to genotypes were significant (p<0.05) for both the characters. This revealed the presence of considerable genotypic variability among the genotypes for traits under study. The mean sum of squares due to genotype x environment interaction when tested against pooled error was significant for both the traits. Further partitioning of combined environment and genotype x environment variance into linear and non-linear components showed that environment linear was highly significant, G×E (linear) was non significant while, pooled deviation (nonlinear component) when tested against pooled error was significant for both the characters. The Eberhart and Russell (1966) model used two parameters (bi and S -2di) to define stability. S-2d is largely used to rank the
relative stability of cultivars. For days to 50% flowering (Table 3) stability analysis revealed all genotypes had significant regression coefficient (bi) and non-significant S-2di for days to 50% flowering. Significant G×E interaction for number of days to 50% flowering was reported by many workers like Grihtlhre and Sarial, 2011; Sinha and Biswas, 1987, Kulkami et al., 1988; and Ramya and Senthil kumar, 2008. None of the genotypes was found stable. Genotype Pusa Basmati 6, Pusa Basmati 1, Imp Pusa Basmati 1 and HKR 98-476 having regression coefficient significantly greater than one, non-significant deviation from regression and mean greater than population mean (late flowering) while genotype Pusa Sugandh 2, Pusa Sugandh 3, Pusa Sugandh 5, Haryana Basmati 1 and Basmati 370 with mean less than population mean (early flowering) were found suitable for better environment. Genotype HKR 3-408, HKR 06-434, HKR 06-487, HKR 08-425, Traori Basmati, Super
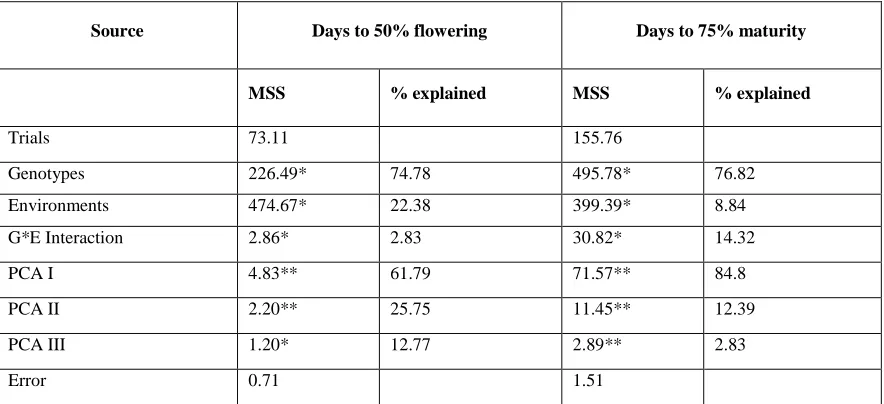
Basmati and CSR-30 having regression coefficient significantly less than one, non-significant deviation from regression and mean greater than population mean (late flowering) while genotype Pusa Basmati 1121, Pusa Basmati 1509, HKR 06-443, HKR 08-417 and Pusa RH 10 with mean less than population (early flowering) were found suitable for poor environment. On the other hand, biplot analysis is possibly the most powerful interpretive tool for AMMI models. There are two basic AMMI biplots, the AMMI 1 biplot where the main effects (genotype mean and environment mean) and IPCA 1 scores for both genotypes and environments are plotted against each other. In the second AMMI 2 biplot scores for IPCA 1 and IPCA 2 are plotted. The biplot technique was used to identify appropriate genotype adapted to specific locations/environments (Gauch, 1996). For days to 50% flowering presence of GEI was clearly demonstrated by the AMMI model had 22.38% of the total sum of squares attributed to environmental effects, 74.78% to genotypic and 2.38% to G×E interaction effects (Table 4). The G×E interaction mean sum of squares was very meager than that of genotypes, so predominant difference was due to genotypic effect. The PCA 1 explained 61.79% of the G×E interaction, PCA 2, 25.75% and PCA 3, 12.77%. The cumulative captured by first two PCA axis was 87.54% of total GEI using 44 DF.
but high interaction were found adapted to TPR and SRI. As per AMMI2 biplot, the environment DSR (dry) had short spokes and it did not exert strong interactive force while environment SRI, TPR and DSR (wet) having long spoke exert strong interaction. Genotypes near the origin were HKR 06-487, Super Basmati, HKR06-443, Pusa Basmati 1509, Basmati 370, HKR 3-408, HKR06-434, Haryana Mehak-1 and Imp Pusa Basmati -1 hence they are non-sensitive to environmental interactive forces. Genotypes Pusa Basmati 6 and HKR 98-476 were most responsive genotype. Accordingly, suitable genotypes identified with respect to site SRI were Pusa Basmati 6, Pusa Sugandh 3, Haryana Basmati-1 and Pusa RH 10, while CSR-30 for DSR (dry) and DSR (wet) and HKR 98-476, Pusa Sugandh 2 and Pusa Sugandh 5 for TPR. The AMMI analysis of variance showed that G×E interaction sum of squares was very less than that for genotypes, so major difference was due to genotypic effect. The variance of G×E interaction was partitioned into three significant interaction principal component axes (IPCAs). Of which IPCA1 exhibited 56.22% of the total G×E interaction the cumulative captured by the 1st two component was IPCA 87.73%. This implied that the interaction of the 22 rice genotypes with four environments was predicted by the first two components of PCAI and PCAII. These findings were in conformity to those of Islam et al. (2014) and Gauch
et al. (1996). AMMI1 biplot revealed that interactions of environments were high and varied. DSR (wet) had positive interaction while DSR (dry), TPR and SRI had negative. Environments TPR, SRI and DSR (wet) being on the right hand side of the midpoint of the main effect axis, seemed to be favourable environments for test grain weight, while DSR (dry) away from mid-point were generally less favourable environments. Genotypes Pusa RH 10 and Pusa Basmati 6 had high mean and positive interaction were adapted to DSR (wet). Conversely, the genotypes HKR 08-425, Basmati-370 and HKR 98-476 with low mean and negative interaction were adapted to DSR (dry). The genotypes HKR 06-434, Pusa Sugandh 3, and Pusa Sugandh 5 with low mean but high interaction were adapted to TPR and SRI. Genotypes that grouped together have similar adaptation while environments which grouped together influences the genotypes in the same way (Kemptom,1984). Genotypes HKR 06-487, HKR 3-408, HKR 08-417, Haryana Mehak-1, Pusa Sugandh 2, Pusa Basmati 1509, Pusa Basmari 1, Imp Pusa Basmati 1, CSR-30, and HKR 06-443 had IPAC1 score near zero, hence had small interaction effects indicating that these varieties were less influenced by the environment. Among them Pusa Sugandh 2 had high mean hence, found stable and recommended for
all the environments. Similar findings were also reported by Das et al. (2009) and Kulsum et al. (2013). In AMMI 2 biplot TPR and DSR (dry) had short spokes and they did not exert strong interactive force while environment SRI and DSR (wet) having long spoke exert strong interaction. Genotypes HKR 06-434, Haryana Basmati-1 and Super Basmati had high PCA score and away from origin were most responsive genotypes. Pusa Sugandh 3, Pusa Basmati 1121, Pusa Basmati 1 and HKR 06-434 were adapted to SRI. Genotypes Traori Basmati, Basmati-370, HKR 98-476 and HKR 06-443 to TPR and DSR (dry) while genotype HKR 06-487 and Pusa RH 10 were adapted to DSR (wet).
The present study provided an evaluation of genotypic and environmental performance of twenty-two rice genotypes over a range of environments. According to Eberhart and Russel (1966) regarding days to 50% flowering, TPR and SRI had positive interaction categorizing these as favorable environments while DSR (wet) and DSR (dry) negative identified as unfavorable. Genotype Pusa Sugandh 5, Pusa Sugandh 3 and Pusa Sugandh 2 flowered early had positive interaction with TPR and SRI thus adapted to favorable environments while genotype CSR-30 to unfavorable environments. With regards to days to 75% maturity genotypes had positive interaction with SRI while negative with TPR, DSR (wet) and DSR (dry). Genotypes Traori Basmati, HKR 06-487, Haryana Mehak-1, Pusa Basmati 6 and HKR 08-425 with positive interaction suited to SRI while genotypes Pusa Sugandh 2, Pusa Sugandh 3 and Pusa Sugandh 5 to DSR(wet and dry ).
References
Das, S., Misra, R.C., Patnaik, M.C. 2009. G×E interaction of mid-late rice genotypes in LR and AMMI model and evaluation of adaptability and yield stability.
Environ Ecol. 27: 529-535
De Datta, S. K. 1986. Technology development and the spread of direct-seeded flooded rice in South-East Asia. Exp Agri. 22: 417-26.
Eberhart, S.A. and Russel, W.A. 1966. Stability parameters for comparing varieties. Crop Sci, 6:36-40. Gauch, H.G. and Zobel, R.W. 1996. AMMI analysis of yield
trials genotype x environment interaction, Kang, M.S. and H.G. Gauch (Eds.). CRC Press, Boca raton, FL., USA: 85-122.
Ghritlahre, S.K., and Sarial, A.K. 2011. G×E Interaction and Adaptability of Rice Cultivars in SRI and Normal Production Systems. Cereal Res Commun, 39(4): 589-597.
Islam, M.R., Anisuzzaman, M., Khatun, H.,Sharma, N., Islam, M.Z., Akter, A., and Biswas, P.S. 2014. AMMI analysis of yield performance and stability of rice genotypes across different haor areas. Eco-friendly Agri J, 7(02): 20-24.
Kempton, R.A. 1984. The use of biplots in interpreting variety by environment interactions. J Agri Sci,
103: 123-135.
Khandhola, S.S. and Panwar, D.V.S. 1999. Studies on genetic divergence, stability heterosis and combining ability in rice (Oryza sativa L.). Kulkami, R.S. and Shashaidal, H.E. 1989. Genotype ×
environment interaction in low land rice genotypes of hill areas of Kamataka. Ind J Genet Pl Breeding, 61(4): 350-352.
Kulsum, M.U., Hasan, M.J., Akter, A.K. and Biswas, H.R.P. 2013. Genotype × Environment interaction and stability analysis in hybrid rice: an application of Additive main effects and multiplicative interaction. Bangladesh J Botony, 42(1): 73-81.
Padmavathi, P.V., Satyanarayana, P.V., and Ahamed, M.L. 2013. Stability analysis of Rice (Oryza sativa L.) hybrids utilizing Regression and AMMI models. Society Pl Res. 26 (2):148-153.
Parsad, P.S. 2014. AMMI analysis of yield performance and stability of rice genotypes across different haor areas. Eco-friendly Agri J, 7(02): 20-24.
Ramya, K. and Senthilkumar, N. 2008. Genotype × environment interaction for yield and its component traits in rice (Oryza sativa L.). Genetics and Plant Breeding, Department of Agriculture Botany, Faculty of Agriculture, Annamalai University, Annamalainagar India. Crop Improvement, 35(1): 11-15.
S.K. and Biswas, S. 1987. Adaptability of rice varieties during boro season of west Bengal. Indian Agri, 31(1):15-18.
Singh, B.N., Fagade, S., Ukwungwu, M.N., Williams, C., Jagtap, S.S. and Oladimeji, O. 1997. Rice growing environment and biophysical constraint in rice agroecological Zones of Nigeria. Meteorol J,2 :35-44.
Table 1. Description of four different environments
Environment E1 E2 E3 E4
Description TPR SRI DSR (wet) DSR (dry)
Seed rate (Kg/ha) 20 5 20 20
Seedling age (Days) 25 15 Direct sowing at 5 cm depth Direct sowing at 5 cm depth
Spacing (cm2) 15×15 25×25 20 (R-R) 20 (R-R)
Seedling /Hill 2 1 2 2
No. of Irrigation 30-33 18-20 18-20 16-18
Weeding Spray Spray Hand 30-35 (DAS) Hand 30-35(DAS)
Source: Jain and Sarial, 2015.
Table 2. Pooled Analysis of variance over 4 environments (production systems) for days to 50% flowering and days to 75% maturity per plant in rice. (Eberhart and Russell, 1966 model)
Source Days to 50% flowering Days to 75% maturity
Genotype 226.49* 495.79*
Environment 474.66* 399.39*
Gen X Env 2.86* 30.82*
Env+Gen X Env 24.31* 47.57*
Env (Linear) 1,423.99 1,198.20
Env X Gen (Lin) 5.12* 15.959
Pooled Deviation 1.65* 36.51*
Pooled Error 2.11 4.63
Table 3. Stability parameters for days to 50% flowering and days to 75% maturity of rice genotypes tested over 4 environments (production systems)
S. No Genotpes
Days to 75% maturity Days to 50% flowering
Mean bi S-2di Mean bi S-2di
1. Pusa Basmati 1121 130.91 1.09* 13.72 99 0.70* -0.65
2. Pusa Basmati 1509 104.83 1.05* 3.17 85.08 0.97* 0.42
3. Pusa Sugandh 2 110.91 1.73* 8.54 90.08 1.17* 1.24
4. Pusa Sugandh 3 116.33 1.97* 12.49 93 1.36* 2.12
5. Pusa Sugandh 5 117.08 2.20* 4.98 93.83 1.44* 4.26
6. Pusa Basmati 6 137.91 1.19* 16.67* 107.16 1.41* 6.39
7. Pusa Basmati 1 141.16 0.83* 4.46 103.66 1.05* -0.58
8. Imp Pusa Basmati 1 141.33 0.95* 0.78 102.5 1.33* 2.83
9. HKR 98-476 141.5 1.33* 1.9 107.16 1.57* 0.58
10. HKR 3-408 141.08 1.35* 0.7 109.33 0.99* -0.6
11. HKR 06-434 142.25 0.85* 0.05 110.66 0.83* -0.28
12. HKR 06-443 132.16 0.77 64.99* 98.83 0.72* 0.62
13. HKR 06-487 139.58 1.14 64.57* 110.53 0.65* 0.39
14. HKR 08-417 134.33 0.75 24.09* 101.16 0.78* 1.81
15. HKR 08-425 132.41 0.85* -0.53 101.91 0.75* 2.21
16. Haryana Mahek-1 143 1.35 87.30* 114.25 0.99* 0.48
17. Haryana Basmati-1 126.83 0.12 198.94* 98.58 1.11* 0.17
18. Traoari Basmati 131.66 0.92 46.47* 104 0.93* 0.19
19. Super Basmati 134.16 0.31* -0.46 102.33 0.71* -0.55
20. CSR-30 138.16 0.01 0.73 106.5 0.68* 1.75
21. BASMATI-370 132.91 0.49 5.25 98.91 1.05* 0.54
22 PUSA RH-10 117 0.64 210.48* 89.75 0.73* 0.97
Mean 131.25 101.28
Standard error 0.81 0.16
Table 4. AMMI analysis of days to 50% flowering and days to 75% maturity in rice across 4 production systems
Source Days to 50% flowering Days to 75% maturity
MSS % explained MSS % explained
Trials 73.11 155.76
Genotypes 226.49* 74.78 495.78* 76.82
Environments 474.67* 22.38 399.39* 8.84
G*E Interaction 2.86* 2.83 30.82* 14.32
PCA I 4.83** 61.79 71.57** 84.8
PCA II 2.20** 25.75 11.45** 12.39
PCA III 1.20* 12.77 2.89** 2.83
Error 0.71 1.51
Mean days to 50% flowering
Fig. 1. AMMI biplot of days to 50% flowering showing main effects and G x E interaction of rice genotypes in four environments
Legend : 1:Pusa Basmati 1121, 2:Pusa Basmati 1509, 3:Pusa Sugandh 2, 4:Pusa Sugandh 3, 5:Pusa Sugandh 5, 6:Pusa Basmati 6, 7:Pusa Basmati 1, 8: Improved Pusa Basmati 1, 9:HKR 98-476, 10:HKR 3-408, 11:HKR434, 12:HKR 443, 13:HKR 06-487, 14:HKR 08-417, 15:HKR 08-425, 16:Haryana Mehak-1, 17:Haryana Basmati-1, 18:Traori Basmati, 19:Super Basmati, 20:CSR-30, 21: Basmati 370, 22:Pusa RH 10, E1:Normal production system, E2:SRI, E3:DSR (wet), E4:DSR (dry)
Fig. 2. AMMI 2 biplot of days to 50% flowering showing IPCA scores of rice genotype (G) ploted across environment (E)
IPAC2
510 Mean days of 75% maturity
Fig. 3. AMMI biplot of days to 75% maturity showing main effects and G×E interaction of rice genotypes in four environments
Legend : 1:Pusa Basmati 1121, 2:Pusa Basmati 1509, 3:Pusa Sugandh 2, 4:Pusa Sugandh 3, 5:Pusa Sugandh 5, 6:Pusa Basmati 6, 7:Pusa Basmati 1, 8: Improved Pusa Basmati 1, 9:HKR 98-476, 10:HKR 3-408, 11:HKR434, 12:HKR 443, 13:HKR 06-487, 14:HKR 08-417, 15:HKR 08-425, 16:Haryana Mehak-1, 17:Haryana Basmati-1, 18:Traori Basmati, 19:Super Basmati, 20:CSR-30, 21: Basmati 370, 22:Pusa RH 10, E1:Normal production system, E2:SRI, E3:DSR (wet), E4:DSR (dry)
Fig. 4. AMMI-2 biplot of days to 75 % maturity showing IPCA scores of rice genotype (G) ploted across environment (E)
IPCA2