R E S E A R C H
Open Access
Using perceptive computing in multiple sclerosis
-the Short Maximum Speed Walk test
Janina Behrens
1, Caspar Pfüller
1, Sebastian Mansow-Model
2, Karen Otte
2, Friedemann Paul
1,3*and Alexander U Brandt
1,2Abstract
Background:We investigated the applicability and feasibility of perceptive computing assisted gait analysis in multiple sclerosis (MS) patients using Microsoft Kinect™. To detect the maximum walking speed and the degree of spatial sway, we established a computerized and observer-independent measure, which we named Short Maximum Speed Walk (SMSW), and compared it to established clinical measures of gait disability in MS, namely the Expanded Disability Status Scale (EDSS) and the Timed 25-Foot Walk (T25FW).
Methods:Cross-sectional study of 22 MS patients (age mean ± SD 43 ± 9 years, 13 female) and 22 age and gender matched healthy control subjects (HC) (age 37 ± 11 years, 13 female). The disability level of each MS patient was graded using the EDSS (median 3.0, range 0.0-6.0). All subjects then performed the SMSW and the Timed 25-Foot Walk (T25FW). The SMSW comprised five gait parameters, which together assessed average walking speed and gait stability in different dimensions (left/right, up/down and 3D deviation).
Results:SMSW average walking speed was slower in MS patients (1.6 ± 0.3 m/sec) than in HC (1.8 ± 0.4 m/sec) (p = 0.005) and correlated well with EDSS (Spearman’s Rho 0.676, p < 0.001). Furthermore, SMSW revealed higher left/right deviation in MS patients compared to HC. SMSW showed high recognition quality and retest-reliability (covariance 0.13 m/sec, ICC 0.965, p < 0.001). There was a significant correlation between SMSW average walking speed and T25FW (Pearson’s R = -0.447, p = 0.042).
Conclusion:Our data suggest that ambulation tests using Microsoft Kinect™are feasible, well tolerated and can detect clinical gait disturbances in patients with MS. The retest-reliability was on par with the T25FW.
Keywords:Computerized gait assessment, Gait impairment, Multiple sclerosis, Walking speed, T25FW
Background
Multiple sclerosis (MS) is a common chronic inflamma-tory and neurodegenerative disease that normally begins in young adulthood, typically affecting patient quality of life and leading to high rates of early retirement [1-4]. Impairment of gait and balance are major factors that restrict daily activity [5] and may occur as early as after a first clinical episode [6-8].
In current clinical practice, balance and gait impairment are quantified using a combination of clinical examination
and patients’ reported maximum walking distance: The Kurtzke‘s Functional Systems and Expanded Disability Status Scale (EDSS) [9] are widely used both in clinical practice and for clinical trials. The EDSS provides a good overview of current neurologic status, gait impair-ment and mobility dysfunction, but it has limitations. It is a relatively subjective measure with high intra- and inter-rater variability and quantifying mild symptoms and symptom progression is challenging [10,11]. The Timed 25-Foot Walk (T25FW) measures the time a patient takes to walk 25 feet at maximum speed. As part of the Multiple Sclerosis Functional Composite (MSFC), the T25FW is currently the most widely implemented method to objectively quantify gait disability in clinical MS trials and, to a lesser extent, clinical practice [12,13]. Although an excellent method of quantifying overall gait * Correspondence:[email protected]
1NeuroCure Clinical Research Center, Charité - Universitätsmedizin Berlin, Charitéplatz 1, 10117 Berlin, Germany
3Clinical and Experimental Multiple Sclerosis Research Center, Department of Neurology, Charité - Universitätsmedizin Berlin, Charitéplatz 1, 10117 Berlin, Germany
Full list of author information is available at the end of the article
disability, the T25FW measures only the time taken to walk a set distance [14]. As alternatives to the T25FW, timed walking tests might improve reliability. In particular, the 2-minute walk test is proposed as an additional out-come parameter in clinical trials [15].
Recently, more objective motion capture systems (for an overview see [16]) have been proposed as tools for detecting the pattern of gait impairment more precisely than clinical examination using conventional tools (i.e. EDSS) [17,18]. However, none of these systems has found its way into clinical routine yet, and are therefore rarely available in outpatient clinics and neurologic practices.
With an infrared light camera system, the Microsoft Kinect™, which was originally developed for video gaming, detects anatomical landmark positions in three dimen-sions (3D) [19]. This function is based on a decision forest method that harnesses mass data of sensor-recorded skel-etal joint movements [20]. Using the programming inter-face made available via the Kinect software development kit (SDK) [21], it has in the past been employed to detect balance and motion of healthy subjects [22,23] and stroke patients [24,25]. Furthermore, some few studies have re-ported methods for gait parameter approximation using Kinect [26-28], however, none of these has been applied to patients with MS.
The objective of this study was to evaluate the feasibil-ity of computerized versions of walking tests using Microsoft Kinect and to compare the resulting findings for MS patients with low to moderate neurological impair-ment to those for healthy controls. We established the Short Maximum Speed Walk test (SMSW) as a measure to analyse patients’gait speed and degree of sway. We re-port feasibility, reliability and correlation of results with those of EDSS and the T25FW.
Methods
Ethics
The local ethics committee of the Charité– Universitäts-medizin Berlin approved the study (EA1/225/12). It was conducted in accordance to the Declaration of Helsinki in its currently applicable version. All patients and healthy subjects gave written informed consent.
Patients
Twenty-two patients with diagnosed MS according to the current panel criteria [29] (age mean ± SD 43 ± 9 years, 13 female) and 22 age and sex matched healthy controls (HC) (age 37 ± 11 years, 13 female) were enrolled in the study. MS patients were recruited from on-going clinical trials at Charité’s neuroimmunology outpatient clinic. HC were recruited from volunteers. Blinding was not attempted, since the operators knew many subjects and visual contact was mandatory. MS patients were first clinically graded using EDSS (median 3.0, range 0.0–6.0)
under supervision of a neurologist. The EDSS is calculated from a detailed neurological examination using functional system scores that assess the visual system function, brainstem function, pyramidal tract function, cerebellar function, sensory system function, bowel and bladder function, cerebral function and patient ambulation [9]. Subjects additionally performed the T25FW component of the Multiple Sclerosis Functional Composite (MSFC) [30]. T25FW results were not available from eight of the 22 HC, and one of the 22 MS patients. The first 8 HC had been tested before the T25FW was added to the study protocol and the MS patient could not complete the study in full due to time constraints.
Perceptive computing assisted motor assessment
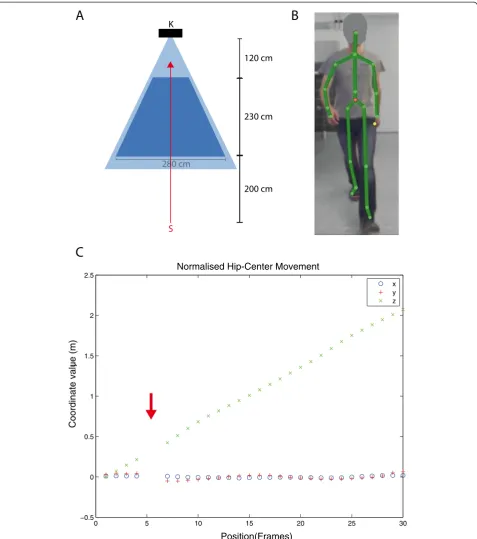
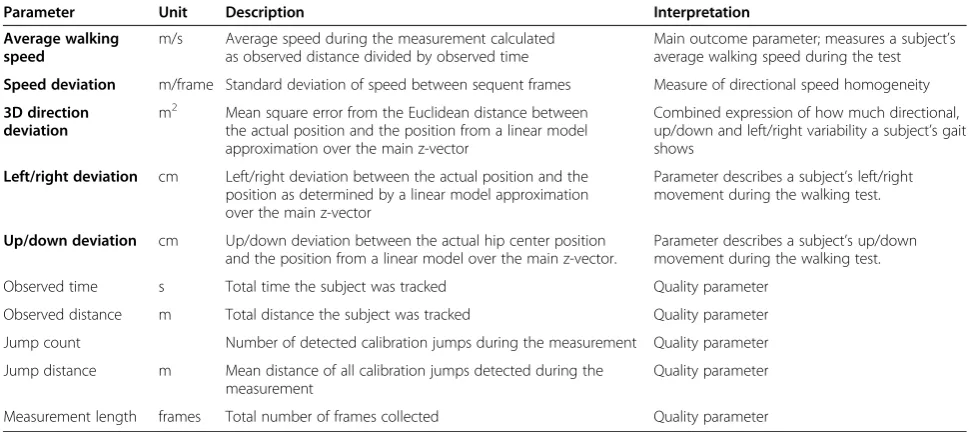
We used custom-built software running on a Windows 8 (Microsoft Corp., Redmond, WA, USA) computer with Kinect Software Development Kit (SDK) version 1.7. A Microsoft Kinect sensor was attached to a fixed pole, thereby covering a triangular area of roughly 2.5×2.5 m. The Kinect system records live videos with a conventional camera and combines these with depth information com-prising a combined feed from an infrared projector and an infrared camera. The Kinect Software Development Kit (SDK) then detects the human subject in the 3D video in real-time and models an artificial skeleton with 20 joints of an individual subject and their movement over time [19,21]. A sample of the process is shown in Figure 1 and Supplementary Video 1. Each subject was tested in an evenly lit room in a single session of sequential tests. All subjects were given the same instruction as specified in a standardized test procedure: “Walk as fast as you can to-wards the sensor”. The starting point for walking was ap-proximately two metres outside the detection range of the sensor. We postulated that this would allow the subject to reach maximum walking speed before reaching the meas-urement zone. The start was given as a voice command. An automatic computer-generated sound signalled the subject to end the experiment after leaving the opposite edge of the sensor measurement zone.
Short Maximum Speed Walk test analysis
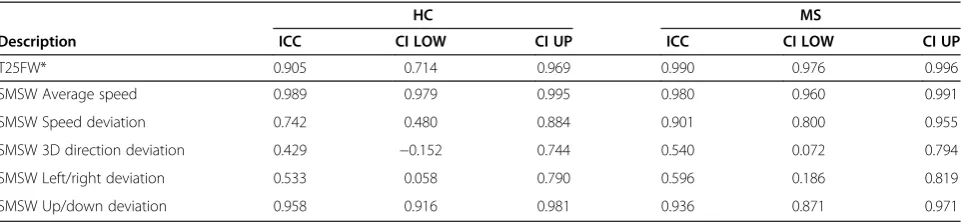
The SDK’s recorded skeletal information was post-processed at a frame-rate of 30/s. To assess walking speed and related parameters we extracted the hip-centre joint coordinates over time. An overview of all parameters is given in Table 1. In detail, the data post-processing and analysis comprised the following steps:
230 cm 120 cm K
S
280 cm8
200 cm
A
B
0 5 10 15 20 25 30
−0.5 0 0.5 1 1.5 2 2.5
Position(Frames)
Coordinate value (m)
]
Normalised Hip-Center Movement
x y z
C
As in any automated assessment tool, artefacts (in the form of tracking errors, or calibration jumps) were inev-itable. Specifically, detection of the spatial location of the crucial hip-centre joint by the SDK system was clearly sometimes erroneous as determined by visual inspection. Furthermore, the SDK’s in-built error detec-tion system (SDK Recognidetec-tion Quality) was unable to identify these artefacts with sufficient accuracy, and in-stead falsely reported all joint detections as successful. To address this problem, we developed an alternative error correction technique. Here, we mathematically ex-tracted the acceleration of the joint movement between two frames as recorded by the SDK system. We ana-lysed the transition between the points in terms of a subject’s overall acceleration and averaged these values across the study cohort. We found that if aggregated ac-celeration over all coordinate axes exceeded a threshold of 0.6 m/frames2, the frames were likely to be an arte-fact. As such they were flagged as suspected tracking errors (“calibration jump”) and excluded from further analysis.
Using the calibration jump-corrected data, we computed the SMSW test parameters given in Table 1, which were then used for statistical analysis.
All data post-processing and analysis was performed using Matlab 2012A (Mathworks, Ismaning, Germany).
Analysis of measurement quality
We derived several quality parameters and investigated the recognition quality of the central joint hip-centre (Table 2). The frequency of calibration jumps was compar-able between HC and MS patients. However, the average jump size was significantly higher in HC than MS patients. There was a strong correlation between walking speed and average jump distance (Pearson’s R = 0.778, p < 0.001), suggesting that the reason for this difference was the higher speed of HC ambulation. Furthermore, the faster people were walking, the shorter were both the observed time (Pearson’s R = -0.967, p < 0.001) and the observed distance (Spearman’s Rho = -0.686, p < 0.001). This was probably caused by the short initialisation period the sys-tem needed when a subject walked into the detection Table 1 Overview of SMSW parameters
Parameter Unit Description Interpretation
Average walking speed
m/s Average speed during the measurement calculated as observed distance divided by observed time
Main outcome parameter; measures a subject’s average walking speed during the test
Speed deviation m/frame Standard deviation of speed between sequent frames Measure of directional speed homogeneity
3D direction deviation
m2 Mean square error from the Euclidean distance between the actual position and the position from a linear model approximation over the main z-vector
Combined expression of how much directional, up/down and left/right variability a subject’s gait shows
Left/right deviation cm Left/right deviation between the actual position and the position as determined by a linear model approximation over the main z-vector
Parameter describes a subject’s left/right movement during the walking test.
Up/down deviation cm Up/down deviation between the actual hip center position and the position from a linear model over the main z-vector.
Parameter describes a subject’s up/down movement during the walking test.
Observed time s Total time the subject was tracked Quality parameter
Observed distance m Total distance the subject was tracked Quality parameter
Jump count Number of detected calibration jumps during the measurement Quality parameter
Jump distance m Mean distance of all calibration jumps detected during the measurement
Quality parameter
Measurement length frames Total number of frames collected Quality parameter
Readout parameters are given in bold; quality parameters are shown in regular font.
Table 2 Quality parameters
HC MS t test
Description Mean SD Min Max Mean SD Min Max MeanΔ SDΔ P
Observed time (sec) 1.232 0.399 0.780 2.636 1.535 0.363 0.998 2.376 0.303 0.115 0.012
Observed distance (m) 2.150 0.087 1.993 2.423 2.283 0.089 2.098 2.443 0.134 0.027 <0.001
Number of calibration jumps 0.9 1.0 0.0 3.3 0.9 1.3 0.0 5.3 −0.05 0.35 0.897
Average calibration jump distance (m) 0.091 0.033 0.044 0.168 0.058 0.013 0.029 0.074 −0.033 0.009 0.002
Measurement length (frames) 37.3 12.2 24.3 79.7 46.8 10.9 30.7 72.0 9.5 3.5 0.009
A detailed description of investigated parameters is given in Table1.
range. As a result, MS patients were measured over a min-imally longer time period and distance than HC, although the predefined test criteria were identical (Table 2).
Analysis of immediate retest reliability
T25FW tests were performed twice and the SMSW three times in a row to assess the retest reliability. T25FW, aver-age speed and SMSW showed excellent retest reliability with ICC > 0.9 in HC and MS. Speed deviation and up/ down deviation showed good reliability, whereas reliability for 3D direction deviation and left/right deviation was only moderate (for details, see Table 3). When data was not corrected for calibration jumps, ICC was considerably lower (not shown).
Statistical analysis
Immediate retest reliability was analysed using intra-class correlation coefficients (ICC) with a one-sided, random model. Test results between MS patients and HC were compared using t-tests. When equal variances could be as-sumed (Levene’s test p > 0.05), p-values from independent sample Student’s t-tests are given. When equal variances could not be assumed (Levene’s test p < 0.05), results from the Welch’s t-test are given. The association be-tween T25FW and SMSW measures was investigated using Pearson’s correlation analysis and a Bland-Altman analysis. Correlation with EDSS and functional system scores was investigated with Spearman’s Rho analysis due to the ordinal nature of EDSS data.
Statistical analysis was performed using SPSS version 21 (IBM, Armonk, NY, USA). A p < 0.05 was deemed significant. All tests should be understood as exploratory data analysis as no prior power calculation and subse-quent corrections for multiple testing were applied.
Results
Five gait parameters were derived from the hip-centre joint movement during the walk test and compared be-tween HC and MS patients. Average walking speed was the main test parameter, while the four other parameters
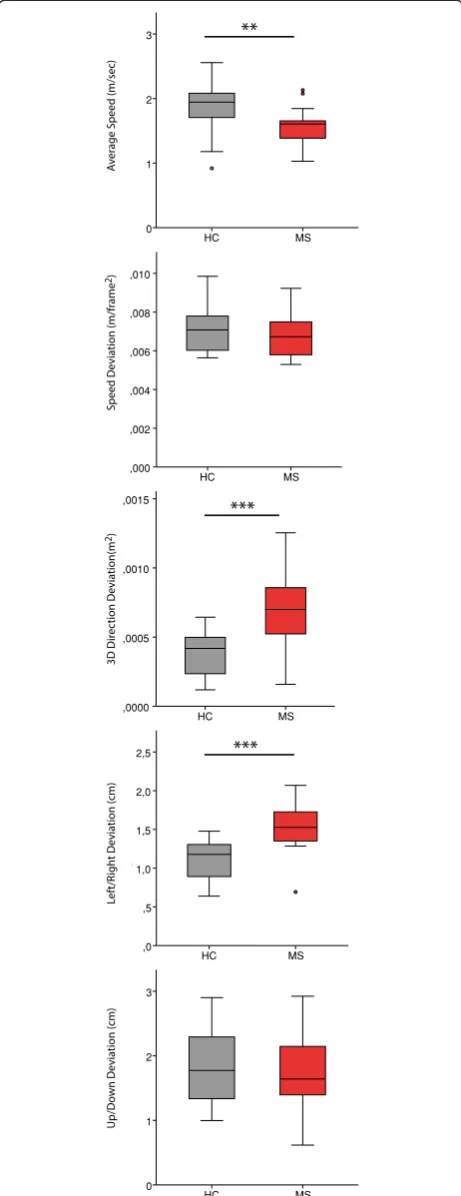
described gait stability in different dimensions (Table 1). MS patients were significantly slower than HC in aver-age walking speed. In MS patients, 3D direction devi-ation and left/right devidevi-ation were significantly higher than in HC, whereas there was no significant difference between speed deviation and up/down deviation (Table 4 and Figure 2).
Comparison between SMSW and T25FW
There was a significant but only moderate correlation between T25FW and SMSW average walking speed (Pearson’s R = -0.447, p = 0.042) in MS patients (Figure 3). In a Bland-Altman analysis comparing T25FW with SMSW and including HC and MS patients, the differ-ence between the measures was 0.4 ± 1.3 sec (mean ± SD) (Figure 3). There was no correlation between the test difference and observed time, meaning that these differences could not be explained by a higher estima-tion error in tests with shorter measurement times.
Association with EDSS and functional system scores
Both T25FW and SMSW correlated equally well with EDSS total score (Table 5A) and EDSS ambulation score (Table 5C). In the EDSS functional system scores (Table 5B), T25FW correlated mainly with visual func-tion, cerebral function but not with pyramidal function. In contrast, SMSW did not correlate with visual func-tion but with brainstem funcfunc-tion, pyramidal and cere-bral function (Table 5). Gait stability as expressed by the four deviation parameters correlated to a lesser extent with EDSS (Table 5).
Discussion
In this cross-sectional study we investigated the applic-ability and feasibility of perceptive computing assisted motion analysis in MS patients using the Microsoft Kinect system. Our primary question was whether skel-etal tracking data recorded by the device’s SDK program would yield reliable information for gait analysis. Using only thehip-centrejoint, we established the test SMSW
Table 3 Immediate retest reliability
HC MS
Description ICC CI LOW CI UP ICC CI LOW CI UP
T25FW* 0.905 0.714 0.969 0.990 0.976 0.996
SMSW Average speed 0.989 0.979 0.995 0.980 0.960 0.991
SMSW Speed deviation 0.742 0.480 0.884 0.901 0.800 0.955
SMSW 3D direction deviation 0.429 −0.152 0.744 0.540 0.072 0.794
SMSW Left/right deviation 0.533 0.058 0.790 0.596 0.186 0.819
SMSW Up/down deviation 0.958 0.916 0.981 0.936 0.871 0.971
*) The T25FW analysis is based on data from 21 MS patients and 14 HC.
to analyse MS patients’gait at maximum walking speed. Additionally, we analysed the SMSW left/right and up/down deviation of MS patients gait in comparison to HC.
Using the SMSW, we were able to detect differences in average walking speed between MS patients and HC. Several gait stability parameters also showed promising results: Especially 3D direction deviation and left/right deviation showed prominent differences between HC and MS patients. The lateral sway of MS patients (described by the parameter left/right deviation) detected by our test suggests that stability impairments are indeed detectable by perceptive computing systems, even over limited observation time and distance (although some types of gait variability may only become evident over longer distances) [31].
The linear distance covered by the recognition area was only 2.2 metres (see Figure 1 and Table 2), and con-sequently only a few steps of each subject were analysed. Despite this short walking and recording time, the over-all detection quality of the target hip-centre joint of the SMSW over time was excellent. Calibration jumps (i.e. tracking errors by the SDK system) presented regularly (see Table 2), however, these could be filtered out by ap-plying a custom-built filter developed during the analysis of this experiment. After filtering out the calibration jumps, the retest reliability of the SMSW average walking speed parameter was excellent and on par with T25FW. The gait stability parameters showed less retest reliability. This was likely due to the fact that most differences be-tween MS patients and HC were only marginally signifi-cant. The reliability of the gait stability measurements was superior in MS patients, where a higher signal-to-noise ra-tio was expected due to weaker gait stability. Addira-tionally, the detection limit was heavily influenced by the joint rec-ognition quality of the sensor. In fact, one measure (3D direction deviation), originally designed to detect changes in walking stability, proved to be very sensitive to calibra-tion jumps in walking direccalibra-tion, which primarily occurred at faster walking speed.
In combination, these data suggest that an assessment employing gait analysis at lower walking speed might
improve detection of gait variability and stability in mobil-ity impaired patients. This would not only lower detection errors in the form of calibration jumps but would also allow the system to record several step cycles for a more robust analysis. This is supported by a previous study in-vestigating a Kinect-based system for gait measurements using 3D point cloud information instead of skeletal track-ing data, which reported accurate estimation of gait pa-rameters compared to a Vicon motion analysis system in healthy volunteers [32]. A second study used skeletal data from all reported joints to analyse a postural control as-sessment battery in healthy subjects [23]. Our study adds to these findings and shows that Kinect-based motion ana-lysis is also feasible in MS patients and is able to reliably detect gait differences in comparison to healthy controls. Although the experimental setups and analysis approaches differ, all three studies show that inexpensive 3D percep-tual computing can be reliably used to quantify motion impairment. Furthermore, a recent work of Stone and Skubic showed, Kinect can also be installed in the patient’s home as a means of frequently and conveniently assessing gait [28].
We expected that SMSW average speed and the T25FW would yield similar results. However, MS pa-tients’ results sometimes differed strongly in the two tests. Although typical MS symptoms like reduced mus-cular strength, spasticity or balance deficiency are widely known to fluctuate [33], it is unlikely that ran-dom irregularities or gait variability are the key factors in this discrepancy, because retest reliability was high in both tests.
Instead, a different influence of functional impairments on both tests seems possible. SMSW and T25FW corre-lated well with overall EDSS degree of neurological disabil-ity. However, when drilling-down by comparing individual parameter results to the corresponding EDSS functional system scores (FS), we were surprised to find a difference between the SMSW and the T25FW: Whereas SMSW average walking speed showed a moderate correlation to cerebral function, T25FW results correlated with visual function, and SMSW walking speed showed correlation with the pyramidal scores of the EDSS.
Table 4 Comparison between healthy controls and multiple sclerosis patients
Parameter HC MS t test
Mean SD Min Max Mean SD Min Max MeanΔ SDΔ P
Average speed (m/s) 1.852 0.366 0.919 2.557 1.555 0.294 1.029 2.131 −0.297 0.100 0.005
Speed deviation (m/frame2) 0.0070 0.0010 0.0056 0.0099 0.0068 0.0011 0.0053 0.0092 0.000 0.000 0.437
3D direction deviation (m2) 0.00040 0.00015 0.00012 0.00064 0.00072 0.00026 0.00016 0.00125 0.00032 0.00007 <0.001
Left/right deviation (cm) 1.122 0.243 0.638 1.477 1.537 0.301 0.693 2.069 0.415 0.082 <0.001
Up/down deviation (cm) 1.818 0.596 0.997 2.902 1.777 0.579 0.617 2.924 −0.041 0.177 0.817
See Table1for a detailed description of the parameters assessed.
Pyramidal impairment such as muscular weakness and spasticity clearly restricts the gait of many MS patients [34,35]. However, as stated above, we found no correl-ation between the T25FW and the pyramidal function score of the EDSS. This is in discrepancy with previous findings, such as those of Phan-Ba et al. [36], and likely explained by the only mild pyramidal impairment of many patients in our study (41% patients with FS≤2 ). In contrast to T25FW, SMSW correlated with pyramidal functional system scores. This might be explained by findings from previous studies where MS patients, per-forming the T25FW, accelerated walking speed after a relatively slow start [36,37]. Because muscular rigidity is triggered by postural changes [38], such as starting from a static position to walk, we may have detected a starting weakness of spastic patients. Thus, a patient, who begins moving more slowly, might show a slower walking time at SMSW average walking speed compared to T25FW. In the T25FW a slower speed at start might level over the longer distance. In this regard SMSW average walk-ing speed may be more sensitive to impaired initiation of movement in MS patients than the T25FW. We did not evaluate spasticity with a validated assessment, so we were not able to further pursue the question of whether the SMSW could be a marker for minor pyram-idal weakness.
An exploratory pilot study of this type has some limita-tions. Only Kinect-derived skeletal tracking information generated by the SDK was used [19]. Although not within the scope of the present study, it is conceivable that exclu-sive or hybrid inclusion of raw sensor data might yield additional or better results. Furthermore, we neither se-lected MS patients with specific and well-established motor symptoms or gait disability, nor did we compare SMSW test results to objective gait measures other than T25FW. The analysis between SMSW, T25FW and EDSS functional system scores should be treated as preliminary and the results should be interpreted with care. However, the demonstrated correlations fit well within the expected clinical framework and the results of previous studies. As such, our results can be expected to serve as a basis for confirmatory studies. Most importantly, the ability of SMSW measurements to detect changes longitudinally and the retest reliability of the test needs to be validated in a follow-up study.
Conclusion
Perceptive computing-based detection of ambulation speed via the joint hip-centre was feasible and reliable. SMSW average walking speed was a valid parameter as demonstrated by retest reliability results and the strong correlation with established clinical scores, such as the T25FW and EDSS. A notable difference was the slower walking speed of MS patients measured using SMSW
MS HC
SPEED, Average Speed (m/sec)
3
2
1
0
MS HC
SPDEV, Speed Deviation (m/frame2)
,010
,008
,006
,004
,002
,000
MS HC
,0015
,0010
,0005
,0000
MS HC
LRDEV, Left/Right Deviation (cm)
2,5
2,0
1,5
1,0
,5
,0
MS HC
UPDER, Up/Down Deviation (cm)
3
2
1
0
**
***
***
A
v
erage Speed (m/sec)
Speed Deviation (m/frame
2)
3D Dir
ec
tion Deviation(m
2)
Le
ft
/R
ight Deviation (cm)
Up/Do
wn Deviation (cm)
(mean distance: 2.2 metres) compared to T25FW (mean distance: 7.6 metres). The gait stability parameters showed greater left/right deviation in MS patients com-pared to HC. The analysis approach presented here shows promise as an objective technique for detecting
and assessing of gait pattern and as a simple and afford-able tool in the clinician’s toolbox. Finally, this study provides evidence that further investigation of gait with periodic Kinect-measurements may give new insight into the disease progression of MS.
Average T25FW and SMSW (sec) 9 8 7 6 5 4 3
SMSW) (sec)
6
4
2
0
-2
-4
-6
A B
T25FW (sec)
12 11 10 9 8 7 6 5 4 3 8
7
6
5
4
3
SMSW 25-f
e
et time equivalent (sec)
Figure 3SMSW in comparison with the T25FW.Measuring agreement of gait speed detection of MS patients (red dots) and healthy subjects (grey triangles) with standard T25FW and SMSW. To be able to directly compare SMSW and T25FW in a Bland-Altman analysis, the SMSW time equivalent of walking 25-feet at the detected average speed was calculated.A)Results are plotted against each other. The solid line represents an R2of 0.392 from a linear regression analysis; the long dashed lines are 95% confidence intervals to the mean. The short-dashed line represents
the theoretical test equality (T25FW = SMSW). B) Bland-Altman plot comparison between T25FW and SMSW average speed.B)The difference of the mean is -0.4 sec (solid line). Long dashed lines are 2x standard deviation.
Table 5 Correlation between test outcomes and EDSS
A B
Parameter Total score FS VIS BS PYR cer SENS B&B CER
Median 3.0 0 12 7 3 4 2 9 5
Min 0.0 1 9 10 6 8 8 7 9
Max 6.0 2 1 5 8 6 10 5 8
3+ 5 4 2 1
T25FW* Rho 0.694 Rho 0.492 0.304 0.161 0.394 −0.081 0.397 0.539
P <0.001 P 0.023 0.180 0.485 0.077 0.727 0.075 0.012 SMSW Average speed Rho −0.701 Rho 0.060 −0.516 −0.634 −0.355 −0.126 −0.204 −0.430
P <0.001 P 0.789 0.014 0.002 0.105 0.578 0.362 0.046 SMSW Speed deviation Rho 0.276 Rho 0.286 0.369 0.024 0.122 −0.453 0.155 0.291
P 0.213 P 0.198 0.091 0.917 0.588 0.034 0.491 0.189 SMSW Derived T25FW Rho 0.676 Rho −0.060 0.516 0.639 0.327 0.090 0.204 0.428
P 0.001 P 0.789 0.014 0.001 0.137 0.690 0.362 0.047 SMSW 3D direction deviation Rho 0.439 Rho 0.086 0.411 0.196 0.074 0.048 −0.099 0.317
P 0.041 P 0.705 0.057 0.382 0.743 0.834 0.662 0.151 SMSW Left/right deviation Rho 0.429 Rho 0.072 0.392 0.191 0.033 0.007 −0.125 0.317
P 0.046 P 0.750 0.071 0.395 0.884 0.974 0.579 0.151 SMSW Up/down deviation Rho −0.134 Rho −0.122 −0.301 −0.181 −0.264 −0.246 0.056 −0.397
P 0.551 P 0.590 0.173 0.421 0.236 0.269 0.806 0.067 P values are given in italic; correlation coefficients from tests with significant results are given in bold. A) Overview of EDSS distribution and results from a Spearman’s Rho analysis compared to the results of investigated measures and standard T25FW results. B) Detailed overview of FS distribution and Spearman’s Rho analysis results. *) The T25FW analysis is based on data from 21 MS patients and 14 HC.
Abbreviations: T25FWTimed 25-Foot Walk,EDSSExpanded Disability Status Scale,FS EDSSfunctional system score,VISvisual system score,BSbrainstem score,
Competing interests
This study was funded in part with a grant from Novartis Pharma Germany. Motognosis is a company that has a commercial interest in the results of this research and technology. AUB and SMM are co-founders and shareholders of Motognosis. AUB, SMM and KO receive monetary compensation as employees from Motognosis. JB, CP, KO and FP report no potential conflict of interest. FP and CP were supported by the German Research Council (DFG Exc 257).
Authors’contributions
AUB, CP and FP planned and designed the study. JB and CP were responsible for supervising subject recruitment and measurement. KO and SMM developed feature extraction and performed raw data analysis. JB and AUB performed the statistical analysis. JB and AUB wrote the manuscript. FP revised the manuscript. All authors provided key intellectual content during the study design or manuscript revision. All authors read and approved the final manuscript.
Acknowledgements
We thank Cynthia Kraut and Susan Pikol for excellent technical assistance. All primary data is write protected and archived under stewardship of the Charité–Universitätsmedizin Berlin’s office for Good Clinical Practice. It is available for verification upon request.
Author details 1
NeuroCure Clinical Research Center, Charité - Universitätsmedizin Berlin, Charitéplatz 1, 10117 Berlin, Germany.2Motognosis UG (haftungsbeschränkt), Berlin, Germany.3Clinical and Experimental Multiple Sclerosis Research Center, Department of Neurology, Charité - Universitätsmedizin Berlin, Chari-téplatz 1, 10117 Berlin, Germany.
Received: 11 December 2013 Accepted: 22 May 2014 Published: 27 May 2014
References
1. Noseworthy JH, Lucchinetti C, Rodriguez M, Weinshenker BG:Multiple
sclerosis.N Engl J Med2000,343(13):938–952.
2. Patwardhan MB, Matchar DB, Samsa GP, McCrory DC, Williams RG, Li TT: Cost of multiple sclerosis by level of disability: a review of literature. Mult Scler2005,11(2):232–239.
3. Krause I, Kern S, Horntrich A, Ziemssen T:Employment status in multiple sclerosis: impact of disease-specific and non-disease-specific factors. Mult Scler2013,19(13):1792–1799.
4. Borisow N, Döring A, Pfueller CF, Paul F, Dörr J, Hellwig K:Expert recommendations to personalization of medical approaches in treatment of multiple sclerosis: an overview of family planning and
pregnancy.EPMA J2012,3(1):9.
5. Findling O, Sellner J, Meier N, Allum JHJ, Vibert D, Lienert C, Mattle HP: Trunk sway in mildly disabled multiple sclerosis patients with and
without balance impairment.Exp Brain Res2011,213(4):363–370.
6. Kalron A, Achiron A, Dvir Z:Motor impairments at presentation of clinically isolated syndrome suggestive of multiple sclerosis:
Characterization of different disease subtypes.NeuroRehabilitation2012,
31(2):147–155.
7. Kalron A, Achiron A, Dvir Z:Muscular and gait abnormalities in persons
with early onset multiple sclerosis.J Neurol Phys Ther2011,35(4):164–169.
8. Martin CL, Phillips BA, Kilpatrick TJ, Butzkueven H, Tubridy N, McDonald E, Galea MP:Gait and balance impairment in early multiple sclerosis in the
absence of clinical disability.Mult Scler2006,12(5):620–628.
9. Kurtzke JF:Rating neurologic impairment in multiple sclerosis: an
expanded disability status scale (EDSS).Neurology1983,33(11):1444–1452.
10. Noseworthy JH, Vandervoort MK, Wong CJ, Ebers GC:Interrater variability with the Expanded Disability Status Scale (EDSS) and Functional Systems (FS) in a multiple sclerosis clinical trial. The Canadian Cooperation MS
Study Group.Neurology1990,40(6):971–975.
11. Goodkin DE:EDSS reliability.Neurology1991,41(2 Part 1):332–332. 12. Fischer JS, Rudick RA, Cutter GR, Reingold SC:The Multiple Sclerosis
Functional Composite Measure (MSFC): an integrated approach to MS clinical outcome assessment. National MS Society Clinical Outcomes
Assessment Task Force.Mult Scler1999,5(4):244–250.
13. Rosti-Otajärvi E, Hämäläinen P, Koivisto K, Hokkanen L:The reliability of the
MSFC and its components.Acta Neurol Scand2008,117(6):421–427.
14. Hobart J, Blight AR, Goodman A, Lynn F, Putzki N:Timed 25-foot walk: direct evidence that improving 20% or greater is clinically meaningful in MS.Neurology2013,80(16):1509–1517.
15. Gijbels D, Dalgas U, Romberg A, de Groot V, Bethoux F, Vaney C, Gebara B, Medina CS, Maamâgi H, Rasova K, de Noordhout BM, Knuts K, Feys P: Which walking capacity tests to use in multiple sclerosis? A
multicentre study providing the basis for a core set.Mult Scler2012,
18(3):364–371.
16. Pearson OR, Busse ME, van Deursen RWM, Wiles CM:Quantification of
walking mobility in neurological disorders.QJM2004,97(8):463–475.
17. Sosnoff JJ, Weikert M, Dlugonski D, Smith DC, Motl RW:Quantifying gait
impairment in multiple sclerosis using GAITRite technology.Gait Posture
2011,34(1):145–147.
18. Sosnoff JJ, Sandroff BM, Motl RW:Quantifying gait abnormalities in
persons with multiple sclerosis with minimal disability.Gait Posture2012,
36(1):154–156.
19. Criminisi A, Shotton J, Konukoglu E:Decision Forests for Classification, Regression, Density Estimation, Manifold Learning and Semi-Supervised
Learning [Internet].Microsoft Research2011, Available from: http://research.
microsoft.com/apps/pubs/default.aspx?id=155552.
20. Mendel J, Wu D:Perceptual Computing: Aiding People in Making Subjective Judgments.Hoboken, New Jersey: John Wiley & Sons, Inc.; 2010:339.
21. Kinect for Windows SDK from Microsoft Research.[Internet].
[cited 2011 Oct 28]. Available from: http://www.microsoft.com/en-us/ kinectforwindowsdev/Downloads.aspx.
22. Calderita LV, Bandera JP, Bustos P, Skiadopoulos A:Model-based reinforcement of kinect depth data for human motion capture
applications.Sensors (Basel)2013,13(7):8835–8855.
23. Clark RA, Pua Y-H, Fortin K, Ritchie C, Webster KE, Denehy L, Bryant AL: Validity of the Microsoft Kinect for assessment of postural control. Gait Posture2012,36(3):372–377.
24. Lloréns R, Alcañiz M, Colomer C, Navarro MD:Balance recovery through virtual stepping exercises using Kinect skeleton tracking: a follow-up
study with chronic stroke patients.Stud Health Technol Inform2012,
181:108–112.
25. Mobini A, Behzadipour S, Saadat Foumani M:Accuracy of Kinect’s skeleton
tracking for upper body rehabilitation applications.Disabil Rehabil Assist
Technol2013, [http://dx.doi.org/10.3109/17483107.2013.805825]
26. Khoshelham K, Elberink SO:Accuracy and resolution of kinect depth data
for indoor mapping applications.Sensors (Basel)2012,12(2):1437–1454.
27. Gabel M, Gilad-Bachrach R, Renshaw E, Schuster A:Full body gait analysis
with Kinect.Conf Proc IEEE Eng Med Biol Soc.2012,2012:1964–1967.
28. Stone EE, Skubic M:Capturing habitual, in-home gait parameter trends
using an inexpensive depth camera.Conf Proc IEEE Eng Med Biol Soc.2012,
2012:5106–5109.
29. Polman CH, Reingold SC, Banwell B, Clanet M, Cohen JA, Filippi M, Fujihara K, Havrdova E, Hutchinson M, Kappos L, Lublin FD, Montalban X, O’Connor P, Sandberg-Wollheim M, Thompson AJ, Waubant E, Weinshenker B, Wolinsky JS:Diagnostic criteria for multiple sclerosis: 2010 revisions to
the McDonald criteria.Ann Neurol2011,69(2):292–302.
30. Cutter GR, Baier ML, Rudick RA, Cookfair DL, Fischer JS, Petkau J, Syndulko V, Weinshenker BG, Antel JP, Confavreux C, Ellison GW, Lublin F, Miller AE, Rao SM, Reingold SM, Thompson A, Willoughby E:Development of a multiple
sclerosis functional composite as a clinical trial outcome measure.Brain
1999,122(Pt 5):871–882.
31. Socie MJ, Sosnoff JJ:Gait variability and multiple sclerosis.Mult Scler Int. 2013,2013:645197.
32. Stone EE, Skubic M:Passive in-home measurement of stride-to-stride gait
variability comparing vision and Kinect sensing.Conf Proc IEEE Eng Med
Biol Soc.2011,2011:6491–6494.
33. Crenshaw SJ, Royer TD, Richards JG, Hudson DJ:Gait variability in people
with multiple sclerosis.Mult Scler2006,12(5):613–619.
34. Collongues N, Vermersch P:Multiple sclerosis spasticity:“state-of-the-art”
questionnaire survey of specialized healthcare professionals.Expert Rev
Neurother2013,13(3 Suppl 1):21–25.
35. Donzé C, De Sèze J:Spasticity and everyday life in multiple sclerosis.Rev Neurol (Paris)2012,168(3):S51–S56.
Speed in Multiple Sclerosis.PLoS One[Internet]. 2012 Apr 13 [cited 2013 Aug 22];7(4). Available from: http://dx.doi.org/10.1371/journal.pone.0034744. 37. Phan-Ba R, Calay P, Grodent P, Delrue G, Lommers E, Delvaux V, Moonen G, Nagels G, Belachew S:A corrected version of the Timed-25 Foot Walk Test with a dynamic start to capture the maximum ambulation speed in
multiple sclerosis patients.NeuroRehabilitation2012,30(4):261–266.
38. Fleuren JF, Voerman GE, Snoek GJ, Nene AV, Rietman JS, Hermens HJ: Perception of lower limb spasticity in patients with spinal cord injury. Spinal Cord2009,47(5):396–400.
doi:10.1186/1743-0003-11-89
Cite this article as:Behrenset al.:Using perceptive computing in multiple sclerosis - the Short Maximum Speed Walk test.Journal of NeuroEngineering and Rehabilitation201411:89.
Submit your next manuscript to BioMed Central and take full advantage of:
• Convenient online submission
• Thorough peer review
• No space constraints or color figure charges
• Immediate publication on acceptance
• Inclusion in PubMed, CAS, Scopus and Google Scholar
• Research which is freely available for redistribution