RESEARCH
A simple method for HPLC retention
time prediction: linear calibration using two
reference substances
Lei Sun
1,2, Hong‑yu Jin
1, Run‑tao Tian
3, Ming‑juan Wang
1, Li‑na Liu
1, Liu‑ping Ye
4, Tian‑tian Zuo
1and Shuang‑cheng Ma
1*Abstract
Background: Analysis of related substances in pharmaceutical chemicals and multi‑components in traditional Chi‑ nese medicines needs bulk of reference substances to identify the chromatographic peaks accurately. But the refer‑ ence substances are costly. Thus, the relative retention (RR) method has been widely adopted in pharmacopoeias and literatures for characterizing HPLC behaviors of those reference substances unavailable. The problem is it is difficult to reproduce the RR on different columns due to the error between measured retention time (tR) and predicted tR in some cases. Therefore, it is useful to develop an alternative and simple method for prediction of tR accurately. Methods: In the present study, based on the thermodynamic theory of HPLC, a method named linear calibration using two reference substances (LCTRS) was proposed. The method includes three steps, procedure of two points prediction, procedure of validation by multiple points regression and sequential matching. The tR of compounds on a HPLC column can be calculated by standard retention time and linear relationship.
Results: The method was validated in two medicines on 30 columns.
Conclusion: It was demonstrated that, LCTRS method is simple, but more accurate and more robust on different HPLC columns than RR method. Hence quality standards using LCTRS method are easy to reproduce in different labo‑ ratories with lower cost of reference substances.
Keywords: RP‑HPLC, Retention time, Relative retention, Linear calibration using two reference substances, Multi‑ component analysis, Traditional Chinese medicines
© The Author(s) 2017. This article is distributed under the terms of the Creative Commons Attribution 4.0 International License (http://creativecommons.org/licenses/by/4.0/), which permits unrestricted use, distribution, and reproduction in any medium, provided you give appropriate credit to the original author(s) and the source, provide a link to the Creative Commons license, and indicate if changes were made. The Creative Commons Public Domain Dedication waiver (http://creativecommons.org/ publicdomain/zero/1.0/) applies to the data made available in this article, unless otherwise stated.
Background
Multi-components analysis is an effective strategy for quality control of traditional Chinese medicines (TCMs), which have complex chemical profiles. But the classic external standard method was severely confined in its application due to the high cost of reference substances. As a consequence, substitute reference substance meth-ods such as extractive reference substance (ERS) method and single standard to determine multi-components (SSDMC) method for overall quality control of TCMs
have emerged, and widely used in Chinese pharmaco-poeia 2015 edition, the United States Pharmacopharmaco-poeia (USP39-NF34) and literatures [1–10]. In general, ERS method provides only one reference chromatogram in the pharmacopoeias, instructions of ERS and literatures. But there are hundreds of brands of C18 columns in the
market. It means that the reference chromatogram may be different from the actual chromatogram. Due to the column types and other various factors, the error between measured retention time (tR) and predicted tR by the
rela-tive retention (RR) method cannot be ignored sometimes. In order to improve the reproducibility of chromato-graphic separation and RR, the method of classification of C18 columns has been proposed [11–15]. The columns
were divided into three types: A, B and EP. Although the
Open Access
*Correspondence: [email protected]
1 National Institutes for Food and Drug Control, No. 2 Tiantan Xili,
same type of columns was used to repeat the analyti-cal methods, the differences in the performance and the separation effects were still large. And then the methods for selecting columns with equivalent selectivity, such as the USP approach [16], the PQRI approach [17, 18] and Katholieke Universiteit Leuven column classification sys-tem [19–21] were proposed. Take PQRI approach [17, 18] as an example, hydrophobicity (H), steric interaction (S), hydrogen-bond acidity (A), hydrogen-bond basicity (B) and ion-exchange capacity (C), were used to describe the performance of the column. And the similarity between a column and the reference column was calculated by these five parameters. When the similarity was less than three, the two columns were regarded to be equivalent. Using the equivalent column, the reproducibility of separation and RR could be improved to some extent. However, in addition to column, many other factors also have great influences on the chromatograms, such as the dead vol-ume of chromatographic system, the different structure of analytes, the complexity of the chromatographic con-ditions, and so on. Therefore, it is necessary to develop a method that takes all aforementioned factors into account to reduce the prediction error of the tR.
According to the thermodynamic theory of liquid chro-matography, there is a linear relationship between the tR of
the compounds on two different HPLC systems (including chromatographs and columns) [22]. For better understand-ing, the pdf of reference 22 (in Chinese, Additional file 1) and the English version of reference 22 (only the section of theory was translated, Additional file 2) are provided. Combined with the above principle and previous studies [23–25], a novel method using two reference substances for predicting HPLC tR has been proposed (linear calibration
by two reference substances, LCTRS). The StR (arithmetic
average of tR for the same compound on different HPLC
system under the same chromatographic conditions) is used as the reference value, and the linear regression is used as the basic algorithm for tR prediction. In this study, the
method was validated in two medicines on 30 C18 columns.
Compared with the RR method, LCTRS method is proved to be more accurate, and more robust on different HPLC columns. Hence, it provides a good prospective application in quantification of multi-components in TCMs as well as related substances in pharmaceutical chemicals.
Methods
The Minimum Standards of Reporting Checklist contains details of the experimental design, and statistics, and resources used in this study (Additional file 3).
Instruments and reagents
Waters e2695 HPLC (2998PDA detector), Agilent 1260 HPLC (DAD detector), and Shimadzu LC-2010A HT
HPLC (UV–Vis detector) were used. Matlab software was provided by Math Works Inc. USA. 30 C18 columns
(shown in Table 1), from 13 manufacturers, included A, B, and EP types were used. And most columns belong to type B according to the previous study [11–15]. Accord-ing to the PQRI approach [17, 18] and using the data from the USP website (http://www.usp.org/USPNF/columns. html), the similarity of columns were calculated using col1 as the reference column. The similarity (0–13.18) showed that the differences among the columns were large, which indicated that the selected columns are in a wide range and have good representative trait.
Reference substances of psoralen, isopsoralen, Chon-glou saponin I, ChonChon-glou saponin II, ChonChon-glou saponin VI, Chonglou saponin VII, ethinylestradiol, and herbal reference substances including Psoraleae Fructus (Pso-raleae) and Paridis Rhizome (Paridis), were supplied by the National Institutes for Food and Drug Control, China. Methanol, acetonitrile, and phosphoric acid were HPLC graded and supplied by the Fischer Company, USA. Ammonium nitrate (analytical grade) was sup-plied by Beijing Chemical Works. Water was prepared by Milli-Q system, Millipore Company, USA.
Preparation of sample solution
Psoraleae [26]: weigh 0.5 g of the powder and place it in a 50-mL stopper conical flask, then add 25 mL of ethanol. Sonicate the mixture for 30 min and centrifuge for 5 min. Filter the supernatant through a 0.45-μm PTFE filter.
Paridis [27]: weigh 0.5 g of the powder to a stopper conical flask, add 25 mL of ethanol, heat under reflux on a water bath for 30 min, cool and filter the supernatant through a 0.45-μm PTFE filter.
Chromatographic conditions
Psoraleae [26]: mobile phase A was water and mobile phase B was methanol. The elution procedure was shown below: 0–20 min, 50%B→70%B; 20–45 min, 70%B→85%B; 45–50 min, 85%B→90%B; 50–60 min, 90%B. Detection wavelength was 308 nm. Paridis [27]: mobile phase A was water and mobile phase B was acetonitrile. The elution procedure was shown below: 0–40 min, 30%B→60%B; 40–50 min, 60%B→30%B; 50–60 min, 30%B. Detection wavelength was 203 nm. Column temperatures were both set at 30 °C and flow rate was 1.0 mL/min.
Results
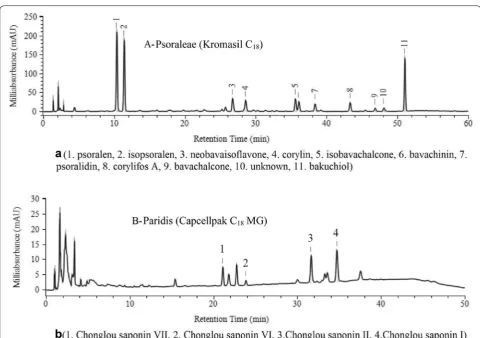
HPLC chromatogram of samples
Standard retention time (StR)
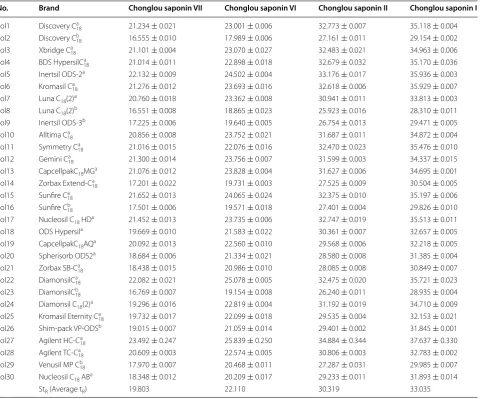
Under the same chromatographic conditions, measured retention time (tRmea) of the four saponins in Paridis on
different chromatographic systems (which includes HPLC instruments and columns, hereinafter referred to as col-umns due to the differences of tR mainly caused by
col-umns) were shown in Table 1. The arithmetic average of tR for the same compound on different columns is called
StR, formula (1). Just like RR, StR is the reference value for
calculating the predicted retention time (tRpre) of analyte
in the samples. Theoretically, under the same chromato-graphic condition, the RR calculated by different columns is constants, but StR is not. It will be discussed in
Sec-tion "Minimum number of columns for StR calculation"
that the advantages of using StR was better than tR of any
single column. In this paper, the deviation (ΔtR) of tRmea
and tRpre (formula 2) was used to evaluate the merits and
defects of RR method and LCTRS method.
Linear principle of LCTRS
According to the chromatographic thermodynamic the-ory, Wang et al. proved that there was a linear relation-ship between the tR of the same compounds on different
(1)
StR= n
i=1
tRi/n (n≥1)
(2)
tR= |tRmea−tRpre| Table 1 tR (min) of four saponins in Paridis on different columns
a 4.6 mm × 250 mm × 5 μm b 4.6 mm × 150 mm × 5 μm
No. Brand Chonglou saponin VII Chonglou saponin VI Chonglou saponin II Chonglou saponin I
col1 Discovery Ca
18 21.234 ± 0.021 23.001 ± 0.006 32.773 ± 0.007 35.118 ± 0.004
col2 Discovery Cb
18 16.555 ± 0.010 17.989 ± 0.006 27.161 ± 0.011 29.154 ± 0.002
col3 Xbridge Ca
18 21.101 ± 0.004 23.070 ± 0.027 32.483 ± 0.021 34.963 ± 0.006
col4 BDS HypersilCa
18 21.014 ± 0.011 22.898 ± 0.018 32.679 ± 0.032 35.170 ± 0.036
col5 Inertsil ODS‑2a 22.132 ± 0.009 24.502 ± 0.004 33.176 ± 0.017 35.936 ± 0.003
col6 Kromasil Ca
18 21.276 ± 0.012 23.693 ± 0.016 32.618 ± 0.006 35.929 ± 0.007
col7 Luna C18(2)a 20.760 ± 0.018 23.362 ± 0.008 30.941 ± 0.011 33.813 ± 0.003
col8 Luna C18(2)b 16.551 ± 0.008 18.865 ± 0.023 25.923 ± 0.016 28.310 ± 0.011
col9 Inertsil ODS‑3b 17.225 ± 0.006 19.640 ± 0.005 26.754 ± 0.013 29.471 ± 0.005
col10 Alltima Ca
18 20.856 ± 0.008 23.752 ± 0.021 31.687 ± 0.011 34.872 ± 0.004
col11 Symmetry Ca
18 21.016 ± 0.015 22.076 ± 0.016 32.470 ± 0.023 35.476 ± 0.010
col12 Gemini Ca
18 21.300 ± 0.014 23.756 ± 0.007 31.599 ± 0.003 34.337 ± 0.015
col13 CapcellpakC18MGa 21.076 ± 0.012 23.828 ± 0.004 31.627 ± 0.006 34.695 ± 0.001
col14 Zorbax Extend‑Ca
18 17.201 ± 0.022 19.731 ± 0.003 27.525 ± 0.009 30.504 ± 0.005
col15 Sunfire Ca
18 21.652 ± 0.013 24.065 ± 0.024 32.375 ± 0.010 35.197 ± 0.006
col16 Sunfire Cb
18 17.501 ± 0.006 19.571 ± 0.018 27.401 ± 0.004 29.826 ± 0.010
col17 Nucleosil C18 HDa 21.452 ± 0.013 23.735 ± 0.006 32.747 ± 0.019 35.513 ± 0.011
col18 ODS Hypersila 19.669 ± 0.010 21.583 ± 0.022 30.361 ± 0.007 32.657 ± 0.005
col19 CapcellpakC18AQa 20.092 ± 0.013 22.560 ± 0.010 29.568 ± 0.006 32.218 ± 0.005
col20 Spherisorb ODS2a 18.684 ± 0.006 21.334 ± 0.021 28.580 ± 0.008 31.385 ± 0.004
col21 Zorbax SB‑Ca
18 18.438 ± 0.015 20.986 ± 0.010 28.085 ± 0.008 30.849 ± 0.007
col22 DiamonsilCa
18 22.082 ± 0.021 25.078 ± 0.005 32.475 ± 0.020 35.721 ± 0.023
col23 DiamonsilCb
18 16.769 ± 0.007 19.154 ± 0.008 26.240 ± 0.011 28.935 ± 0.004
col24 Diamonsil C18(2)a 19.296 ± 0.016 22.819 ± 0.004 31.192 ± 0.019 34.710 ± 0.009
col25 Kromasil Eternity Ca
18 19.732 ± 0.017 22.099 ± 0.018 29.535 ± 0.004 32.153 ± 0.021
col26 Shim‑pack VP‑ODSb 19.015 ± 0.007 21.059 ± 0.014 29.401 ± 0.002 31.845 ± 0.001
col27 Agilent HC‑Ca
18 23.492 ± 0.247 25.839 ± 0.250 34.884 ± 0.344 37.637 ± 0.330
col28 Agilent TC‑Ca
18 20.609 ± 0.003 22.574 ± 0.005 30.806 ± 0.003 32.783 ± 0.002
col29 Venusil MP Cb
18 17.970 ± 0.007 20.468 ± 0.011 27.287 ± 0.031 29.985 ± 0.007
col30 Nucleosil C18 ABa 18.348 ± 0.012 20.209 ± 0.017 29.233 ± 0.011 31.893 ± 0.014
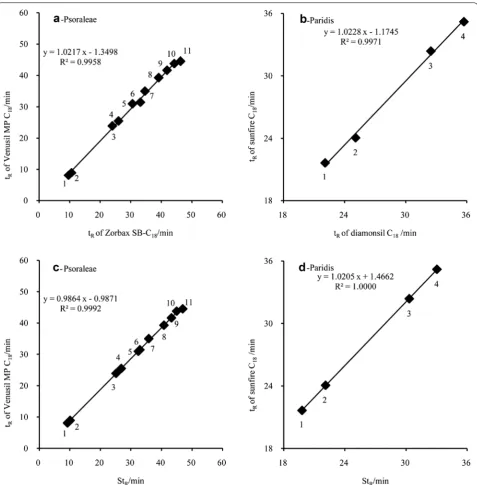
HPLC system (mainly considered as columns) under the same chromatographic conditions [22], as expressed in formula (3) and Fig. 2a, b.
Since formulas (1) and (3) are both linear, thus there is a linear relationship between tR and StR for each
compound, as shown in formula (4) and Fig. 2c, d. It is noteworthy that the correlation coefficient of the linear regression is higher than that shown in Fig. 2a, b.
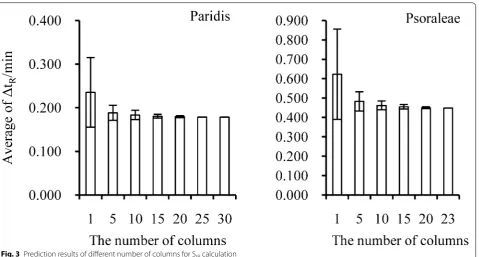
Minimum number of columns for StR calculation
Theoretically, tR on any column can be used as reference
value for linear fitting. But the ΔtR calculated with
ran-dom column were instable. Thus, the reasonable number of columns for StR calculation was thoroughly
investi-gated by random sampling. StR was calculated based on
1, 5, 10, 15, 20, 25, and 30 columns combined with non-replicate random sampling times of 30, 100, 100, 100, 100, 100, and 1, respectively. The value of StR with tRmea
(3)
tRcoli=a×tRcolj+b
(4) tRcoli=a×StR+b
on 30 columns was used to fit multiple point linear equa-tion. The averages of ΔtR (average ± standard deviation)
were calculated, as shown in Fig. 3. For both medicines, the prediction deviation was reduced with increasing number of columns. However, the prediction accuracy will not be significantly improved when the number of columns reaches five, which is considered as a low-cost and reasonable limit. It is recommended to choose five– fifteen columns for StR calculation.
Even for the columns with same type of packing mate-rial, there are still some differences among the column stationary phase, packing techniques and errors in the process of chromatographic analysis. Those differences will cause deviation of tR. The physical explanation of
StR calculation was to evenly mix and refill the
station-ary phase of the columns selected. Because of reducing the random and system errors, the prediction result was accurate and robust.
Procedure of two points prediction
of all other compounds were used as reference value for calculating tRpre. For LCTRS method, two compounds
were chosen as reference compounds (reference sub-stances required), and StR of all other compounds were
used as reference value for calculating tRpre. The
refer-ence compounds, the value of RR and StR were shown in
Tables 2 and 3.
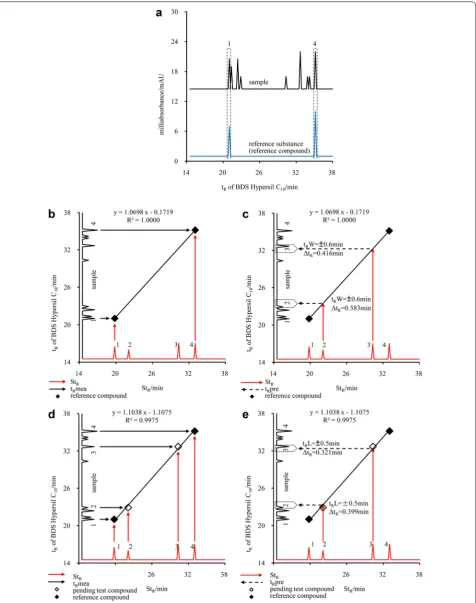
Take Paridis as an example. First of all, reference sub-stances solution of two reference compounds (Chonglou
saponin VII and Chonglou saponin I) and sample solu-tion were performed on a C18 column (col4: BDS Hypersil
C18). The tRmea (21.014 and 35.170 min) of two reference
compounds in the sample solution were obtained by the reference substances solution (Fig. 4a). Then two points, Chonglou saponin VII (19.803, 21.014) and Chonglou saponin I (33.035, 35.170), could be determined in the coordinate using StR as abscissa and tRmea as ordinate.
was given: y = 1.0698x − 0.1719 (Fig. 4b). Taking StR
of analytes (Chonglou saponin VI and Chonglou sapo-nin II) into equation, the tRpre of Chonglou saponin VI
(23.481 min) and Chonglou saponin II (32.263 min) were attained, respectively. Finally, in the chromatogram of the sample solution, the corresponding peaks of Chonglou saponin VI and Chonglou saponin II can be found within the range of tRpre ± tRW (tRW is abbreviation of tR
win-dow, in this case is 0.6 min), as shown in Fig. 4c. It can be seen that ΔtR of analytes calculated by prediction of two
points were 0.583 min and 0.416 min (The tRmea of
ana-lytes were 22.898 min and 32.679 min).
Procedure of multiple points regression
After assignment of the peaks of analytes in the sample solution by prediction of two points regression, the tRmea
of those peaks should be validated by multiple points regression. In this procedure, tRmea and StR of
refer-ence compounds and analytes were used to fit a multiple points linear regression: Y = 1.1038x − 1.1075 (Fig. 4d). Taking StR of analytes (Chonglou saponin VI and
Chon-glou saponin II) into new equation, the new tRpre of
Chonglou saponin VI (23.297 min) and Chonglou sapo-nin II (32.358 min) were calculated. If ΔtR of all analytes
were less than the given tRL (tRL: tR limit, in this case Fig. 3 Prediction results of different number of columns for StR calculation
Table 2 RR and reference compound for RR method
a Reference compound
Peak 1 Peak 2 Peak 3 Peak 4 Peak 5 Peak 6 Peak 7 Peak 8 Peak 9 Peak 10 Peak 11
Psoraleae (n = 23) 0.226 0.247 0.615 0.657 0.794 0.808 0.878 1.000a 1.061 1.103 1.152
Paridis (n = 30) 0.652 0.729 1.000a 1.090
Table 3 StR (min) and reference compound for LCTRS method
a Reference compound
Peak 1 Peak 2 Peak 3 Peak 4 Peak 5 Peak 6 Peak 7 Peak 8 Peak 9 Peak 10 Peak 11
Psoraleae (n = 23) 9.271 10.122a 25.143 26.854 32.437 32.951 35.843 40.793a 43.254 44.950 46.937
is 0.5 min), the prediction was success, otherwise fail-ure (Fig. 4e). In this case, ΔtR were 0.399 and 0.321 min,
respectively. The step of validation by multiple points was based on the principle of stepwise linear regression, which can further improve the prediction accuracy.
The purpose of setting that the tRW is larger than
tRL is to increase the amount of suitable columns and
to improve the accuracy of prediction. Generally, the recommended ranges of tRW and tRL are 0.8–2.0 and
0.5–1.5 min, respectively. If necessary, the values can be adjusted in accordance with different samples under dif-ferent chromatographic conditions. If the ΔtR of some
compounds are large, their tRW and tRL can be set
individually.
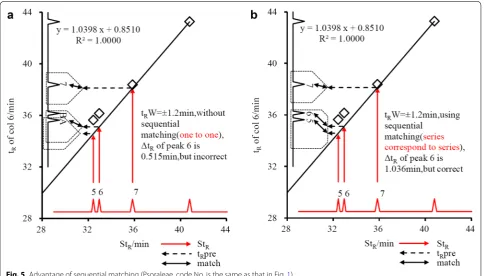
Sequential matching rule
If the tR of two peaks are too close, e.g. less than 2 min,
there would be a mistake for peak matching by the least ΔtR rule. Take Psoraleae for example, as shown in Fig. 5a,
peak #6 was assigned to peak A in the sample solution on col6 (Kromasil C18) with a small ΔtR of 0.515 min.
How-ever, peak #5 was not found and peak B in the sample solution was not matched. When tRW was set as 1.2 min,
tRmea of peak A was within the window of tRpre of peak
#5. tRmea of the peaks A and B would both fall into the
window of tRpre of peak #6. Because of the existence of
one common peak (peak A), peaks #5 and 6 should be
treated as peak series for sequential matching. That is, the earlier tRpre will be matched to the peak with the earlier
tRmea. Although ΔtR of peak #6 increased to 1.036 min,
the match results were correct, as shown in Fig. 5b. This rule can be further applied to multiple-peak series, which has a close tR.
Comparison between LCTRS method and RR method
The comparison among unadjusted RR method, adjusted RR method (dead time was measured by ammonium nitrate as probe compound), prediction by two points, and validation by multiple points was summarized in Tables 4 and 5. The results showed that the unadjusted RR method and adjusted RR method were similar, their prediction accuracy were bigger and suitable for less pos-itive columns. But the prediction deviation was reduced and the number of positive columns was increased by LCTRS method. The best was validation by multiple points which was based on the prediction by two points.
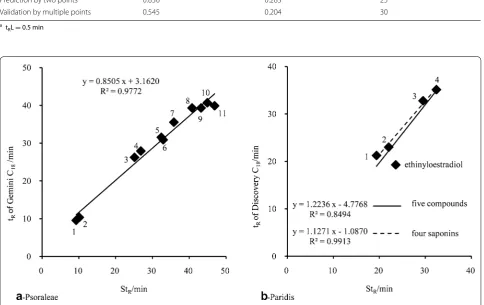
Exclusion of column and compound by linear fitting
Nonlinear shift of tR for a compound on different
col-umns could be caused either by different column pack-ing materials and use of other packpack-ing techniques, or by the different compound structure. In order to exclude the columns and compounds with relatively large nonlinear shift, linear fitting of tRmea and StR were performed. The
following rules were used to identify the outlier column and compound. (1) In a regression scatter plot, the com-pounds obviously deviated from a regression line (the correlation coefficient is usually less than 0.99). (2) ΔtR
was usually larger than 1–2 min. The excluded columns and compounds would not be used for StR calculating.
For Psoraleae: no obvious nonlinear deviation was observed of all 11 compounds. 23 columns met the
requirements (the average of correlation coefficient was 0.9989). The outlier columns were col2, 8, 12 (Fig. 6a), 16, 19, 20 and 30. For Paridis: no obvious nonlinear devia-tion was observed of four saponins. All 30 columns met the requirement with average correlation coefficient of 0.9993.
In order to simulate tR of compound with large
structural difference, reference substances solution of
Table 4 Comparison result by four methods (Psoraleae)
a The columns which meet the following requirements are called positive column, (1) the resolution of peaks meets the requirements; (2) Δt
R of all pending test
compounds are no more than tRL (for Psoraleae is 1.2 min)
Method Maximum of ΔtR/min Average of ΔtR/min Number of positive columnsa
Unadjusted RR 3.494 0.804 2
Adjusted RR 3.001 0.886 3
Prediction by two points 2.194 0.599 5
Validation by multiple points 1.689 0.465 9
Table 5 Comparison of prediction result in four methods (Paridis)
a t
RL = 0.5 min
Method Maximum of ΔtR/min Average of ΔtR/min Number of positive columnsa
Unadjusted RR 1.811 0.420 12
Adjusted RR 1.562 0.410 9
Prediction by two points 0.836 0.283 25
Validation by multiple points 0.545 0.204 30
ethinylestradiol mixing with four Chonglou saponins were used to measure tR of those five compounds on 30
columns. Nonlinear shift of ethinylestradiol was observed on col1 (Fig. 6b), 2–6, 8, 11, 15–18, 26–28 and 30. It appears that the HPLC retention behaviors of ethinyle-stradiol and four Chonglou saponins were significantly different on this chromatographic condition. It further indicated that the classification and similarity evaluation of columns should be based on the characteristics of col-umns as well as analytes.
If the outlier compounds cannot be excluded. The fol-lowing approaches could be used: (1) specify one or more suitable columns; (2) provide reference substances for those compounds; (3) use UV–Vis spectrum and/or mass spectrum for assistant peak identification.
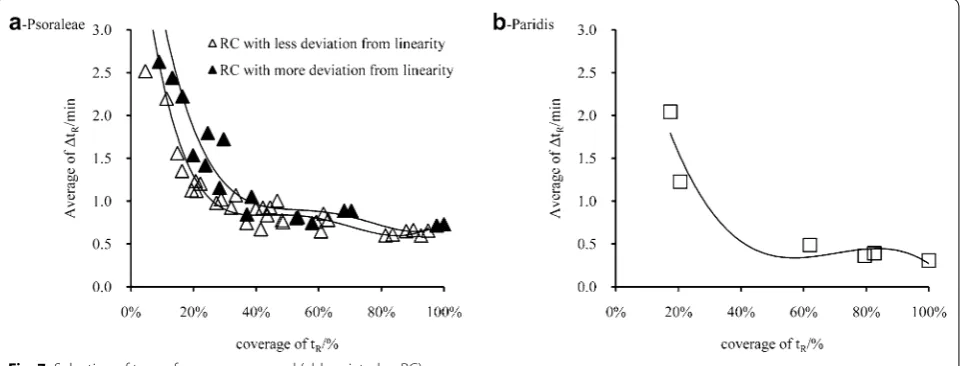
Selection of two reference compounds
Ideally there should be no difference in selecting any of the two compounds as reference compounds. However, because of the difference of HPLC instruments, columns, compounds structure, complexity of elution condition, and accidental error of analysis, different selection of ref-erence compound pairs will make diffref-erences. In order to find out the rule for reference compounds selection, each combination of possible reference compound pairs for the two medicines was studied. The average of ΔtR
cor-responding to each reference compound pair were cal-culated and shown in Fig. 7. It can be seen that, for the two medicines, the ΔtR of prediction by two points step
would be decreased with increasing coverage of tR [as
shown in formula (5). The coverage of tR is a reflex of the
relative position of the two reference compounds. The first compound is at one end (with smaller tR), the last
compound is at the other end (with bigger tR). If the
cov-erage is high, the two reference compounds are near both
ends, otherwise they are in the middle or near the same end]. The coverage corresponding to the smallest ΔtR
was 80–100%.The results of Psoraleae (Fig. 7a) showed the advantage of choosing reference compounds with smaller linear deviation, when the coverages of tR were
similar. Therefore, the optimized reference compounds for Psoraleae were peak #2 and peak #8, rather than peak #1 and peak #11 which had a maximum coverage of tR but with more deviation from linearity. The
selec-tion rule decreases the randomness of choosing reference compounds and the amount of calculation (or the ΔtR of
all possible reference compound pairs will be calculated every time). The accurate and simple selection proce-dures were as follows. Firstly, Select two reference com-pound pairs with large tR coverage (80–100%). Secondly,
exclude compounds with large linear deviation based on the linear fitting results. Thirdly, calculate the ΔtR of the
rest reference compound pairs and select reference com-pound pairs with the smallest ΔtR.
tR2 is tR (or StR) of second reference compound; tR1 is tR
(or StR) of first reference compound; tRlast is tR (or StR) of
last compound; tRfirst is tR (or StR) of first compound.
In summary, the establishment procedures of LCTRS were as follows. Firstly, select five–fifteen different brands of C18 columns, and record the HPLC
chroma-tograms of reference substances and sample on all col-umns. Secondly, calculate initial StR by using all columns,
and perform linear fitting of tR on each column with StR.
Exclude outlier columns and compounds, and recalculate final StR using remaining columns. Finally, select two
ref-erence compounds with large tR coverage and low linear
deviation.
(5) Coverage of tR=
tR2−tR1 tRlast−tRfirst
Discussion
Advantages of LCTRS method
According to the study of Wang et al. [22], tR of the
com-pounds on different HPLC system follows the linearity principle. The RR method can be regarded as external standard one point method, which means the regres-sion line is forced to pass origin. However, most of the linear equations have intercepts, which is why the devia-tion of unadjusted RR method was large. For considering the dead time, adjusted RR method should be better than unadjusted RR method in theory. But the probe com-pound for dead time measurement would be interacted with mobile phases and stationary phases of the columns. The interaction would increase the error in dead time measurement. So the prediction accuracy of this method was not improved in practice. For prediction by two points and validation by multiple points, dead time, gra-dient delay, volume exclusion effect of stationary phase, retention behavior of homologous compounds and so forth, were fully considered. Thus, the prediction accu-racy was significantly improved. Stepwise linear regres-sion was used in the validation by multiple points step, which further improved the prediction effect.
Compatibility of LCTRS method and RR method
Both LCTRS method and RR method are equivalent in mathematics. Formulas can be expressed in the same form. In the LCTRS, calibrated retention (CR) is defined as the ratio of StR of analytes to reference compounds, as
shown in formula (6). Different from RR, CR is based on statistics of StR. Thus, its prediction accuracy was equal
to LCTRS (only equal to prediction by two points).
where tRi is StR of analytes in CR, or tR of analytes in RR;
tR1 is StR of the first reference compound in CR, or dead
time in adjusted RR, or zero in unadjusted RR; tR2 is StR
of the second reference compound in CR, or tR of
refer-ence compound in RR.
Conclusion
A new method for tR prediction of HPLC
chromato-graphic peaks was proposed. 16 compounds in two medi-cines under isocratic or gradient elution conditions were tested through three brands of HPLC instruments with 30 different brands of C18 columns. It is demonstrated
that the method is simple, accurate, and robust for more HPLC columns. Furthermore, the calculation approach of StR and the selection rule of the two reference
com-pounds were discussed.
Both multi-components analysis in TCMs and determi-nation of related substances in pharmaceutical chemicals
(6)
CR=RR= tRi−tR1 tR2−tR1
need lots of reference substances for peak identification. But it may be not affordable for routine analysis and research using all reference substances. LCTRS is a simple and low-cost alternative method for peak identification. Compared with RR method, it need one more reference substance but is more accurate and suitable for more HPLC columns. LCTRS method provides a good prospec-tive application for overall quality evaluation of TCMs and impurities analysis in pharmaceutical chemicals.
Abbreviations
TCMs: traditional Chinese medicines; RR: relative retention; LCTRS: linear calibration using two reference substances; tR: retention time; SSDMC: single
standard to determine multi‑components; StR: arithmetic average of tR; ΔtR:
deviation of tR; tRpre: predicted retention time; tRmea: measured retention
time; CR: calibrated retention.
Authors’ contributions
LS and SCM conceived the study. LS and HYJ designed the study. LS and LPY conducted the experiments. LS, RTT, MJW, LNL and TTZ analyzed the data. LS wrote the manuscript. RTT and SCM revised the manuscript. All authors read and approved the final manuscript.
Author details
1 National Institutes for Food and Drug Control, No. 2 Tiantan Xili, Dongcheng
District, Beijing 100050, People’s Republic of China. 2 Xinjiang Institute for Food
and Drug Control, Urumqi 830004, China. 3 Chemmind Technologies Co.,
Ltd., Beijing 100085, China. 4 Huainan Food and Drug Inspection Center,
Huainan 232007, China.
Acknowledgements
We would like to thank Ms. Yu Pang from Center for Drug Reevaluation and Mr. Chao Zhang from Suzhou Institute for Drug Control for the useful suggestions on this paper.
Competing interests
The authors declare that they have no competing interests.
Availability of data and materials
All data generated or analysed during this study are included in this published article [and its supplementary information files].
Funding
This project was financially supported by Youth Development Research Foun‑ dation of NIFDC (2013WA8), National Natural Foundation of China (81303214) and National Major Scientific and Technological Special Project for “Significant New Drugs Development” (2014ZX09304307‑002).
Publisher’s Note
Springer Nature remains neutral with regard to jurisdictional claims in pub‑ lished maps and institutional affiliations.
Received: 20 February 2017 Accepted: 30 May 2017 Additional file
Additional file 1. PDF of reference 22. The authors have got the permis‑ sion from the copyright holder to use the article.
References
1. Gao XY, Jiang Y, Lu JQ, Tu PF. One single standard substance for the determination of multiple anthraquinone derivatives in rhubarb using high‑performance liquid chromatography‑diode array detection. J Chro‑ matogr A. 2009;1216(11):2118–23.
2. Hou JJ, Wu WY, Da J, Yao S, Long HL, Yang Z, Cai LY, Yang M, Liu X, Jiang BH, Guo DA. Ruggedness and robustness of conversion factors in method of simultaneous determination of multi‑components with single refer‑ ence standard. J Chromatogr A. 2011;1218(33):5618–27.
3. Hou JJ, Wu WY, Liang J, Yang Z, Long HL, Cai LY, Fang L, Wang DD, Yao S, Liu X, Jiang BH, Guo DA. A single, multi‑faceted, enhanced strategy to quantify the chromatographically diverse constituents in the roots of Euphorbia kansui. J Pharm Biomed Anal. 2014;88(88C):321–30. 4. Wu X, He J, Xu H, Bi K, Li Q. Quality assessment of Cinnamomi Ramulus
by the simultaneous analysis of multiple active components using high‑ performance thin‑layer chromatography and high‑performance liquid chromatography. J Sep Sci. 2014;37(18):2490–8.
5. Liao H, Li Q, Liu R, Liu J, Bi K. Fingerprint analysis and multi‑ingredient determination using a single reference standard for Saposhnikoviae Radix. Anal Sci. 2014;30(12):1157–63.
6. Zhong JS, Wan JZ, Liu YP, Ding WJ, Wu XF, Xie ZY. Simultaneous HPLC quantification of seven chromones in Aloe barbadensis Miller using a single reference standard. Anal Methods. 2014;6(12):4388–95.
7. Du YY, Li Q, Liu JJ, Yin YD, Bi KS. Combinative method using multi‑compo‑ nents quantitation by single reference standard and HPLC fingerprint for comprehensive evaluation of Rhodiola crenulatav H. Ohba. Anal Methods. 2014;6(15):5891–8.
8. Da J, Cheng CR, Yao S, Long HL, Wang YH, Khan LA, Li YF, Wang QR, Cai LY, Jiang BH, Liu X, Wu WY, Guo DA. A reproducible analytical system based on the multi‑component analysis of triterpene acids in Ganoderma lucidum. Phytochemistry. 2015;114:146–54.
9. Lu WY, Liu YG, Yang HS, Sheng Y, Shi HM, Yu LL. Simultaneous HPLC quan‑ tification of five major triterpene alcohol and sterol ferulates in rice bran oil using a single reference standard. Food Chem. 2014;148(4):329–34. 10. Zhang YW, Li Q, Lv CX, Liu XJ, Chen XH, Bi KS. Simultaneous deter‑
mination of four active components in Alisma orientale (Sam.) Juz. by HPLC–DAD using a single reference standard. J Pharmaceut Anal. 2015;5(2):85–92.
11. Gilroy JJ, Dolan JW, Snyder LR. Column selectivity in reversed‑phase liquid chromatography: IV type‑B alkyl‑silica columns. J Chromatogr A. 2003;1000:757–78.
12. Gilroy JJ, Dolan JW, Carr PW, Snyder LR. Column selectivity in reversed‑ phase liquid chromatography: V. Higher metal content (type‑A) alkyl‑ silica columns. J Chromatogr A. 1026;2004(1026):77–89.
13. Wilson NS, Gilroy J, Dolan JW, Snyder LR. Column selectivity in reversed‑ phase liquid chromatography: VI. Columns with embedded or end‑ capping polar groups. J Chromatogr A. 2004;1026(1–2):91–100. 14. Visky D, Vander Heyden Y, Iványi T, Baten P, De Beer J, Kovács Z, Noszál
B, Dehouck P, Roets E, Massart DL, Hoogmartens J. Characterisation of reversed‑phase liquid chromatographic columns by chromatographic tests: rational column classification by a minimal number of column test parameters. J Chromatogr A. 2003;1012(1):11–29.
15. Dehouck P, Visky D, Vander Heyden Y, Adams E, Kovács Z, Noszál B, Massart DL, Hoogmartens J. Characterisation of reversed‑phase liquid‑ chromatographic columns by chromatographic tests: comparing column classification based on chromatographic parameters and column perfor‑ mance for the separation of acetylsalicylic acid and related compounds. J Chromatogr A. 2004;1025(2):189–200.
16. Bidlingmeyer B, Chan CC, Fastino P, Henry R, Koerner P, Maule AT, Marques MRC, Neue U, Ng L, Pappa H, Sander L, Santasania C, Snyder L, Wozniak T. HPLC column classification. Pharm Forum. 2005;31(2):637–45.
17. Dolan JW, Maule A, Bingley D, Wrisley L, Chan CC, Angod M, Lunte C, Krisko R, Winston JM, Homeier BA, McCalley DV, Snyder LR. Choosing an equivalent replacement column for a reversed‑phase liquid chromato‑ graphic assay procedure. J Chromatogr A. 2004;1057(1–2):59–74. 18. Snyder LR, Dolan JW, Carr PW. The hydrophobic‑subtraction
model of reversed‑phase column selectivity. J Chromatogr A. 2004;1060(1–2):77–116.
19. Visky D, Haghedooren E, Dehouck P, Kovács Z, Kóczián K, Noszál B, Hoogmartens J, Adams E. Facilitated column selection in pharmaceutical analyses using a simple column classification system. J Chromatogr A. 2006;1101(1–2):103–14.
20. Kóczián K, Haghedooren E, Dragovic S, Noszál B, Hoogmartens J, Adams E. Column selection for pharmaceutical analyses based on a column classification using four test parameters. J Pharm Biomed Anal. 2007;44(4):894–905.
21. Dragovic S, Haghedooren E, Németh T, Palabiyik IM, Hoogmartens J, Adams E. Evaluation of two approaches to characterise liquid chroma‑ tographic columns using pharmaceutical separations. J Chromatogr A. 2009;1216(15):3210–6.
22. Wang LX, Xiao HB, Liang XM. A new method to improve the reproduc‑ ibility of retention time on reversed phase C18 columns in different
laboratories. Chin J Anal Chem. 2003;31(10):1232–6.
23. Sun L, Jin HY, Pang Y, Ma SC. Two reference substances for determina‑ tion of multiple components (1): linear calibration using two reference substances for identification of chromatographic peaks. Chin J Pharm Anal. 2013;33(8):1424–30.
24. Sun L, Pang Y, Jin HY, Liu LN, Ma SC. Two reference substances for deter‑ mination of multiple components II influence of detection wavelength selection on quantitative analysis. Chin J Pharm Anal. 2013;33(9):1578–86. 25. He B, Yang SY, Zhang Y. A new method of calibration and positioning
in quantitative analysis of multi components by single marker[J]. Acta Pharm Sin. 2012;12:1653–9.
26. Department of Health Hong Kong Special Administrative Region The People’s Republic of China. Hong Kong Chinese Materia Medica Stand‑ ards, vol. 3, Government Logistics Department. Beijing; 2012. p. 101. 27. National Commission of Chinese Pharmacopoeia. Pharmacopoeia of