econ
stor
www.econstor.eu
Der Open-Access-Publikationsserver der ZBW – Leibniz-Informationszentrum Wirtschaft The Open Access Publication Server of the ZBW – Leibniz Information Centre for Economics
Nutzungsbedingungen:
Die ZBW räumt Ihnen als Nutzerin/Nutzer das unentgeltliche, räumlich unbeschränkte und zeitlich auf die Dauer des Schutzrechts beschränkte einfache Recht ein, das ausgewählte Werk im Rahmen der unter
→ http://www.econstor.eu/dspace/Nutzungsbedingungen nachzulesenden vollständigen Nutzungsbedingungen zu vervielfältigen, mit denen die Nutzerin/der Nutzer sich durch die erste Nutzung einverstanden erklärt.
Terms of use:
The ZBW grants you, the user, the non-exclusive right to use the selected work free of charge, territorially unrestricted and within the time limit of the term of the property rights according to the terms specified at
→ http://www.econstor.eu/dspace/Nutzungsbedingungen By the first use of the selected work the user agrees and declares to comply with these terms of use.
Egerer, Jonas; Mendelevitch, Roman; von Hirschhausen, Christian
Research Report
A lower carbon strategy for the electricity sector of
Kazakhstan to 2030/50: Scenarios for generation and
network development. Technical report
DIW Berlin: Politikberatung kompakt, No. 85
Provided in Cooperation with:
German Institute for Economic Research (DIW Berlin)
Suggested Citation: Egerer, Jonas; Mendelevitch, Roman; von Hirschhausen, Christian (2014) : A lower carbon strategy for the electricity sector of Kazakhstan to 2030/50: Scenarios for generation and network development. Technical report, DIW Berlin: Politikberatung kompakt, No. 85, ISBN 978-3-938762-76-9, http://nbn-resolving.de/urn:nbn:de:0084-diwkompakt_2014-0857
This Version is available at: http://hdl.handle.net/10419/103976
Politikberatung
kompakt
A Lower Carbon Strategy for the
Electricity Sector of Kazakhstan
to 2030/50
Scenarios for Generation and Network Development
85
Jonas Egerer, Roman Mendelevitch and Christian von Hirschhausen
IMPRESSUM © DIW Berlin, 2014 DIW Berlin Deutsches Institut für Wirtschaftsforschung Mohrenstraße 58 10117 Berlin Tel. +49 (30) 897 89‐0 Fax +49 (30) 897 89‐200 www.diw.de ISBN‐10 3‐938762‐76-4 ISBN‐13 978‐3‐938762‐76-9 ISSN 1614‐6921 urn:nbn:de:0084-diwkompakt_2014-0857 Alle Rechte vorbehalten. Abdruck oder vergleichbare Verwendung von Arbeiten des DIW Berlin ist auch in Auszügen nur mit vorheriger schriftlicher Genehmigung gestattet.
DIW Berlin: Politikberatung kompakt 85
Jonas Egerer
1,2Roman Mendelevitch
1Christian von Hirschhausen
1,2A Lower Carbon Strategy for the Electricity Sector
of Kazakhstan to 2030/50
Scenarios for Generation and Network Development
Technical Report
Berlin, August 2014
Study developed within the frame of the project “Integrated Approach for the Development of Climate-Friendly Economies in Central Asia”, carried out by a consortium coordinated by DIW econ and supported by the International Climate Change Initiative of the Federal Ministry of Environment, Nature Conservation and Nuclear safety of Germany
1
DIW Berlin, Department Energy, Transportation, Environment, Mohrenstr. 58, 10117 Berlin, Germany. E-mail: [email protected].
2 Berlin Institute of Technology, Workgroup for Infrastructure Policy (WIP), Str. des 17. Juni 135, 10623
Table of Contents
Table of Contents
Table of Contents... I List of Tables ... III List of Figures ... IV Abbreviations ... V
1 Introduction ... 1
2 Lessons from Low-Carbon Transformations: Europe and Germany ... 3
3 The Kazakh Energy Sector ... 6
4 The Kazakh Electricity Sector ... 9
Electricity Demand ... 10
4.1 Electricity Supply ... 12
4.2 4.2.1 Conventional power generation capacities ... 12
4.2.2 Renewables Potential: Wind and Solar ... 15
4.2.2.1 Wind Power ... 15
4.2.2.2 Solar Power ... 17
4.2.2.3 Fluctuating Renewable Generation in Type-Hours ... 18
High-voltage Transmission Network ... 19
4.3 5 Scenarios for Kazakhstan in the Year 2030 ... 20
Overview on Scenarios ... 20
5.1 5.1.1 KEGOC Masterplan ... 20
5.1.2 Scenario Data of Generation Capacity on National Level ... 21
Costs for Decommissioning, Refurbishment and New Investment ... 22
5.2 Changes in Regional Generation Capacity ... 26
5.3 5.3.1 The Conventional Scenario ... 26
5.3.2 The Renewables Scenario ... 27
5.3.3 The Efficiency Scenario ... 28
6 Scenario Results ... 31
Network Topology and Options for Investment ... 31
6.1 Model Description ... 32
6.2 Results of the Network Expansion Model... 34
6.3 6.3.1 Electricity System Costs ... 34
Table of Contents
6.3.3 Annual CO2 Emissions ... 38
6.3.4 Expansion of the AC and DC Network ... 39
6.3.5 Flows between the Western and Eastern Network ... 40
7 Conclusion and Outlook to 2050 ... 42
Discussion of the Scenarios in the 2050 Perspective ... 42
7.1 Conclusion on Policy Implications ... 43
7.2 8 References ... 46
List of Tables
List of Tables
Table 1: Regional Electricity Demand today and 2030 ... 10
Table 2: Aggregate of the Generation Data for 2011 ... 13
Table 3: Price Assumptions on Resources for 2010 and 2030 ... 14
Table 4: Assumption on Investment Costs for Generation Capacity ... 15
Table 5: Planned Wind Installations until 2016 ... 16
Table 6: Type-Hours for Wind ... 18
Table 7: Installed Generation Capacities and Shares in KEGOC Masterplan ... 20
Table 8: Investment Costs for Generation Capacity in the Conventional and Renewables Scenario... 24
Table 9: Regional Change in Conventional Capacity until 2030 in the Conventional Scenario ... 27
Table 10: Regional Change in Conventional Capacity until 2030 in the Renewables Scenario ... 28
Table 11: Regional Change in Conventional Capacity until 2030 in the Efficiency Scenario ... 30
Table 12: Investment Costs of the Scenarios in the Electricity System until 2030 ... 34
Table 13: Annual Variable Costs of the Scenarios in the Electricity System 2030 ... 35
Table 14: Annual Utilization, Generation and CO2 Emissions for the Conventional Scenario ... 36
Table 15: Annual Utilization, Generation and CO2 Emissions for the Renewables Scenario ... 37
Table 16: Annual Utilization, Generation and CO2 Emissions for the Efficiency Scenario ... 37
List of Figures
List of Figures
Figure 1: The Decarbonization in the European Energy and Power Sector ... 3
Figure 2: The Scenario Outlook for Germany in 2033 and the Role of Renewables and Natural Gas ... 5
Figure 3: Economical and Political Regions of Kazakhstan ... 6
Figure 4: Existing and Proposed Gas Pipelines in Kazakhstan... 7
Figure 5: Age Structure of the Power Plant Fleet and Projected Investments ... 9
Figure 6: Population Distribution on District Level in 2011 ... 11
Figure 7: Hourly Demand of Peak Demand Day and Modeled Summer and Winter Days ... 12
Figure 8: Spatial Distribution of Installed Generation Capacity for Kazakhstan in 2011 ... 13
Figure 9: Kazakhstan Wind Resource Map ... 16
Figure 10: Kazakhstan Solar Global Horizontal Irradiation ... 17
Figure 11: Type-Hours for Photovoltaic ... 18
Figure 12: Digitalized Map of the High-Voltage Transmission Network of Kazakhstan ... 19
Figure 13: Installed Generation Capacities in 2011 and for the three Scenarios in 2030 ... 22
Figure 14: Decommissioned (OFF), Unaffected (OK), Refurbished (REF), and New Capacity (NEW) ... 23
Figure 15: Technology Costs and Price Duration Curve ... 25
Figure 16: Local Investment in New Generation Capacity in the Conventional Scenario ... 26
Figure 17: Local Investment in New Generation Capacity in the Renewables Scenario ... 28
Figure 18: Local Investment in New Generation Capacity in the Efficiency Scenario ... 29
Figure 19: Topology for Transmission Investment Model in 2030 ... 31
Figure 20: CO2 Emission for Scenarios and Technologies ... 38
Figure 21: Expansion Decisions in the Conventional Scenario in 2030 ... 39
Figure 22: Expansion Decisions in the Renewables Scenario in 2030 ... 40
Figure 23: Exchange Flows on DC Connector between the Western and Eastern Electricity Network ... 41
Abbreviations
Abbreviations
AC Alternating current
bcm/a Billion cubic meter per year
bn Billion (1,000,000,000)
CC Combined cycle
CCGT Combined cycle gas turbine
CHP Combined heat and power
DC Direct current
EU-ETS European emissions trading system
GT Gas turbine
GTPP Gas turbine power plant
WEP Wind energy plant
HVDC High voltage direct current
M Million
Mbbl/d Million barrel per day
RoR Run of River
ST Steam turbine
Introduction
1
Introduction
Kazakhstan has taken commitments for a long-term climate policy including an emission trading system (ETS) that was introduced in 2013. A further linking with the European EU-ETS is discussed. However, the instrument set to reach the climate policy targets of lower greenhouse gas (GHG) emissions is yet somewhat unclear. Undoubtedly, a major share of the GHG reduction effort must come from the electricity sector, just as in the European Union where model forecasts and EC plans call for a full decarbonization of the electricity sector until 2050. This report thus sets out elements of a lower carbon strategy for the elec-tricity sector of Kazakhstan at the horizon 2030/2050. As part of the Kazakh „green growth“
strategy, the report identifies pathways to lower the greenhouse gas emissions, mainly CO2,
from the electricity sector.
The report takes KGOC’s estimates for 2030 as the basis to develop a “Conventional” scenar-io, and, since this base scenario is clearly not “low-carbon”, then develops two lower-carbon alternatives: i) a „Renewables“ and, ii) an „Efficiency“ scenario. It compares the system
costs, the generation mix, CO2-intensities, as well as the institutional conditions that favor
such lower-carbon pathways. The assumptions of the Conventional Scenario for 2030 are largely based on the KEGOC “Masterplan” (KEGOC, 2011). We have complemented the gen-eration data base to arrive at a regional representation of the Kazakh electricity system on the unit level. Generally, the “Masterplan” envisages a continuation of reliance on coal as the primary fuel for electricity generation. By contrast, the Renewables scenario constitutes a major change in the electricity system with 30% of the electricity generated in 2030 com-ing from wind and solar (PV). A third, more strcom-ingent, “Efficiency” scenario with stricter effi-ciency efforts (including demand-side management for peak shaving), may be a compromise between the two first scenarios.
The report is based on extensive analytical work on the Kazahk electricity sector, and also relies on previous experience of lower-carbon strategies in Europe and in Germany. It dis-cusses the potential contribution of the electricity sector to the reduction of GHG emissions in Kazakhstan and sketches out pathways towards different kinds of electricity systems for 2030. The considerations explicitly take into account the national resource base and long-term commitments. It is structured in the following way: Section 2 provides a description
Introduction
and analytical insights on lower-carbon strategies at the European level („EU Energy Roadmap“) as well as at national level in Germany („Energiewende“). The subsequent Sec-tion 3 gives a general to the Kazakh energy sector and SecSec-tion 4 sets out the point of incep-tion of the Kazakh electricity sector including generaincep-tion and transmission infrastructure. Additionally, it surveys the potential for renewable energy sources (i.e. solar and wind). Section 5 proposes two alternatives to the high-carbon „Conventional“ scenario that is de-rived from KEGOC’s 2030 “Masterplan”. These alternatives are a „Renewables“ and an „Effi-ciency“ scenario. Section 6 then calculates, based on an electricity sector model, the
implica-tions of the different strategies, in terms of electricity system costs, CO2-emissions, and
network extension. The last section concludes with an interpretation of the model results and provides policy implications and a 2050 perspective.
Lessons from Low-Carbon Transformations: Europe and Germany
2
Lessons from Low-Carbon Transformations: Europe and Germany
Both Europe and Germany have embarked on pathways towards a largely decarbonized electricity sector by 2050. Europe has defined policy targets in the „Energy Roadmap 2050“, including the reduction of greenhouse gases by 80-95 % (compared to 2005), and a full de-carbonization of the electricity sector (to allow other sectors, such as transport and industry, a higher GHG-budget) (see Figure 1). In addition to a „Reference“ scenario which under cur-rent policy misses the GHG reduction target, the „High Renewables“ scenario sketches out a pathway of 85 % renewable electricity supply, whereas the „High Efficiency“ scenario indi-cates ways towards lower electricity consumption.
Figure 1: The Decarbonization in the European Energy and Power Sector Source: European Commission (2011).
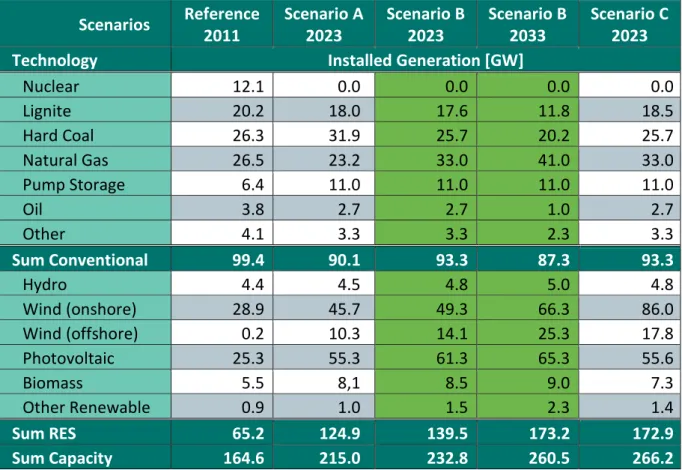
Germany has likewise embarked on an ambitious path to decarbonize its energy sector, and push the use of renewable source in the electricity sector beyond 50 % in 2030, and beyond 80 % in 2050 (with a share of renewables in primary energy of 60 % by 2050). This is accom-panied by an integrated approach to develop generation, transmission, and demand-side resources into a comprehensive market design. Just like Europe, the German government has set out a „Reference“ scenario (Scenario B) until 2033, with upper and lower scenarios („A“, and „C“) defined at the horizon 2023 (Table 1).
Lessons from Low-Carbon Transformations: Europe and Germany
The use of natural gas is the most critical issue both with respect to a lower-carbon energy mix, and to spur the flexibility of the electricity system with a high share of intermittent renewables. Given that new nuclear plants are too expensive, and that there is no hope for a low-carbon use of coal in the foreseeable future, natural gas is the „natural“ partner for a lower-carbon energy transformation. Natural gas will help to bridge the lower-carbon elec-tricity sector in the next decades, but will then cede market shares to the renewables and, thus, decline in importance in a 2050 perspective. To fulfill this purpose new gas-fired power plants have to substitute the remaining coal-fired capacity as base technology. In the
scenar-ios by the German government this is enforced with an emission price of 45 €/t CO2 in 2033
(see Figure 2). In addition to the nuclear phase-out by 2022, the fuel with the highest carbon intensity, lignite, starts to phase out, too. No new projects are realized and almost half of the existing capacity is shut down by 2033.
Table 1: Scenario Framework for the “Energiewende” in Germany Source: Bundesnetzagentur (2012).
Scenarios Reference 2011 Scenario A 2023 Scenario B 2023 Scenario B 2033 Scenario C 2023
Technology Installed Generation [GW]
Nuclear 12.1 0.0 0.0 0.0 0.0 Lignite 20.2 18.0 17.6 11.8 18.5 Hard Coal 26.3 31.9 25.7 20.2 25.7 Natural Gas 26.5 23.2 33.0 41.0 33.0 Pump Storage 6.4 11.0 11.0 11.0 11.0 Oil 3.8 2.7 2.7 1.0 2.7 Other 4.1 3.3 3.3 2.3 3.3 Sum Conventional 99.4 90.1 93.3 87.3 93.3 Hydro 4.4 4.5 4.8 5.0 4.8 Wind (onshore) 28.9 45.7 49.3 66.3 86.0 Wind (offshore) 0.2 10.3 14.1 25.3 17.8 Photovoltaic 25.3 55.3 61.3 65.3 55.6 Biomass 5.5 8,1 8.5 9.0 7.3 Other Renewable 0.9 1.0 1.5 2.3 1.4 Sum RES 65.2 124.9 139.5 173.2 172.9 Sum Capacity 164.6 215.0 232.8 260.5 266.2
Lessons from Low-Carbon Transformations: Europe and Germany
Figure 2: The Scenario Outlook for Germany in 2033 and the Role of Renewables and Natural Gas Source: Bundesnetzagentur (2012).
Realizing the impact of high shares of renewables (e.g. in Figure 2 they exceed peak demand twice for Germany in 2033) there is a broad consensus that the traditional market design is not suited to accompany the lower-carbon transformation. This regards both the market segments, which do not include sufficient flexibility resources, as well as financing aspects of new generation (conventional or renewable). Issues like flexibility markets, capacity instru-ments, renewable feed-in tariffs, and the like may also become relevant for the lower-carbon transformation in Kazakhstan.
0 20 40 60 80 100 120 140 160 180 200 0 50.000 100.000 150.000 200.000 250.000 Marginal Costs [€/MWh] Capacity [MW]
Hydro Wind Onshore Wind Offshore Photovoltaic
Biomass Nuclear Lignite Waste
Gas Coal Oil
The Kazakh Energy Sector
3
The Kazakh Energy Sector
Kazakhstan is the largest of the former Soviet Union republics after Russia. It has 15.7 million inhabitants and a size five times as big as Germany. Administratively, it is divided in 14 re-gions (see Figure 3). It has a continental climate with cold winters in the north and hot sum-mers in the south.
Figure 3: Economical and Political Regions of Kazakhstan Source: Wild Natures (2003).
The breakdown of the Soviet Union caused a severe economic downturn to the closely linked Kazakh economy. During this period the contribution of industry to the GDP fell from 31 to 21 percent (Library of Congress, 2006). International investments, mainly in the oil sector, restored the country’s economy. While Kazakhstan has accomplished a privatization of formerly state owned companies and has promoted unbundling in the energy and other sectors in the 1990s (there has been some re-nationalization since), the economy still suffers from a low diversification. The government wants to address this issue with goals to estab-lish domestic renewable energy, pharmaceutical and other innovative industries. Kazakhstan has joined a trade union with Russia and Belarus to facilitate commodity flows and to incen-tivize foreign investments into this region (CIA Factbook, 2012). Moreover, the country is expected to become a WTO member in 2013.
The Kazakh Energy Sector
Most regions are characterized by mostly agricultural activity (Akmola, Almaty, Zhambyl, Kostanai, North Kazakhstan, South Kazakhstan) and (non-oil) industrial activity is concentrat-ed in East Kazakhstan, Karagandy, and Pavlodar. Kazakhstan has three main industrial re-gions: The western regions with their oil and gas resources and associated industries, the northern regions that are strongly bound to Russia and comprise the main non-oil industry, and South Kazakhstan (Almaty region).
Kazakhstan is rich of natural resources, in particular oil, natural gas and coal. Atyrau, Man-gystau and West Kazakhstan are the main oil and gas producing regions of the country. With an oil production of 1.6 (1.4 for export) mbbl/d in 2012 and a gas production of 36 bcm/a (currently 75 percent of the produced volumes are being re-injected to enhance oil recovery) Kazakhstan is a major oil exporting country and is expected to become a significant gas ex-porter in the future (EIA, 2012). The energy intensive oil processing is currently accom-plished at three sites: close to production centers in city of Atyrau, in the Pavlodar region, which is supplied with crude oil from Siberia and in Shymkent, in the South Kazakhstan re-gion, which is served from smaller oil fields in central Kazakhstan. Gas processing plants are located in Mangystau, Akotbe, and Pavlodar region (Yenikeyeff, 2008).
Figure 4: Existing and Proposed Gas Pipelines in Kazakhstan Source: EIA (2008).
While Kazakhstan used to be a net importer of natural gas, the produced volumes are nowa-days sufficient to satisfy domestic demand. However, due to its two separate natural gas
The Kazakh Energy Sector
transportation systems in the west and in the south of the country, inherited from the Soviet era, the gas produced in the Atyrau and Mangystau regions cannot supply demand in the economic centers in the north and the south of the country. Therefore, at the moment, the country still needs to import natural gas from Uzbekistan which supplies the southern indus-trial belt (see Figure 4). The construction of the Beineu-Bozoi-Akbulak pipeline which is scheduled to deliver 5 bcm per year by 2015 will decrease the dependency on Uzbek natural gas supply (EIA, 2012).
The Kazakh Electricity Sector
4
The Kazakh Electricity Sector
The Kazakh electricity sector will face some major challenges in the next years. It will have to supply increasing electricity demand, while relying on an aging power plant fleet. Figure 5 shows the age structure of the electricity generation capacity. It reveals that a substantial share of the current capacity consists of old coal-power plants from the Soviet era. About 10 GW of coal power plants and 1 GW of natural gas power plants have been built before 1990 whereof 6 GW of the coal power plants even before 1980. A generation that is largely based on coal will also be a challenge with respect to greenhouse gas emissions.
There is also a spatial challenge of transmission infrastructure for having one single internal electricity market in Kazakhstan. The electricity transmission system today is still largely based on the integration in former Soviet Union system. Among other particularities, it in-cludes a 1,150 kV transit line which connects hydropower from Siberia to industrial centers in central and western Russia.
Figure 5: Age Structure of the Power Plant Fleet and Projected Investments Source: Own illustration based on data from KazNIIEK (2012b) and KEGOC (2011).
0 5.000 10.000 15.000 20.000 25.000 30.000 35.000 1960 1970 1980 1990 2000 2010 2020 2030 Capacity [MW] Year Projection Gas Coal Hydro
The Kazakh Electricity Sector
Electricity Demand 4.1
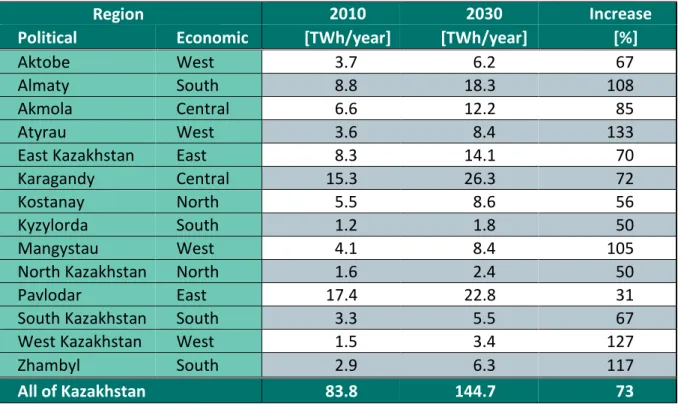
The spatial character of an electricity market is determined by local demand for electricity and district heat. On the generation side the main constraints are the local availability of fossil fuels at a competitive price and the renewable energy potential, respectively. The high-voltage transmission system has to bridge the distance between generation and demand centers. This section analyses current electricity demand, generation and transmission data for Kazakhstan which are required for developing a consistent electricity market model. The annual electricity demand in Kazakhstan amounts to 83.8 TWh/year in 2010 and is ex-pected to increase by 73 % to 144.7 TWh/year in 2030 (Table 1). The data reveals a strong concentration of demand in the central and eastern economic region. Yet there, only the Akmola region with 85 % is expected to have demand growth rates above the national aver-age of 73 % until 2030. The western regions of Atyrau (133 %), West Kazakhstan (127 %), and Mangystau (105 %) and the southern regions of Zhambyl (117 %) and Almaty (108 %) are expected to see the highest growth rates. Until 2030, these five regions increase their joint contribution to Kazakhstan’s total electricity demand from 25 % to 31 %.
Region 2010 2030 Increase
Political Economic [TWh/year] [TWh/year] [%]
Aktobe West 3.7 6.2 67
Almaty South 8.8 18.3 108
Akmola Central 6.6 12.2 85
Atyrau West 3.6 8.4 133
East Kazakhstan East 8.3 14.1 70
Karagandy Central 15.3 26.3 72
Kostanay North 5.5 8.6 56
Kyzylorda South 1.2 1.8 50
Mangystau West 4.1 8.4 105
North Kazakhstan North 1.6 2.4 50
Pavlodar East 17.4 22.8 31
South Kazakhstan South 3.3 5.5 67
West Kazakhstan West 1.5 3.4 127
Zhambyl South 2.9 6.3 117
All of Kazakhstan 83.8 144.7 73
Table 1: Regional Electricity Demand today and 2030 Source: KEGOC (2011).
The Kazakh Electricity Sector
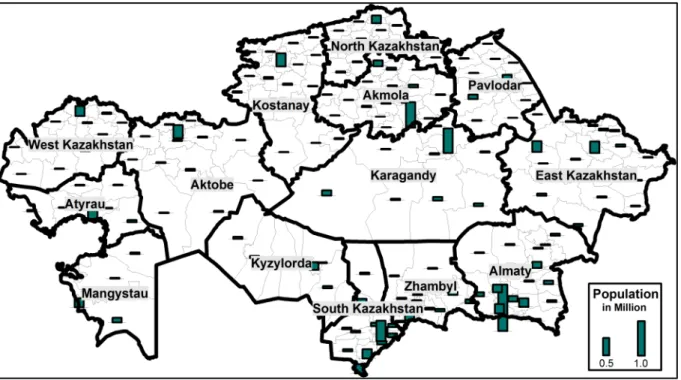
The distribution of demand is very heterogeneous within the 14 regions of Kazakhstan. Therefore, the regional demand is further disaggregated to district level based on population data. Here we assume that demand for electricity is correlated with population. Figure 6 shows the population distribution on the district level. This data enables a more precise allocation of regional demand to the respective network nodes (substations) of the trans-mission system. For the development of scenarios, demand allocation on the districts and network nodes is kept constant from 2010 to 2030, for each region.
Figure 6: Population Distribution on District Level in 2011
Source: Own illustration based on Agency of Statistics of the Republic of Kazakhstan (2012).
Since electricity demand strongly differs between seasons as well as between hours of day, we do not use yearly data but further refine it. The time resolution is abstracted from 8,760 hours per year to three representative days for the winter and summer season, respectively. We derive a reference value on the distribution of demand between summer and winter (KazNIIEK, 2012a) and employ it to arrive at consumption values for the respective sentative day. The load curve of each day is split into 24 different time slices (hours) repre-senting hourly load variation (Figure 7). The data on demand variation is derived from the day with the highest demand in 2011 and employed accordingly. The average winter and summer day is weighted with 0.8 compared to 0.1 for the respective low and high demand
The Kazakh Electricity Sector
days. If scaled up to one year the load curves of the representative days cover the annual demand of the respective year.
Figure 7: Hourly Demand of Peak Demand Day and Modeled Summer and Winter Days Source: Own illustration based on data provided by KazNIIEK (2012a).
Electricity Supply 4.2
4.2.1 Conventional power generation capacities
Data on conventional coal and gas-fired power stations is disaggregated to the individual blocks of each power plant. The database contains information on location, fuel in use, gen-eration technology, installed and available gengen-eration capacity, efficiency, combined heat and power (CHP) capabilities, and year of installation of the respective power plant block. The detailed list of power plants is attached in the Appendix. The aggregate (Table 2) illus-trates the importance of coal for the electricity system in Kazakhstan. A significant share of the installed capacity is equipped with CHP indicating the strong linkage between electricity generation and district heat supply. The low share of currently available generation capacity originates from an old and technologically outdated power plant fleet (KazNIPIITES, 2010). In 2011 electricity generation from conventional fossil power plants sum up to 78.7 TWh. At the same time power plants equipped with CHP produced 44.7 TWh of district heat as a by-product. 7.9 TWh of electricity was produced from hydro power. There is hardly any renew-able electricity generation other than hydro, i.e. solar and wind.
5.000 10.000 15.000 20.000 25.000 1 5 9 13 17 21 MW Hour 2010 5.000 10.000 15.000 20.000 25.000 1 5 9 13 17 21 MW Hour 2030 5.000 10.000 15.000 20.000 25.000 1
Winter High Winter Avg Winter Low
Summer High Summer Avg Summer Low
The Kazakh Electricity Sector
Fuel Type Technology CHP Total Capacity
[MW] Available Ca-pacity [MW]
Coal-fired plant Steam Turbine Steam Turbine No Yes 7,430 4,602 5,045 3,749
Gas-fired plant Gas Turbine Steam Turbine No Yes 1,448 2,498 1,180 1,840
Hydro power plant Renewable No 2,272 1,953
Solar and Wind - -
Sum of Capacity: 18,250 13,767
Table 2: Aggregate of the Generation Data for 2011 Sources: KazNIPIITES (2010) and data provided by KazNIIEK (2012b).
Figure 8: Spatial Distribution of Installed Generation Capacity for Kazakhstan in 2011 Source: Own illustration based on data provided by KazNIIEK (2012b).
Figure 8 illustrates the spatial distribution of power plants by capacity and fuel type in Ka-zakhstan. The main characteristic is the concentration of coal generation capacity on the north-east. In total, 72 % of the generation capacity is located in the central and east eco-nomic region but the regional demand share is only about 57 %. With the exceptions of the city of Almaty and Taldykorgan, the southern and western regions of Kazakhstan are sup-plied from gas-fired generation. All major cities have local CHP plants ensuring the district heat supply during the winters. The clear separation between coal and gas capacity results
The Kazakh Electricity Sector
from the local access to either coal resources or gas production and pipelines.1 Hydro power
is available in East Kazakhstan, Almaty, and South Kazakhstan and amounts to 12 % of the total installed capacity.
The variable generation costs for the individual power plants are derived from the input fuel
price, the CO2 content per MWhthermal of the respective fuel in use, the respective efficiency
factor and the assumed CO2 emission price.
Table 3 shows the assumed fuel prices for coal and gas. A common estimate of the CO2 price
in Europe in 2030 is about 40 €/t CO2 (50Hertz et al., 2012). Kazakhstan has currently set up
an EU-ETS-style carbon trading system including emissions from power generation and other
sources. For 2030 we assume a CO2 price of 20 €/t and perform a sensitivity analysis on
mar-ket coupling with the EU-ETS by using a CO2 price of 40€/t.
Efficiency values for the existing power plant fleet are not available on plant or block level. They are estimated based on the respective year of installation. For existing conventional plants efficiency values range between 25 and 43 %. Refurbishments improve the efficiency to 38 %. New steam and gas turbine plants are assumed to have an efficiency of 45 % and new CCGT plants 60 %, respectively.
Fuel type Unit 2010 2030
Coal €/MWh 5 6
Gas €/MWh 13 19
Table 3: Price Assumptions on Resources for 2010 and 2030 Source: DIW Econ (2011).
As outlined by KazNIPIITES (2010), existing generation capacity includes a high share of aging power plants which have to undergo refurbishments if they want to re-enter or remain in the market. In this study, we assume a technical lifetime of 40 years for gas-fired and 50 years for coal-fired power plants. In addition, the increasing demand for electricity also
1 Coal resources: Ekibastuz (Pavlodar region), Karagandy (Karagandy region) and Kushmurun (Kostanay region).
Gas resources: among others, Tengiz (Atyrau region), Tolkyn (Mangystau region), Karachaganak (West Kazakhstan region), Kukmol (Karagandy and Kyzylorda region). Supplied by gas pipeline: Aktobe, Kostanay, South Kazakhstan and Almaty re-gions. Supplied by coal trains: Almaty and East Kazakhstan rere-gions.
The Kazakh Electricity Sector
quires new investments in generation capacity. The cost of maintaining and expanding the power plant fleet depends on the choice of technology. The investment costs (Table 4) are used to give an indication of the fixed cost related to the scenarios. Refurbishments are assumed to be associated with 50 % of the fixed cost for new installations.
Fuel Type Technology New / Re-furbished Investment Costs 2010 [€/kW]
Investment Costs 2030
[€/kW]
Coal Power Plant Steam Turbine Steam Turbine New Refurb. 1,300 650 1,153 576
Gas Power Plant
Gas Turbine New 400 400
Gas Turbine Refurb. 200 200
Steam Turbine New 400 400
Steam Turbine Refurb. 200 200
Combined Cycle New 800 729
Hydro Power Plant New Refurb. 3,000 1,500 3,000 1,500
Nuclear Power Plant New 6,000 5,671
Onshore Wind New 1,300 1,182
Photovoltaics New 1,800 1,207
Table 4: Assumption on Investment Costs for Generation Capacity Source: Schröder et al. (2012).
4.2.2 Renewables Potential: Wind and Solar 4.2.2.1 Wind Power
The Government of Kazakhstan has adopted “The Program of Wind Power Development till 2030” which defined non-conventional power development as one of the priority profiles (Maximov, 2010). Kazakhstan possesses enormous potential of wind energy, especially at the Dzungarian Gate and the Shelek Corridor in the Almaty region. It should be noted that almost the entire territory of Kazakhstan shows favorable conditions for installation of wind power plants (Figure 9). Despite the great potential, the current installed wind capacity in Kazakhstan is limited to a 0.5 MW plant in Dostyk at the Dzungarian Gate and 1.5 MW in the Zhambyl region.
The Kazakh Electricity Sector
Figure 9: Kazakhstan Wind Resource Map Source: Parsons Brinckerhoff (2011).
Company Region Planned Start of Operation Capacity [MW] Installed
The first wind farm Akmola (Ereimentau) 2013 45
Green Energy Аlmatу Almaty 2013 51
NAR Zhambyl 2015 75
South Wind Power Mangystau 2015 42
ТОО «Synergy Astana» Kostanay (Arkalyk) 2014 48
Central Asia Green Power Zhambyl 2013 - 2016 100
Spain Consulting East Kazakhstan 2013 24
Table 5: Planned Wind Installations until 2016 Source: KazNIIEK (2012c)
The most promising sites for wind power development are (i) in the South-eastern part of the country; the Dzungarian Gate (wide-gap south from the Alakol lake to the border with China), the Chu-Iliysky mountains in the area of the town of Tien-Shan and off spurs (Karatau ridge) in the area of Zhambyl; (ii) in the western part of the country the Urals southern off spurs (Mugojar mountains) and the Caspian zone with the Mangyshlak peninsula; and (iii) in
The Kazakh Electricity Sector
the northern part of the country. Currently, envisaged projects account for a total of 400 MW installed by 2016 (Table 5).
4.2.2.2 Solar Power
No notable development has taken place for solar electricity generation, so far. In the next two decades, the technology could be a relevant factor in increasing the renewable share of the electricity system for several reasons.
Firstly, the solar energy resource potential is no binding constraint given the vast territory of Kazakhstan that is subject to considerable sunlight exposure due to its geographic location. The best conditions for photovoltaic are in the southern part of the country (Figure 10) with a high number of sunlight hours (2,200-3,000 per year) and solar irradiation of
1,300-1,800 kW/m2 per year.
While investment cost in photovoltaic has been at 3,000 €/kW and higher five years ago, enormous price reduction could be observed in the last years. Today installation cost per kW for multi-megawatt plants are well below 1,500 € which is the same range as onshore wind power plants. Photovoltaic has a lower annual load factor than wind but possesses good correlation in its availability with the demand levels during the day.
Figure 10: Kazakhstan Solar Global Horizontal Irradiation Source: EBR Renewables (2012).
The Kazakh Electricity Sector
4.2.2.3 Fluctuating Renewable Generation in Type-Hours
The fluctuating character of the availability of wind and PV can be modeled employing a limited number of type-hours. We assume an average availability of 0.36 or about 3,150 load hours per year for the wind power plants in Kazakhstan. The wind generation is differentiat-ed in three type-hours both for the winter and the summer days (Figure 11). The mdifferentiat-edium hour is weighted with 0.6 and assumes availability factors of 0.3 for summer days and 0.42 for winter days. The low and high wind hours are weighted with 0.2 each and have signifi-cantly lower/higher availability factors. For PV installations in southern Kazakhstan we as-sume an average availability of 0.18 or about 1,580 load hours per year. Two separate curves for the hourly availability of PV are used to differentiate between winter and summer days (Figure 11).
Low Wind Medium Wind High Wind
Weight 0.2 0.6 0.2
Season Summer Days Winter Days 0.08 0.06 0.42 0.30 0.76 0.54
Table 6: Type-Hours for Wind
Figure 11: Type-Hours for Photovoltaic
0,00 0,20 0,40 0,60 0,80 1,00 1 5 9 13 17 21 Availability Hours Winter Summer
The Kazakh Electricity Sector
High-voltage Transmission Network 4.3
Building on network data from KEGOC (2012) a comprehensive representation of the Kazakh high-voltage transmission system is developed. We digitalized the network map (Figure 12) which consists of 224 network nodes and a total of 277 power lines on three different volt-age levels (1150 kV in green, 500 kV in red and 220 kV in black color). The data contains information on the location of the network node and combines the network topology with regional generation and demand. For power lines it includes the number of circuits and the length of each network link in kilometers to approximate the resistance and reactance as well as investment costs of the respective connection.
Today’s electricity system consists of two separated transmission networks for Kazakhstan. The western part of the country is still isolated from the rest of Kazakhstan. The integration of both markets within the next years is discussed in the scenario section. In the Eastern part of the country the north-east is well connected into the Russian system while the connection to the population centers in the south, has been enforced with a second 500 kV link in 2010. The cross-border connections to its neighbors (Russia, Uzbekistan, and Kirgizstan) are in-cluded in the network topology but no foreign generation and demand is implemented. Therefore, self-sufficiency in electricity supply is assumed.
Figure 12: Digitalized Map of the High-Voltage Transmission Network of Kazakhstan Source: Own illustration based on illustration from KEGOC (2012).
Scenarios for Kazakhstan in the Year 2030
5
Scenarios for Kazakhstan in the Year 2030
This section outlines three scenarios of the future electric system in Kazakhstan. The under-lying paradigms are highlighted and both economic and technical implications are discussed on national and regional level. The consecutive sections evaluate the interdependencies with transmission infrastructure and energy policies. In addition to the analyses for 2030 the scenarios are discussed in their role as milestones for the long-term 2050 perspective and beyond.
Overview on Scenarios 5.1
The scenarios “Conventional” (close to the “Base Case” by KEGOC), “Renewables” (with 30 % of demand supplied by solar and wind generation), and “Efficiency” (reduced demand growth) reflect on three different pathways to an electricity system for Kazakhstan in 2030. While cross-border exchange can be beneficial, all scenarios provide sufficient capacity for domestic supply of electricity.
5.1.1 KEGOC Masterplan
The starting point for the development of the three scenarios is the “Master Plan for the development of the power sector in the Republic of Kazakhstan until 2030” published by KEGOC the Kazakh network operator in November 2011 (KEGOC, 2011). The document in-cludes demand projections (see section 4.1) and suggests an increase of generation capacity from today 19.4 GW to 32 GW in 2030. The electricity system remains dominated by conven-tional generation capacity (25.6 GW) covering 87.2 % of total supply. Hydro, solar and wind generation are represented with a joint capacity of 6.6 GW and a respective 12.8 % share of the electricity supply (see Table 7).
Capacity installed
[MW] Share of Total [%]
Fossil Power Plants (ST / CC) 22,600 75.9
Fossil Power Plants (GT) 2,000 7.1
Nuclear Power Plant 1,000 4.2
Large Hydro Power Plants 2,900 6.8
Wind, Solar and Small Hydro 3,500 6.0
Table 7: Installed Generation Capacities and Shares in KEGOC Masterplan Source: KEGOC (2011).
Scenarios for Kazakhstan in the Year 2030
While the KEGOC Masterplan includes national figures and a list of projects for new and refurbished power plants, it does not provide detailed information on all individual power plants required for its 2030 projection. Thus, especially on regional level additional sources and assumptions are required.
5.1.2 Scenario Data of Generation Capacity on National Level
The Conventional scenario closely follows the generation fleet envisaged in the projections of the KEGOC Masterplan on national level. To develop a comprehensive scenario we add assumptions on the split between coal and gas-fired generation capacity according to planned projects and the regional availability of coal and gas resources. In the Conventional scenario the energy system remains dominated by coal-fired electricity generation (+4,700 MW of non-CHP capacity and +1,400 MW of CHP capacity) which covers most of the national demand increase until 2030. Gas-fired power plants continue to play a minor role in the electricity system with some installation of new gas turbine plants to address for peak demand (+1,900 MW). The investment in one nuclear power plant provides additional non-fossil base load generation (+1,000 MW). The few planned renewable capacities consists of wind power (+2,000 MW), additional hydro power plants (+1,750 MW), and minor invest-ments in PV.
In contrast to the Conventional scenario the Renewables scenario constitutes a major change in the electricity system of Kazakhstan. It assumes substantial investments in wind power (+10,000 MW) and PV (+8,000 MW) which ultimately cover 30 % of the electricity demand in 2030. Hydro power is expanded to the same level as in the Conventional scenario but no nuclear power plant is realized. To meet the future demand for district heat and in the absence of locally available gas resources coal-fired CHP capacity expansion is almost at the same level as in the Conventional scenario (+1,300 MW). In contrast, no new projects for electricity-only coal-based capacity are initiated in the Renewables scenario. Compared to 2011 levels non-CHP coal-fired power plants start to decline (-600 MW). The higher share of renewable capacity is backed-up by substantial expansions of gas turbine capacity (+4,500 MW). New CCGT plants serve the increasing demand for electricity-only capacity (+2,300 MW) and CHP capacity (+1,500 MW). At the same time they replace some of the older gas-fired steam turbine CHP plants (-600 MW).
Scenarios for Kazakhstan in the Year 2030
In both scenarios the increase in installed capacity (see Figure 13) reflects the rising electrici-ty demand in Kazakhstan (83.8 TWh/year up to 144.8 TWh/year). In the Conventional sce-nario generation capacity of about 31,000 MW is required. The capacity is adjusted to cover the annual peak demand (see Figure 7 in section 4.1) and therefore includes 1,000 MW less in conventional generation than the KEGOC Masterplan. In the Renewables scenario wind and PV are assumed to have a low capacity credit requiring additional back-up. Under con-servative assumptions the amount of conventional power plants in the Renewables scenario
almost equals the level of the Conventional scenario. At the same time CO2 emissions to
meet the anticipated demand are significantly lower in the Renewables scenario (see section 6.3.2) due to a higher share of low-emission gas-fired generation.
The third scenario highlights the high potential for an increase in energy efficiency in Ka-zakhstan. For 2030 it assumes an annual demand of 114.3 TWh compared to the 144.8 TWh/year in the Conventional and Renewables scenario which is equal to a 50% re-duction in demand increase from 2010 to 2030.
Figure 13: Installed Generation Capacities in 2011 and for the three Scenarios in 2030
Costs for Decommissioning, Refurbishment and New Investment 5.2
Based on cost assumption from Table 4 (see section 4.2.1) and assumptions on the respec-tive power plant fleet (see Figure 14) we estimate the costs associated with refurbishment and installation of new capacity for the two scenarios (see Table 8). In the Renewables
sce-Scenarios for Kazakhstan in the Year 2030
nario investment intensive coal-fired and nuclear generation capacity dedicated to serve the increasing electricity demand is substituted by cheaper gas-fired generation. Consequently, the required investments in new fossil-fueled capacity and in refurbishing the old coal-fired fleet are € 1.3 bn lower compared to the Conventional scenario. Moreover, the scenario spares the introduction of a nuclear facility in Aktau which induces additional savings of € 5.7 bn. While required investments in hydro power are the same in both scenarios, in-vestments in new wind power plants and photovoltaic facilities are significantly higher in the Renewables scenario (€ 2.5 bn compared to € 21.5 bn). In total investments for refurbish-ments and new capacity sum up to € 40.8 bn in the Renewables scenario and total invest-ment costs for the Conventional scenario are estimated as € 28.7 bn. While the Renewables
scenario results in higher investment costs the reduced fuel consumption and lower CO2
emissions significantly lower operational costs. A discussion on the timing of investment decisions for new generation capacity is included in section 7.1 and a more detailed analysis of variable costs induced in the respective scenarios is performed in section 6.3.
Figure 14: Decommissioned (OFF), Unaffected (OK), Refurbished (REF), and New Capacity (NEW) Source: Own illustration based on data from KazNIIEK (2012b), KazNIPIITES (2010), KEGOC (2011) and own assumptions.
Scenarios for Kazakhstan in the Year 2030
Table 8: Investment Costs for Generation Capacity in the Conventional and Renewables Scenario Source: Own calculations based on costs data from Schröder et. al (2012) and own assumptions.
Box 1: Excursus on Economic Considerations in Electricity System Planning
The economic rationale for a generation mix consisting of several technologies originates from their cost structure. A schematic example is presented in Figure 15. Generation technologies with high initial investment costs and low variable costs provide electricity at a lower average price per unit if the number of full load hours are sufficiently high (e.g. coal and nuclear power plants). The supply of peak load generation requires capacity generating only in several hundred hours per year. For this purpose technologies with low investment costs are more competitive despite the higher variable costs (e.g. gas tur-bines). The cost characteristics of different generation technologies and the varying level of demand results in the differentiation in base, mid, and peak load.
Combining information on available technologies with the load duration curve of the re-gion of interests, the least cost power plant fleet can be determined. With the generalized assumptions in Figure 15, the optimal technology mix is a combination of coal power plants for base load, combined cycle gas turbines for mid load, and gas turbines for peak load. This optimization is often used in electricity sector models to determine the optimal
Fuel Type Technology Conventional Scenario [m €] Renewables Scenario [m €]
Refurb New Total Refurb New Total
Nuclear ST 0 5,665 5,665 0 0 0 Coal ST CHP 1,803 2,421 4,224 1,389 1,822 3,211 Coal ST 2,421 6,589 9,011 1,557 3,770 5,327 Gas ST CHP 185 12 197 168 20 188 Gas ST 84 0 84 84 0 84 Gas CCGT CHP 0 638 638 0 1,090 1,090 Gas CCGT 0 0 0 0 1,677 1,677 Gas GT CHP 7 51 58 7 51 58 Gas GT 0 538 538 0 1,818 1,818
Subtotal of Fossil Generation 4,500 10,249 14,748 3,204 10,426 13,451
Hydro RES 825 5,009 5,834 825 5,009 5,834
Wind RES 0 2,364 2,364 0 11,820 11,820
Photovoltaic RES 0 97 97 0 9,656 9,656
Scenarios for Kazakhstan in the Year 2030
investment mix. The results are static and highly dependent on the cost and price as-sumptions. They should be related to the various uncertainties and additional constraints in the system:
• For nuclear power plants the assumption on investment costs is of key importance.
While their construction costs are often estimated in the range of 2,000 to 3,000 €/kWh, figures from the latest projects in France and Finland have skyrocketed to well above 5,000 €/kWh. In addition, the cost of decommissioning and waste man-agement has to be evaluated carefully. The uncertainty is mainly on the fixed cost;
• The choice between coal and gas has three main aspects: (i) CCGT plants are cheaper
in investment and have a higher efficiency; (ii) domestic coal and gas resources have political and economic implications; (iii) the carbon emission price is the major price risk to coal due to higher specific emissions and lower efficiency than CCGT plants;
• Policies aiming to increase renewable capacities in the market negatively affect the
economics of conventional power plants by a reduced and more volatile residual load;
• The market design (e.g. price zones, etc.) can affect the economics of power plants
in-creasing the need for regional studies of the electricity market.
Scenarios for Kazakhstan in the Year 2030
Changes in Regional Generation Capacity 5.3
5.3.1 The Conventional Scenario
Regionally disaggregated generation data builds on the figures for national generation of KEGOC Masterplan (see section 5.1.2) which do not include major changes in the coal domi-nated generation fleet in Kazakhstan. Additionally, we use data on planned cumulative gen-eration capacity by technology and region provided by KazNIPIITES (2010) to benchmark data on the residual power generation fleet and to adjust for discrepancies. With some own assumptions on the fuel type and the local distribution within one region we conclude on the capacities for every power plant on block level. The scenario data is illustrated on power plant level for new investments and refurbishments (see Figure 16) and aggregated to changes in the generation capacity for conventional technologies on regional level for 2011 and 2030 (see Table 9). The regional analysis indicates that coal-fired generation which has a high share of the planned additional capacity (68 %) is mainly to be installed in the northern and north-eastern regions (47 % of planned capacity). The remaining 21 % are added from electricity-only generation in the Almaty region which will be supplied by coal trains from the north. The additional demand in the western regions is met by 1,000 MW of nuclear generation capacity. Gas-fired capacity provides supply for peak load hours in the western regions (additional gas turbines) and some additional CHP capacity (additional CCGT capaci-ty) but does not substitute electricity-only coal-fired generation in any region.
Scenarios for Kazakhstan in the Year 2030
[MW] Nuclear Coal CHP Coal Gas ST CHP Gas ST Gas CC CHP Gas CC Gas GT CHP Gas GT Delta
AKM 698 698 AKT 30 127 323 480 ALM -78 1,980 385 2,287 ATY 650 650 KAR 258 785 1,043 KUS 1,000 -12 240 1,228 KZY 87 87 MAN 999 -630 90 459 PAV 950 950 SEV 125 125 VOS 385 385 YUZ 100 100 ZAP 250 194 444 ZHA 40 40 SUM 999 1,388 4,715 -472 0 875 0 127 1,344 8,976
Table 9: Regional Change in Conventional Capacity until 2030 in the Conventional Scenario
5.3.2 The Renewables Scenario
In contrast to the Conventional scenario, the Renewables scenario envisages a major refor-mation of the electricity system in Kazakhstan with 30 % of electricity generated from solar and wind. Despite the expected demand increase, existing coal-fired generation capacity is refurbished but no new projects are initiated. This scenario assumes a reduction of the sup-ply surplus in the coal regions in the north-east. CCGT electricity-only plants with a total capacity of 2,300 MW are built in the southern and western regions. In the coal regions CHPs remain coal-fired while in all other regions they are substituted with gas-fired CHP plants. Renewable generation is mainly located in the western and southern regions. Capacity needed to back-up their intermittent supply is provided by additional gas turbines installed in these regions. The transformation from extensive coal to more renewable and gas genera-tion results in a strong shift of generagenera-tion capacity on regional level (see Table 10). Com-pared to the Conventional scenario the major share of new investment takes place in the south and west of Kazakhstan. In the coal regions the scenario assumes the conservation of the status quo (see Figure 17).
Scenarios for Kazakhstan in the Year 2030
Figure 17: Local Investment in New Generation Capacity in the Renewables Scenario
[MW] Nuclear Coal CHP Coal Gas ST CHP Gas ST Gas CC CHP Gas CC Gas GT CHP Gas GT Delta
AKM 628 628 AKT 30 127 323 480 ALM -558 1,320 885 1,200 1,200 4,047 ATY -85 1,050 965 KAR 234 234 KUS -112 -12 360 236 KZY 300 87 387 MAN -630 400 890 660 PAV -160 -550 -710 SEV 0 VOS -26 -26 YUZ -16 120 400 504 ZAP 250 194 444 ZHA 40 800 840 SUM 0 -10 770 -537 0 1,495 2,300 127 4,544 8,689
Table 10: Regional Change in Conventional Capacity until 2030 in the Renewables Scenario
5.3.3 The Efficiency Scenario
While the Conventional and the Renewables scenario only differs in the respective genera-tion fleet aiming at the satisfying a predefined demand, the efficiency scenario assumes a less rigid growth in electricity demand due to the realization of efficiency potentials in vari-ous energy-intensive sectors. Consequently the required generation capacity is smaller
Scenarios for Kazakhstan in the Year 2030
which opens an even wider scope for a transition towards a low-emission, renewable energy based electricity system (see Table 11). The generation fleet assumed here deviates from the assumptions of the renewable scenario by enforcing an even more consequent reduction of no-CHP coal-fired generation. Compared to the renewable scenario 700 MW of coal-based generation is decommissioned instead of being refurbished in Pavlodar region. Additionally, planned projects with a volume of 1,950 MW are not realized in this area. The same is true for the Almaty region were a 1,320 MW project for coal-fired generation is not realized. The substitution for reduced availability of coal-fired generation and the balancing of an in-creased share of intermittent electricity supply is again performed with additional capacity of gas turbines is this scenario. Due to the reduced demand the dimensioning of both the renewable system and the supplement gas-fired back-up capacity has being downsized. Again aiming at achieving a 30 % share of combined wind and solar supply the scenario as-sumes 6,400 MW of photovoltaic and 8,000 MW of wind powered generation. The sites of renewable generation remain unchanged. Compared to the Renewables scenario less instal-lations for gas-fired capacity is required in the western regions (-580 MW) and in the south-ern part of the country (-900 MW) (see Figure 18).
Scenarios for Kazakhstan in the Year 2030
[MW] Nuclear Coal
CHP Coal Gas ST CHP Gas ST Gas CC CHP Gas CC Gas GT CHP Gas GT Delta
AKM 0 468 0 0 0 0 0 0 0 468 AKT 0 0 0 30 0 0 0 127 288 445 ALM 0 -558 0 0 0 885 900 0 900 2,127 ATY 0 0 0 -85 0 0 0 0 770 685 KAR 0 84.3 0 0 0 0 0 0 0 84.3 KUS 0 -112 0 -12 0 360 0 0 0 236 KZY 0 0 0 0 0 0 300 0 87 387 MAN 0 0 0 -630 0 0 300 0 690 360 PAV 0 -270 -3,200 0 0 0 0 0 0 -3,470 SEV 0 0 0 0 0 0 0 0 0 0 VOS 0 -26 0 0 0 0 0 0 0 -26 YUZ 0 -16 0 120 0 0 300 0 0 404 ZAP 0 0 0 0 0 250 0 0 194 444 ZHA 0 0 0 40 0 0 0 0 600 640 0 -430 -3,200 -537 0 1,495 1,800 127 3,529 2,784
Scenario Results
6
Scenario Results
The applied methodology provides a techno-economic assessment of the Conventional, Renewables, and Efficiency scenario. It builds on the spatial electricity data for Kazakhstan in 2030 described in section 3 and evaluates network investments and utilization of generation capacity, quantifying usage of the respective technology in electricity generation and
associ-ated CO2 emissions. The model is a mixed integer linear optimization problem developed in
the open access modeling software GAMS (General Algebraic Modeling System). The objec-tive function includes the sum of variable generation costs and annualized network invest-ment costs. The model is solved using the commercial solver CPLEX. The mathematical for-mulation is shown in Box 3.
Network Topology and Options for Investment 6.1
The network topology of the high voltage transmission grid of Kazakhstan for 2030 includes only minor updates compared to the 2010 data (Figure 19).
Figure 19: Topology for Transmission Investment Model in 2030
The model can decide endogenously on the expansion of individual transmission lines as long as they already exist in the topology. Therefore the network for 2030 includes the new 220 kV lines in the eastern part of the country proposed in the KEGOC “Masterplan”. The
Scenario Results
separated networks of western and eastern Kazakhstan can by connected by optional in-vestments in HVDC connectors.
In the model the possibility of endogenous line expansion increases the system costs. For expansions of 500 kV lines with one additional circuit we assume 4 m € for transformer sta-tions and 1.4 m €/km of transmission line. In the 220 kV network the cost of additional cir-cuits is calculated for every line with half the cost factors as for 500 kV. HVDC lines can be built in 1,000 MW steps and impose 130 m € in cost for the transformer station and 0.8 M €/km of transmission line. The costs are annualized assuming a lifetime of 40 years and an interest rate of 10 %.
Model Description 6.2
The model includes two decision levels; (i) the investment decision in transmission infra-structure and (ii) the decision on the generation. The two stages are reduced to one objec-tive function assuming perfect competition between the generation companies and optimal infrastructure planning by the TSO. Given the generation mix of the respective scenario, the objective of the model is to compute the cost minimizing dispatch of generation capacity
that satisfies demand. The costs consist of variable expenditures for operation (fuel and CO2
emission costs) and capital cost for investments in transmission infrastructure.
The market dispatch balances varying nodal demand and available generation capacity. Generation is constraint by the availability of conventional generation capacity and varying levels of renewable generation output for each hour. Network restrictions include the transmission capacity of each link and we apply the DC load flow (DCLF) approach (Schweppe et al., 1988) for the meshed AC network. The DCLF constraint is a simplified model approach to enforce physical flows according to line characteristics in meshed elec-tricity networks.
The main driver of infrastructure investments is the regional level of demand in relation to the spatial availability and cost of generation. In case of network congestion, it is not possi-ble to operate the electricity system with the least cost generation capacities. Additional infrastructure could relieve this congestion as it provides exchange capacity and alters the flow pattern in the AC network. The options for expansions include the investment in addi-tional circuits for the existing topology of the 220 kV and the 500 kV voltage level.
Further-Scenario Results
more, we include three investment options on HVDC lines connecting the two separated networks in the west and east of Kazakhstan. An overall reduction in system costs is achieved, if costs savings from congestion relieve are higher than expenditures for new transmission infrastructure. All results are scaled to and reported on annual basis.
Box 3: Excursus on the Mathematical Formulation of Model Equations
Objective function: Minimization of electricity system cost
Min𝑐𝑜𝑠𝑡𝑔𝑝,𝑑,𝑡,∆𝑛,𝑑,𝑡,𝑒𝑥𝑝𝐴𝐶𝑙,𝑒𝑥𝑝𝐷𝐶𝑑𝑐 = ∑𝑝,𝑑,𝑡�𝑊𝑒𝑖𝑔ℎ𝑡(𝑑)∗ 𝑀𝐶𝑝∗ 𝑔𝑝,𝑑,𝑡�
+∑𝑙(𝑒𝑥𝑝𝐴𝐶𝑙∗ 𝐶𝑜𝑠𝑡𝐸𝑋𝑃𝑙)
+∑𝑑𝑐(𝑒𝑥𝑝𝐷𝐶𝑑𝑐∗ 𝐶𝑜𝑠𝑡𝐷𝐶𝑑𝑐)
Energy balance: Generation minus demand and network in-/outflows have to be zero at each node according to Kirchhoff’s current law
∑ 𝑔𝑝 𝑝,𝑑,𝑡− 𝑄𝑛,𝑑,𝑡+∑ �∆𝑛𝑛 𝑛𝑛,𝑑,𝑡∗ 𝐵𝑛,𝑛𝑛�+𝑑𝑐𝐼𝑛𝑝𝑢𝑡𝑑𝑐 = 0 ∀𝑛,𝑡
Generation constraints: Generation constraint for each block of conventional and renewa-ble power stations (see Appendix)
gp,d,t≤ Gmaxp,d,t ∀ p, d, t
AC line flow constraint: Power flow limit for every AC transmission line determined by voltage level and number of circuits. Additional capacity from upgrades and expansions.
�𝑙𝑓𝐴𝐶𝑙,𝑑,𝑡�= �∑ �∆𝑛 𝑛,𝑑,𝑡∗ 𝐻𝑙,𝑛�� ≤ 𝑃𝑜𝑤𝑒𝑟𝑓𝑙𝑜𝑤𝑙𝑖𝑚𝑖𝑡𝑙
+ 𝑒𝑥𝑝𝐴𝐶𝑙∗ 𝐶𝑎𝑝𝑎𝑐𝑖𝑡𝑦𝐸𝑥𝑝𝑙 ∀ 𝑙,𝑑,𝑡
DCLF constraint: Voltage angle for one slack node of every AC network equals zero
𝑆𝑙𝑎𝑐𝑘𝑛 ∗ ∆𝑛,𝑑,𝑡= 0 ∀ 𝑛,𝑑,𝑡
DC line flow constraint: Power flow limit link determined by investments in respective new DC connector
Scenario Results
Results of the Network Expansion Model 6.3
The results are discussed for the scenarios and include a sensitivity analysis of the emission
prices with 20 €/t CO2 and 40 €/t CO2. We provide quantitative results on system costs, on
the annual output for each generation technology, on annual CO2 emissions, and insights in
usage and investments in transmission infrastructure.
6.3.1 Electricity System Costs
All scenarios address the age structure of today’s generation park and the projections of rising demand with refurbishments of existing and investments in new power plants. The resulting system costs which include investments in generation and transmission and opera-tional cost are discussed from the 2030 perspective.
Table 12 depicts the scenario specific investment costs. Investment costs are determined exogenously for generation by the scenario specifications and endogenously for the trans-mission costs by the investments decisions in the infrastructure model. The Conventional Scenario has the highest investments in conventional generation capacity (16.7 bn €). Due to 5 bn € for new hydro power and only 2.5 bn € for wind power the overall costs for genera-tion capacity is moderate compared to the Renewables scenario and almost in range of the Efficiency scenario. The Renewables scenario has the highest capital requirements though the major share of almost 30 bn € is directed towards renewable generation. The network investments include 0.5 bn € for one west-east HVDC connector in all scenarios. The exten-sions in the AC network are only punctual in the Conventional and in the Efficiency scenario.
In the Renewables scenario some more line extensions are built (1.3 bn €). The higher CO2
emission price influences only the Renewables scenario (+0.5 bn €). The cost figures do not include required refurbishments in the high voltage transmission network until 2030.
[bn €] “Conventional” “Renewables” "Efficiency”
CO2 Price 20 €/t 40 €/t 20 €/t 40 €/t 20 €/t 40 €/t New Conventional 16.69 10.74 5.74 New Renewables 7.61 29.45 17.23 Refurbishment 5.59 4.22 3.32 Transmission 0.71 0.60 1.83 2.30 0.81 0.89 Sum 30.60 30.49 46.24 46.71 27.10 27.18
Scenario Results
The scenario specific investments in generation and transmission infrastructure provide the market setting for the cost minimal generation dispatch. Table 13 states the variable system
costs for fuel and CO2 emissions for the two analyzed CO2 prices. The Renewables and the
Efficiency scenario save about 0.4 bn € per year in fuel costs at 20 €/t CO2 and about 0.2 bn €
per year at 40 €/t CO2 compared to the Conventional scenario. Thereby, with the higher CO2
emission price the Renewables and Efficiency scenario include significantly higher expenses for gas and lower ones for coal. The fuel costs of the Conventional scenario are more robust
with increasing CO2 emission prices indicating missing alternatives in the generation park.
The expenses for CO2 emissions are about 1.5 bn € higher.
[bn €/year] Conventional Scenario Renewables Scenario Efficiency Scenario
CO2 price 20 €/t 40 €/t 20 €/t 40 €/t 20 €/t 40 €/t
Fuel Costs Coal 1.55 1.49 1.06 0.78 0.94 0.71
Fuel Costs Gas 0.39 0.51 0.55 1.13 0.65 1.09
Fuel Costs Nuclear 0.07 0.07 - - - -
Sum Fuel Costs 2.01 2.07 1.61 1.91 1.59 1.80
CO2 Emission Costs 1.94 3.78 1.39 2.31 1.26 2.15
Table 13: Annual Variable Costs of the Scenarios in the Electricity System 2030
6.3.2 Results on Annual Generation in the year 2030
Table 14, Table 15, and Table 16 provide scenario results for generation, CO2 emissions and
the full load hours for each technology at 20 €/t CO2 :
• In the Conventional scenario, RES only supply 20.5 TWh (14%) of the 144.8 TWh of
annual demand. Except for the gas-fired CHP generation (9.1 TWh) the remaining generation is coal-based (107.5 TWh);
• In the Renewables scenario, RES generate 57.6 TWh (40%), gas-fired generation
ac-counts for 14.5 TWh and coal-fired power plants for 72.8 TWh. Full load hours of coal-fired generation are significantly reduced due to the high share of fluctuating renewable generation. As total available coal-fired capacity is lower in this scenario more generation from CCGT plants is included into the dispatch;
• In the Efficiency scenario 36.1 TWh are supplied from RES which corresponds to a
32% share of total generation given lower demand predictions (114.3 TWh). The re-mainders are 60.7 TWh from coal and 17.5 TWh from gas-fired generation.