University of Colorado, Boulder
CU Scholar
Chemistry & Biochemistry Graduate Theses &
Dissertations Chemistry & Biochemistry
Spring 1-1-2011
Computational Methods for Improved Peptide and
Protein Identification in Proteomics
Karen Meyer-Arendt
University of Colorado at Boulder, [email protected]
Follow this and additional works at:http://scholar.colorado.edu/chem_gradetds
Part of theBioinformatics Commons
This Dissertation is brought to you for free and open access by Chemistry & Biochemistry at CU Scholar. It has been accepted for inclusion in Chemistry & Biochemistry Graduate Theses & Dissertations by an authorized administrator of CU Scholar. For more information, please contact
[email protected]. Recommended Citation
Meyer-Arendt, Karen, "Computational Methods for Improved Peptide and Protein Identification in Proteomics" (2011).Chemistry & Biochemistry Graduate Theses & Dissertations.Paper 33.
COMPUTATIONAL METHODS FOR IMPROVED PEPTIDE AND PROTEIN IDENTIFICATION IN PROTEOMICS
by
KAREN MEYER-ARENDT B.A., Reed College, 1981 M.S., Oregon State University, 1987
A thesis submitted to the Faculty of the Graduate School of the University of Colorado in partial fulfillment
of the requirement for the degree of Doctor of Philosophy
Department of Chemistry and Biochemistry 2011
This thesis entitled:
Computational Methods for Improved Peptide and Protein Identification in Proteomics written by Karen Meyer-Arendt
has been approved for the Department of Chemistry and Biochemistry
________________________________ Natalie G. Ahn
________________________________ William M. Old
Date____________
The final copy of this thesis has been examined by the signatories, and we find that both the content and the form meet acceptable presentation standards of scholarly work in
ABSTRACT
Meyer-Arendt, Karen (Ph.D., Biochemistry)
Computational Methods for Improved Peptide and Protein Identification in Proteomics Thesis directed by Professor Natalie G. Ahn
Shotgun proteomics is an analytical method used to identify proteins from complex mixtures such as a whole-cell lysates. This method utilizes high-resolution mass spectrometers, proteolysis, and fractionation techniques in order to maximize the number and quantities of proteins being detected. Knowing the identity and abundance of proteins in a cell provides insights into cell functioning, and how cells respond to external stimuli. Our lab uses proteomics to further understanding of signaling networks and how these are dysregulated during melanoma progression.
Computer algorithms are an essential aspect of shotgun proteomics in order to match hundreds of thousands of spectra to the peptide sequences from which they came. The most productive peptide identification methods search databases of protein sequences, looking for the best peptide spectrum matches, but these methods can be plagued by false positives and false negatives. I designed and implemented MSPlus, software which increases sensitivity and specificity in peptide identification by using physicochemical filters and consensus scoring between multiple database search programs, approaches which are now commonly in use.
After peptides are identified, they must be mapped back to the proteins from which they derive, a non-trivial task in the human proteome with its extensive alternative splicing, gene
iii
duplication, and post-translational processing. I designed and implemented IsoformResolver, software which accurately and efficiently infers proteins from peptides using a pre-calculated peptide-centric reformatted protein database. Proteins are reported in the context of protein groups, a concise representation which allows experimentalists to see the most likely proteins in the context of all possible proteins for which there is mass spectrometry evidence. This novel representation minimizes the protein volatility inherent to the more common protein-centric output.
Finally I examine the capabilities and limits of shotgun proteomics. I introduce a tier-based representation of protein abundances, and investigate how the abundances vary by protein class and at different sampling depths. I compare proteomics and transcriptomics results, and investigate to what extent proteomics can be used to identify members which distinguish cell states.
ACKNOWLEDGMENTS
Thanks go, above all, to Natalie Ahn and Katheryn Resing for hiring me years ago, encouraging me to go to graduate school, and teaching me so much about mass spectrometry, scientific rigor, and thinking big. Thank you also to my committee members Rob Knight, Will Old, Xuedong Liu, and Robin Dowell, all of whom who gave me valuable feedback on my research over the years. I am thankful to my co-members on the ABRF iPRG Study Group for many valuable discussions. Thanks also go out to my past and present colleagues at the Mass Spectrometry Lab, especially Chia-Yu Yen, Stephane Houel, Alex Mendoza, Lauren Aveline-Wolf, and Karen Jonscher, who were always helpful and fun to work with. I also want to
mention how pleased I was with the CU Biochemistry Department, and especially the Molecular Biophysics Training Program, for teaching me more about Biochemistry than I could have imagined.
There are many other people that I am indebted to, so I would also like to thank my parents, who set the example of finding a profession they loved, even if it took a circuitous route to get there; my friends, for encouraging me and always helping me out when needed; and my kids, Ada and Thomas, for their understanding when I was traveling or busy. Most of all, I thank my husband, George, who was immensely supportive of my studies and research these past years.
v
CONTENTS CHAPTER I. INTRODUCTION Overview of Proteomics ...1 Peptide Identification ...4 Protein Inference ...9
II. IMPROVING REPRODUCIBILITY AND SENSITIVITY IN IDENTIFYING HUMAN PROTEINS BY SHOTGUN PROTEOMICS Introduction ...15
Methods...17
Results and Discussion ...24
Conclusion ...48
III. ISOFORM RESOLVER: A PEPTIDE-CENTRIC ALGORITHM FOR PROTEIN INFERENCE Introduction ...51
Methods...56
Results ...64
Conclusions ...105
IV. CONCLUSIONS AND FUTURE DIRECTIONS Discussion ...108
REFERENCES ...130
APPENDIX A. MANUAL ANALYSIS OF EXAMPLES IN TABLE 2.2 ILLUSTRATING “DISTRACTION” ...135
B. DISTRIBUTION OF MS/MS SPECTRAL ION INTENSITIES IN THE DISTRACTED GROUP VS. THE MSPLUS-VALIDATED GROUP ...144
TABLES
TABLE
2.1 Samples of soluble protein extracts from human K562 erythroleukemia cells ...18 2.2 Examples illustrating "distraction" by Sequest and Mascot, in which correct
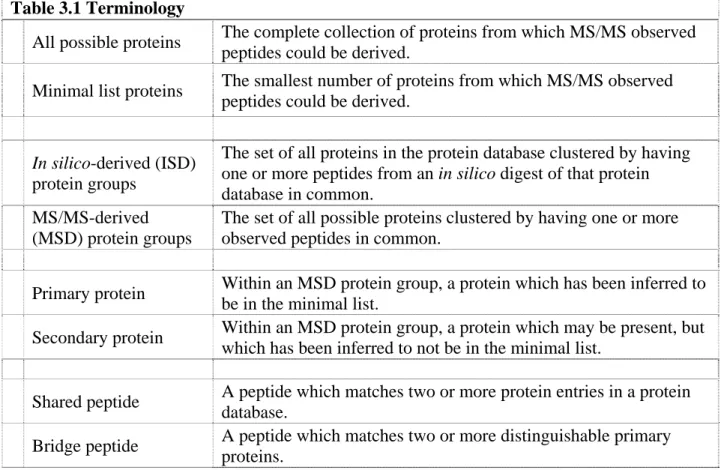
sequence assignments are replaced by incorrect assignments as the database size increases ...37 2.3 Isoform Resolver specifies protein variants from observed peptide sequences ....45 3.1 Terminology ...53 3.2 Datasets used in these studies ...57 3.3 Protein inference reduces protein repeatability between replicates ...78 3.4 Protein inference methods underestimate overlap between proteins obtained
from datasets with lower vs. higher depth of sampling ...83 3.5 Comparison of protein inference programs ...98 3.6 Examples of ISD groups found in common by six protein inference programs ..102 4.1 Protein locations vary by tier between low- and high-depth sampling ...114 4.2 Predicted numbers of proteins using capture-recapture calculations ...115
vii
FIGURES
FIGURE
1.1 Diagram of a mass spectrometer ...2
1.2 Peptide fragmentation ...3
1.3 Shotgun proteomics protocol ...4
1.4 Distribution of peptide identification scores ...6
1.5 MSPlus filters remove false positive assignments ...8
1.6 Distinct vs. shared peptides ...10
1.7 Protein-centric vs. peptide-centric strategy ...12
1.8 Protein volatility...13
2.1 Randomly determined peptide scores ...25
2.2 Combining Sequest and Mascot results to validate more DTA files ...30
2.3 Using SCX chromatography as an MSPlus filtering criterion ...33
2.4 Distraction increases with database size ...41
3.1 IsoformResolver uses a peptide-centric strategy for protein inference ...55
3.2 IsoformResolver workflow ...59
3.3 IsoformResolver input file format ...60
3.4 IsoformResolver constructs two kinds of protein groups based on in silico derived and on observed peptides ...65
3.5 IsoformResolver output ...67
3.6 IsoformResolver protein profile output ...68
3.7 Methods of assigning bridge peptides used by different protein inference programs ...73
3.8 Challenges to protein inference include volatility in choosing primary proteins ...76
FIGURE
3.10 Protein inference is affected by joining multiple datasets in different ways ...85
3.11 Compare profiles use aspects of pooled and aggregate analysis ...87
3.12 Apportionment of bridge peptides for spectral counting ...91
3.13 ISD protein groups define functionally related proteins ...95
3.14 Protein inference differences are mainly due to whether programs report primary or representative represent ...100
4.1 Protein overlap from experiments with varying degrees of fractionation ...111
4.2 Distributions of normalized spectral counts from experiments with varying degrees of fractionation ...113
4.3 Protein abundance tiers comparing low and high depth sampling ...114
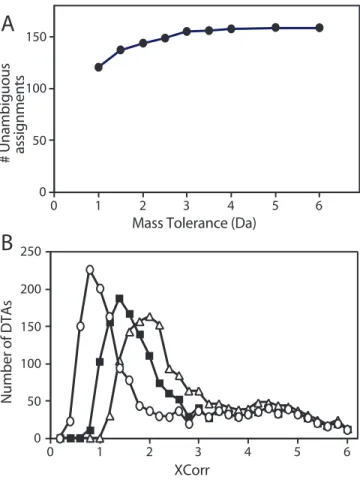
4.4 The number of proteins reported from depth of sampling experiments is asymptotic ...116
4.5 Distributions of normalized spectral counts for proteins mapped to three GO function categories ...117
4.6 Distributions of mRNA and protein data sets with genes in common ...121
4.7 Correlation between mRNA and protein intensities ...122
4.8 Intensity distribution of highest ranked differentially regulated genes ...123
4.9 Comparison of rankings from microarray analysis considering all vs. only the most intense genes ...124
4.10 ROC curve showing the predictive power of a 76-probeset signature ...126
4.11 Sensitivity, specificity and AUC trends truncating by probesets with lowest intensity ...127
ix
CHAPTER I
INTRODUCTION
Overview of Proteomics
Since the completed sequencing of the human genome (Lander et al, 2001; Venter et al
2001), a great deal of effort has been taken to make sense of the function of each of the approximately 20,000 genes (Clamp et al, 2007). One rich source of information comes from transcriptomics, a high-throughput method which attempts to enumerate and quantify all mRNA transcripts from a cell lysate using microarray analysis. This method has been used successfully in numerous studies, and has led to the identification of biomarkers used in diagnosis
(Bhattacharjee et al, 2001; van't Veer et al, 2002). But the majority of cellular activity is at the protein rather than the mRNA level, so proteomics analysis – a high-throughput, discovery-based method which looks at the identity and abundances of protein in a cell – may be even more promising. Looking at proteins directly will shed light on protein abundances (which do not always correlate with mRNA abundances), provide information about splice variants, truncation products, and cellular localization that microarray chips may not assay and, perhaps most importantly, provide information about post-translational protein modifications essential to the signaling networks which drive much of cell function.
There are many approaches one can take in proteomics (Aebersold and Mann, 2003; Zhu
et al, 2001), but by far the most successful has been shotgun proteomics. Also known as multidimensional protein identification technology (MudPIT), shotgun proteomics is a large-scale method which uses multiple types of chromatographic fractionation and proteolysis to analyze protein mixtures as complex as an entire cell lysate (Washburn et al, 2001; Kislinger et al, 2006). In our lab we have identified over 10,000 proteins from human cell lines, a number which approaches the total number of proteins expected from most human cell types.
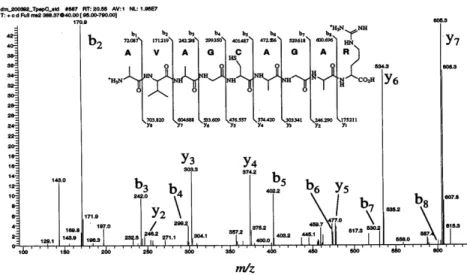
The heart of shotgun proteomics are mass spectrometers which use different types of ion sources including matrix-assisted laser desorption ionization (MALDI) and electrospray ionization (ESI) (Yates, 1998). In ESI, biological sample enters the mass spectrometer in liquid form through a nebulizer needle (Figure 1.1). Incoming peptides are ionized (usually by adding protons in positive mode or removing protons in negative mode), enabling them to be
manipulated by radiofrequency fields to be separated by molecular weight to charge (m/z) ratio, and their intensities recorded by a detector. Peptide ions are then selected for fragmentation and the intensities and m/z of the resultant charged fragment ions recorded in an MS/MS spectrum. Because peptides typically fragment along the peptide backbone, it is possible to read off the amino acid sequences of the peptides as shown in Figure 1.2.
Figure 1.1 Diagram of a mass spectrometer
(http://masspec.scripps.edu/information/intro/index.html)
2
Figure 1.2 Peptide fragmentation
(http://www.protein.sdu.dk/bm131/download/tandemMS.doc)
Good separation is key to large-scale proteomics experiments, since often only the most intense peptide ions are selected for fragmentation. Chromatographic separation can occur at the protein and peptide level. Protein separations often involve reverse phase, size exclusion or ion exchange chromatography. While some labs analyze intact proteins, analysis of peptides is more efficient because of their smaller size, thus proteins are often proteolyzed after separation, using trypsin or other proteases. Once proteolyzed, peptides are further resolved, for instance, by one-dimensional reverse phase (RP) HPLC directly coupled to the ESI, or by two-one-dimensional strong cation exchange (SCX) separation followed by RP-HPLC. A final optional “gas phase
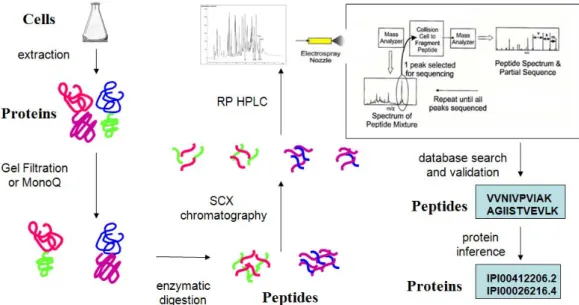
fractionation” can be carried out by repetitive runs of the same sample, each scanning a narrow mass range. Thus, multiple levels of fractionation ensure that a complex sample is simplified well enough to capture even low abundance proteins. However, another consequence of fractionation is that it produces many spectra, sometimes upward of one million or more, requiring automated computational methods for analysis. A diagram of the overall protocol is shown in Figure 1.3.
Figure 1.3 Shotgun proteomics protocol. This figure shows an example proteomics protocol from cells to a list of proteins inferred to be in the cells. Proteins are
optionally fractionated, then proteolyzed. Peptides are fractionated in one or two dimensions, including HPLC which elutes directly into the mass spectrometer. Peptide ions are isolated by mass and charge and fragmented, and their fragmentation patterns output to a computer. Software programs then identify peptides and infer proteins.
Peptide Identification
Matching large numbers of spectra to peptide sequences in an automated manner requires having a database of all possible peptide sequences available for lookup. The first protein databases that were made freely accessible were the Protein Identification Resource (PIR), established in 1984 (Sidman et al, 1988), and Swiss-Prot, established in 1986 (Bairoch and Boeckmann, 1991). In 1993, an algorithm was described which compared amino acid sequences from a protein database to the fragmentation patterns from MS/MS (Mann et al, 1993), and the field of automated peptide identification began. The principle behind the use of protein
databases is that the protein sequences can be cleaved in silico at the peptide bond, allowing for missed cleavages, and that the computed mass of the in silico peptides will match that of the biological peptides. From the peptide sequences it is, furthermore, possible to predict where the
4
peptides will be charged, fragmented, and post-translationally modified, which helps match possible peptides to the information on observed peptides contained in the spectra.
Two peptide identification programs which were implemented in the 1990s are still the most commonly used today. Sequest was the first to create a predicted pattern of MS/MS spectra for a given peptide, and compared this simplified spectra to observed MS/MS using a cross-correlation algorithm (Eng et al, 1994). In addition to the cross-correlation score (XCorr), Sequest also reported other useful scores, including rank of score per peptide (RSP), and the percent of ions matched. A second program, called Mascot, evaluates the probability that a particular peptide sequence could have produced fragment ion m/z values observed in an MS/MS spectra, based on all fragment ions predicted from all peptides in the database (Perkins et al, 1999). Other approaches to peptide identification have been reported and new methods continue to be developed (many are described in Sadygov et al, 2004), but Sequest and Mascot are still the most popular.
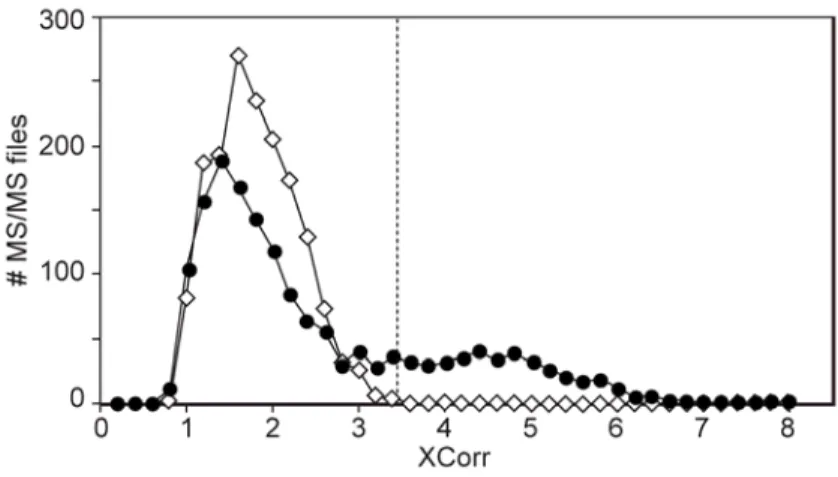
It has become commonplace for peptide identification software to report a single score as a measure of the quality of the peptide spectrum match. A single score is intuitively a good idea because it simplifies the analysis, but since the scores from all MS/MS typically lie along a continuum, this requires drawing a threshold to separate identifications which are believed to be correct from those believed to be incorrect. The most common way to determine this threshold is to repeat the search of the MS/MS against a database of peptide sequences which are derived from randomized or inverted protein sequences, and where all peptide sequences are incorrect (Moore et al, 2002), the presumption being that a peptide identified with a score higher than the highest randomly found match will be correct. However, as shown in Figure 1.4 (with closed symbols), the distribution of scores is almost always bimodal, regardless of the peptide
identification software used, make it difficult to draw a single threshold. When the threshold is set too high, many correct identifications will be rejected (false negatives), while when setting the threshold too low, many incorrect identifications would be accepted (false positives).
Figure 1.4 Distribution of peptide identification scores. Sequest cross-correlation scores for MS/MS spectra are shown as produced when searched against a protein database (closed symbols) or against a
sequence-inverted protein database (open symbols).
PeptideProphet is a program developed for peptide validation which dealt with this bimodal distribution by using curve fitting software to identify the two peaks and converting each score into a probability by dividing the number of spectra under the positive peak by the total number of spectra at that score (Keller, 2002). While this method worked well for large datasets and highly discriminant scoring methods, it could be imprecise when the peak representing the positive class was not well modeled (i.e., it extends further under the class negative peak than expected).
Our lab dealt with the bimodal distribution using an alternative strategy, by filtering out peptide identifications that were clearly bad. To do this, I implemented MSPlus, software which allowed users to specify a number of physical and chemical characteristics in order to assess the quality of each MS/MS spectrum, the peptide sequence, and the match between them. Spectral
6
quality was assessed by computing the standard deviation of intensities of the spectral peaks, where spectra containing few product ions and high noise showed low standard deviations and were rejected. Peptide sequences were also rejected when they consisted of few amino acid residues or were less than 8 amino acids in length, because very small peptides were more frequently misidentified. A close look at peptides identified from numerous experiments led to the development of a missed cleavage filter (Yen et al, 2006), to remove peptides with
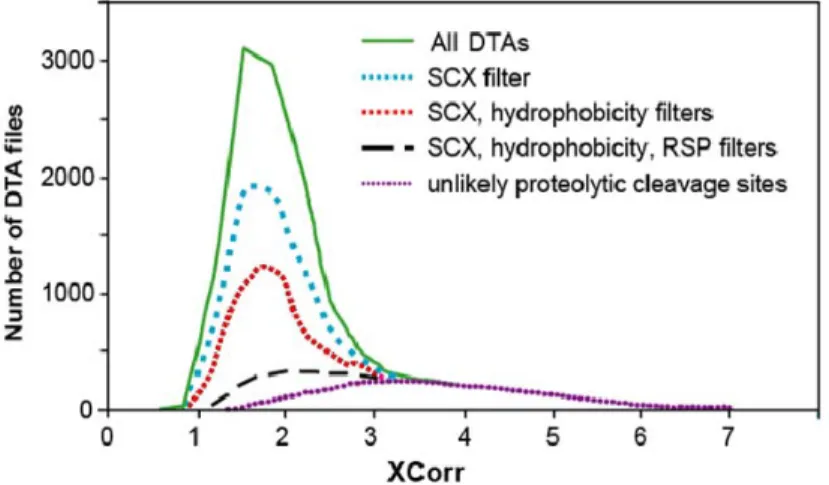
improbable missed cleavages; this became integrated into MSPlus. Finally, we assessed matches based on the physicochemical properties of peptides. For instance, we required that peptide sequences contained the types and numbers of amino acid residues that would be consistent with the observed charge state reported for each ion. We required a high percentage of observed fragment peaks in each spectrum to be accounted for by the expected fragmentation products of a matched peptide. We also used information about the chromatographic separations to inform the peptide assignment. If, for instance, a sample had been fractionated by SCX, then peptides were required to have a number of basic residues consistent with its elution in a particular region of the salt gradient. Other filters evaluated hydrophobicity (eliminating those with amino acid composition inconsistent with the reverse phase elution), and protein mass in samples separated by size exclusion chromatography. As shown in Figure 1.5, application of these filters decreased the number of false identifications.
Figure 1.5 MSPlus filters remove false positive assignments. Distribution of Sequest cross correlation (XCorr) scores for all identified MS/MS from a proteomics experiment. The top curve shows scores as they were produced by Sequest. All curves underneath show that as filters are applied, low scoring peptide spectrum matches are filtered out.
In addition to removing poor peptide spectrum matches, MSPlus also aimed to recover false negative peptide identifications, which were correct but had scores below threshold and were initially rejected. Because different peptide identification programs used complementary methods, we found that the likelihood that a peptide match was correct increased when they were identified by more than one program, even when the scores were low. When there was no consensus
between programs, we required high thresholds, but when consensus was reached, we accepted lower scores, which were established and validated using extensive manual analysis. Using consensus between programs as a criterion for peptide identification was well received in the field (Kapp et al, 2005), and led to development of a commercial product (Searle et al, 2008).
Perhaps the most promising improvement in peptide identification comes from the
introduction of more accurate theoretical spectra. Using a kinetic model for peptide fragmentation, it is possible to model the chemistry of collision induced dissociation in the gas phase, and from this construct theoretical spectra which predict fragment ion intensities as well as m/z (Zhang,
8
2004; Zhang 2005). These theoretical spectra are vastly more informative than the simplified models used by Sequest which consider fewer fragment ions, and they allow for improved
discrimination when compared to observed spectra. Our lab used these more advanced theoretical spectra to score MS/MS matches, and used these scores within MSPlus to further validate Sequest and Mascot identifications (Sun et al, 2007). Since then we have developed peptide identification software independent from Sequest and Mascot (Yen et al, 2011).
Peptide identification is discussed in greater detail in Chapter 2, a published paper, in which my work on MSPlus is described.
Protein Inference
In the analysis of proteomics experiments, it is not enough to have confidently identified peptides, because matching peptides to proteins introduces ambiguities when a peptide sequence is found in more than one protein. Different types of situations are shown in Figure 1.6, which uses real examples from a proteomics analysis of a human melanoma cell line. Peptides LDL... and MNC... are proteolytic products derived from a single protein in the protein database (“Protein 1”), and there is no ambiguity that Protein 1 is present in the sample based on the peptide evidence (Figure 1.6a). However, peptide IQD... can be proteolytically derived from two proteins, Protein 2 and Protein 3, therefore it is unclear from the peptide evidence whether only one protein or both proteins are present in the sample (Figure 1.6b). Because peptide FTN... is only derivable from Protein 2, the simplest explanation is that only Protein 2 is present, because it accounts for both peptides IQD... and FTN.... However, it would be prudent to retain the information that Protein 3 may also be present, should a different dataset contain a peptide which uniquely specifies Protein 3. The ambiguity of deciding which of many proteins should be
reported from a proteomics experiment is called the “protein inference problem” (Nesvizhskii and Aebersold, 2005).
Figure 1.6 Distinct vs. shared peptides. a. Peptides LDL... and MNC... are
proteolytic products of a single protein in the database. b. Peptide FTN... can only have come from one protein, but peptide IQD... could have derived from two proteins, and it is not clear which protein to report in the proteomics output.
Shared peptides are very common in mammalian proteomes, accounting for nearly two-thirds of validated peptides. They exist because of splice variants, gene duplication events, and post-translational events such as proteolytic truncations. They may also exist because of protein database errors, such as protein redundancy and sequencing errors. How many shared peptides are possible depends on the allowable minimum peptide length. The percent of shared peptides in the IPI protein database remains constant at about 50% when the allowable length is 8 amino acids or higher. However, as peptides shorter than 8 amino acids are allowed, the percentage of shared peptides rapidly rises, up to 80% for peptides of length 4 amino acids.
Initially, peptide identification programs just assigned proteins as an afterthought. As result, proteins selected from among multiple possibilities were reported inconsistently, leading to an over-reporting of proteins. As the problem was recognized, it became clear that by
considering all of the identified peptides at the same time, it would be possible to come up with a minimum set of most likely proteins. This led to the implementation of several protein inference
10
programs, some of which reported the proteins which accounted for the greatest number of peptides, such as DTASelect (Tabb et al, 2002) and DBParser (Yang et al, 2004), while others used probability based models such as ProteinProphet (Nesvizhskii et al, 2003) and IDPicker (Zhang et al, 2007). These programs, and several others, reported what they deemed to be the most likely proteins to be present in a proteomics sample (“primary proteins”), in contrast to less likely proteins (“secondary proteins”) which were sometimes not even reported.
We identified two major shortcomings in protein inference programs: peptide
redundancy and protein volatility, both of which arise from the protein-centric manner used by these programs. A protein-centric strategy maps validated peptides against a protein database, and presents its output in terms of proteins identified (Figure 1.7a). In the case where peptides are shared between two or more primary proteins, e.g., peptide_b and peptide_c, these peptides are redundantly copied to each protein from which they can derive. We found this replication misleading in that it seemed to show more support for each protein than actually existed, proteins which were, furthermore, often found at vastly different locations within the protein profile output. We realized that by grouping proteins together that had peptides in common, we were able to avoid redundant replication of peptides, and furthermore found that the proteins that were grouped in this way were nearly always related to each other. We called this alternative
presentation a “peptide-centric” strategy (Figure 1.7b).
Figure 1.7 Protein-centric vs. peptide-centric strategy. a. In a conventional protein-centric approach, observed peptides are searched within a protein
sequence database. Protein-centric protein groups replicate peptides when those peptides are found in more than one protein. b. In the peptide-centric approach, a database consisting of non-redundant peptide sequences is generated from a protein sequence database, where each peptide is matched to all proteins containing the peptide sequence. Observed peptides are matched one-to-one against the list of non-redundant peptide sequences in the database. This allows easy clustering of protein groups which share peptides in common.
Our second frustration with existing protein inference programs came from protein volatility, the idea that inferred proteins are anything but stable. Proteins are inferred by a set of peptides, and as the peptides vary, so do the proteins. Because of the stochastic nature of data collection by mass spectrometers, it is common to find that identified peptides are not completely overlapping between technical replicates of the same sample. Using datasets of technical
replicates, we were able to see how small differences between identified peptides were
12
exacerbated into larger differences between proteins identified in the replicate runs, as shown in Figure 1.8.
Figure 1.8 Protein volatility. Technical replicate runs resulted in overlapping, but slightly different sets of peptides. This, in turn, led to differences in proteins inferred for each replicate run.
Our solution to the problem of protein volatility was to construct protein groups using all peptides derived from an in silico digest of a protein database, not only from the peptides which were detected from MS/MS. We found that the MS/MS derived (MSD) protein groups were a strict subset of the in silico derived (ISD) protein groups, making it easy to map from unstable proteins (and MSD protein groups) to highly stable ISD protein groups. By doing so, we were able to obtain a more reliable method by which to compare proteomics results between
experiments.
My Ph.D. research addressed and solved current problems in shotgun proteomics, in order to facilitate automated analysis of large scale LC-MS/MS datasets. In Chapter 2 of this thesis, I will present the development of MSPlus, a computational algorithm to help solve the problem of evaluating the correctness of peptide sequence assignments based on peptide physicochemical properties, and the results of testing and validating the algorithm. This work was published in 2004 in Analytical Chemistry. In Chapter 3, I will describe IsoformResolver, a
computational algorithm to solve the protein inference problem using a novel peptide-centric database strategy, the results of my experiments evaluating main contributors to protein volatility, and metrics for IsoformResolver’s performance compared to other protein inference programs. A manuscript on this study is under review after revision in the Journal of Proteome Research. Finally, in Chapter 4, I will end the thesis with a summary of my thesis work and show how IsoformResolver can be used to answer important questions that remain for future investigations – are our proteomic methods going deep enough to provide a global view into the proteome, what are relative protein abundances in cells with regard to protein classes, are we close to identifying biomarkers – asking, in other words, what we can conclude about the results from large-scale proteomics experiments.
14
CHAPTER II
IMPROVING REPRODUCIBILITY AND SENSITIVITY IN IDENTIFYING HUMAN PROTEINS BY SHOTGUN PROTEOMICS
Published 2004 in Anal. Chem. 76, 3556-68. Resing, K.A., Meyer-Arendt, K., Mendoza, A.M., Aveline-Wolf, L.D., Jonscher, K.R., Pierce, K.G., Old, W.M., Cheung, H.T., Russell, S., Wattawa, J.L., Goehle, G.R., Knight, R.D., and Ahn, N.G.
INTRODUCTION
Profiling expressed proteins in a cell type (the proteome) is now possible through the convergence of genome sequencing, automated data acquisition by mass spectrometry (MS), and database search programs. One approach, called shotgun proteomics, involves proteolysis of the proteins in a sample, then sequencing peptides by MS fragmentation (MS/MS) (McCormack
et al, 1997). Charge competition between peptides during ionization and limitations in MS
sensitivity, dynamic range, and data collection rate require prior peptide fractionation. A major advance was the introduction of a multidimensional chromatography approach, where peptides are separated first by strong cation exchange (SCX) chromatography, then by reversed phase chromatography (Link
et al, 1999), coupling the reverse phase column to a mass spectrometer
(LC/MS), so that thousands of sequencing spectra can be collected in a few hours. To identify peptides, each MS/MS spectrum is compared against theoretical spectra of candidate peptide
sequences represented in a protein database, and a score is assigned to rank the most likely peptide assignments (Eng et al, 1994). However, current scoring methods are poor at
distinguishing correct from incorrect sequence assignments, leading to high false positive and false negative rates (MacCoss et al, 2002). Consequently, protein identification is problematic
when based on a small number of peptide assignments (Moore et al, 2002). In such cases,
peptide assignments are manually validated by visual inspection of each MS/MS spectrum. This approach has been successful in characterizing the protein composition of organisms such as S. cerevisiae, where 25% of ORFs contained in the genome were observed (Washburn et al, 2001).
Higher eukaryotes present a more difficult problem, because there are more proteins in their proteomes, the proteins are larger, and the protein concentration ranges are wider;
consequently, more spectra must be collected to define the proteome composition. Furthermore, because protein sequence databases are larger with more sequence redundancy, each spectrum must be compared against a larger number of candidates. Manual analysis becomes a daunting task with substantial error; therefore, validation methods are needed that can be implemented computationally. A robust solution to this problem has not been achieved, although recent reports used linear discriminant analysis (Keller et al, 2002) or machine learning algorithms
(Anderson et al, 2003) to evaluate the scores generated by the Sequest search program, or used
peptide properties other than the fragmentation pattern, such as exact mass measurements (Smith
et al, 2002), to validate peptide assignments.
Here we describe a novel programmatic approach to data analysis that significantly improves sensitivity and confidence in peptide assignments and protein representation. Key features include (i) integrating results of two database search programs to increase detection sensitivity of correctly identified peptides, (ii) implementing new filtering criteria based on
16
peptide chemical properties to increase discrimination between correct vs. incorrect sequence
assignments, (iii) focusing the search strategy to improve accuracy in sequence assignments, and (iv) developing a peptide-centric nomenclature for protein profiling to accurately report
ambiguities in protein identification due to sequence redundancy in the database.
METHODS
Sample preparation
The shotgun proteomics analyses were carried out on an extract of the erythroleukemia cell line K562 grown in suspension as previously described (Whalen et al, 1997). Cells were
washed twice by centrifugation, and pellets were flash frozen in liquid nitrogen. Cell pellets were suspended in lysis buffer (140 mM potassium phosphate, pH 7.4, 150 mM NaF, 1 mM Na3VO4, 6 mM EDTA, 6 mM EGTA, 250 mM NaCl, 4 mM DTT) containing 40 µg/ml leupeptin, 5 µg/ml pepstatin A, 4 mM benzamidine, 20 mM PMSF, and sonicated 4 x 15 s at 4°C (Branson, microtip probe). Lysates were centrifuged at 200,000 x g for 30 min at 4° C, and soluble proteins recovered in the supernatant. Typically 108 cells yielded ~15 mg protein. In this study, three different samples were analyzed (Table 2.1). For Samples 1 and 2, proteins were alkylated with 14 mM iodoacetamide (Aldrich, Milwaukee, WI) for 30 min in the dark at room temperature. Reactions were quenched by adding 3 mM DTT, and proteins were
immediately desalted on a PD10 column (Amersham, Piscataway, NJ) equilibrated with 100 mM NH4HCO3, followed by trypsinization at 37° C with 3% (w/w) trypsin (Wako, Richmond, VA, Cat#20709891) added in 1% aliquots at t= 0, 4, and 12 h. The NH4HCO3 was removed by repeated lyophilization and resuspension in water (usually 3 times) until the conductivity after
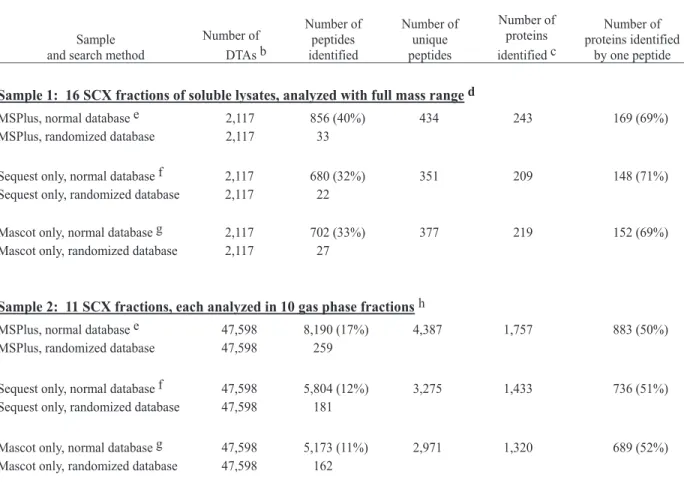
Table 2.1 Samples of soluble protein extracts from human K562 erythroleukemia cells. a
Sample and search method
Number of DTAs b Number of peptides identified Number of unique peptides Number of proteins identified c Number of proteins identified by one peptide
Sample 1: 16 SCX fractions of soluble lysates, analyzed with full mass range d
MSPlus, normal database e 2,117 856 (40%) 434 243 169 (69%) MSPlus, randomized database 2,117 33
Sequest only, normal database f 2,117 680 (32%) 351 209 148 (71%) Sequest only, randomized database 2,117 22
Mascot only, normal database g 2,117 702 (33%) 377 219 152 (69%) Mascot only, randomized database 2,117 27
Sample 2: 11 SCX fractions, each analyzed in 10 gas phase fractionsh
MSPlus, normal database e 47,598 8,190 (17%) 4,387 1,757 883 (50%) MSPlus, randomized database 47,598 259
Sequest only, normal database f 47,598 5,804 (12%) 3,275 1,433 736 (51%) Sequest only, randomized database 47,598 181
Mascot only, normal database g 47,598 5,173 (11%) 2,971 1,320 689 (52%) Mascot only, randomized database 47,598 162
Sample 3: 7 gel filtration fractions x 16 SCX fractions, each analyzed in 6 gas phase fractions i
MSPlus, normal database e 602,520 85,267 (14%) 20,675 5,130 2,323 (45%) Sequest only, normal database f 602,520 64,194 (11%) 15,217 4,120 1,790 (43%) Mascot only, normal database g 602,520 63,431 (11%) 16,006 3,971 1,683 (42%)
a Summary of samples described in this study, showing effects of varying sample fractionation by gel filtration and gas phase fractionation. b Number of MS/MS files with peptide mass between 900-4,800 Da.
c Proteins counted after removing redundancies with Isoform Resolver (see text and Table 3).
d Soluble extracts (1 x 10⁸ cells) were trypsinized and peptides separated into 16 fractions by SCX-HPLC. 6.3% of each fraction was analyzed by RP-LC/MS/MS, collecting data over a full ion mass range of 350-1,500. Tables of validated peptide sequences and scores, and raw data files for Sample 1 are available upon request. e MSPlus protocol was carried out using the normal or randomized IPI database (April 10, 2003, 48,000 entries). Acceptable assignments required peptide mass between 900 Da and 4,800 Da, up to two tryptic cleavages, no internal KK, KR, RR, or RK sequences, no covalent modifications, and either consensus between Sequest
and Mascot or XCorr and Mowse scores above unequivocal thresholds (XCorr ≥2.55 (MH+1), 3.39 (MH
2+2), and 3.78 (MH3+3); Mowse = 44 (MH+1), 49 (MH2+2), and 49
(MH3+3)), ion ratio >25% (MH+1 or MH2+2) or >20% (MH3+3), RSP=1, and a number of basic residues consistent with the SCX fraction the peptide was in.
f Sequest search protocol was carried out using the normal or randomized IPI database. Acceptable assignments required XCorr values above a threshold that yielded
the same ratio of the false positive assignments to the number of identified peptides (~3.4%) as MSPlus. Sample 1: XCorr = 2.56 (MH+1), 2.98 (MH
2+2), and 3.0
(MH3+3); Sample 2: XCorr = 2.31 (MH+1), 2.75 (MH2+2), and 3.0 (MH3+3); Sample 3: XCorr = 2.3 (MH+1), 2.7 (MH2+2), and 2.8 (MH3+3).
Mascot search protocol was carried out using the normal or randomized IPI database. Acceptable assignments required XCorr values above a threshold that yielded the same ratio of the false positive assignments to the number of identified peptides (~3.4%) as MSPlus. Sample 1: Mowse = 44 (MH+), 39.6 (MH2+2), and 39.6 (MH3+3); Sample 2: Mowse = 44 (MH+), 47 (MH2+2), and 47 (MH3+3); Sample 3: Mowse = 44 (MH+), 44 (MH2+2), and 46 (MH3+3).
h Soluble extracts (1 x 10⁸ cells) were trypsinized and peptides separated into 11 fractions by SCX-HPLC. 7.5% of each fraction was used in separate RP-LC/MS/MS analyses of each of ten overlapping narrow mass ranges: 300-558 Da, 550-678 Da, 670-798 Da, 790-918 Da, 910-1,038 Da, 1,030-1,158 Da, 1,150-1,278 Da, 1,270-1,398 Da, 1,390-1,558 Da, 1,550-1,718 Da, consuming 75% of the sample.
i Soluble extracts were separated by sizing gel exclusion chromatography into 13 fractions, with pool size based on UV profiles. Nine of the gel filtration fractions (fx# 1, 2, 3, 5, 7, 9, 11, 12, and 13) were trypsinized and peptides separated into 16 fractions by SCX-HPLC. 5% of each fraction was analyzed by RP-LC/MS/MS over a full mass range of 350-1,500 Da, and 15% of each fraction was analyzed over 6 overlapping mass ranges: 300-678, 670-798, 790-918, 910-1,038, 1,030-1,278, 1,270-1,750.
18 g
dilution of 10 µl sample into 3 ml of water was less than 0.004 mho/cm. Lyophilized peptides were dissolved in Buffer A (5 mM K2HPO4, 5% acetonitrile pH 4) and fractionated by HPLC using a SCX column (PolySulfoethyl A, 2.1 mm ID x 200 mm, Poly LC), equilibrated in Buffer A, and eluted using a gradient of increasing 0.5 M KCl in Buffer A. For Sample 3, proteins were homogenized in lysis buffer on a gel filtration column (Sephacryl HR300 (26/60), Amersham) equilibrated in lysis buffer. The column was run at 1.3 ml/min, collecting 8 mL fractions over the included volume. Proteins in the pooled fractions were then alkylated with iodoacetamide, desalted into 100 mM NH4HCO3, digested, lyophilized and processed in the same manner as Samples 1 and 2. Sample preparation was performed by Dr. Natalie Ahn.
Data collection
For Samples 1 and 2, aliquots of 5-20% of the total SCX fraction were loaded onto 250 µm ID reversed-phase capillary columns fabricated in-house, using a frit made from a C18
Empore Disk (3M, St. Paul, MN), inserting a 50 µm ID, 180 µm OD piece of tubing as an outlet, then joining the two pieces of tubing with epoxy glue (EPO-TEK; Epoxy Technology, Billerica, MA). Columns were packed with Jupiter C18 resin (10 µm particle size; Phenomenex, Torrance, CA) using a bomb pressurized with helium gas at 100 – 400 psi. A multi-stage gradient
delivered by an Agilent 1100 Series HPLC (Agilent Technologies, Santa Clara, CA) was used to elute peptides into the electrospray ionization source of an LCQ Classic ion trap mass
spectrometer (ThermoElectron, San Jose, CA). Columns were loaded and washed in 0.1% formic acid (buffer A) at 10 µl/min. For Sample 1, peptides were eluted with a gradient into Buffer B (70:30 acetonitrile:water + 0.1% formic acid) at 5 µl/min: 0 – 30% B in 30 min, 30 –
50% B in 10 min, 50 – 100% B in 10 min. For Samples 2 and 3, the gradient was 0 – 18% B in 27 min, 18 – 27% B in 45 min, 27 – 50% B in 22 min, and 50 – 100% B in 7 min.
The target value for the ion trap was 5 x 10⁸ ions in full scan mode and 2 x 10⁷ ions in MS/MS mode, and regularly reoptimized in concert with the electron multiplier voltage to enhance the mass spectrometer performance. One full scan mass spectrum was acquired, then MS/MS spectra were acquired for the three most intense peaks in the MS spectrum, using a normalized collision energy of 34 units. To ensure that the same high abundance ions were not continually analyzed, dynamic exclusion was set to exclude ion mass-to-charge ratios (m/z) from
MS/MS after they were analyzed twice during a 90 s interval. After 3 min, the m/z value was
removed from the exclusion list. The m/z scan range was either 350-1500 for full mass range, or a sequence of overlapping m/z ranges (gas phase fractionation) (Spahr et al, 2001; Yi et al,
2002), as described in Table 2.1. Data collection was performed by Lauren Aveline-Wolf and Kevin Pierce.
Data collection
DTA files were generated from the MS/MS spectra using TurboSequest, with intensity threshold=10,000, peptide mass tolerance=2.5 Da (average mass), allowed grouping of 1-5 scans, and minimum ion count=35. An in-house script concatenated DTA files into a Mascot Generic File for Mascot searches. Mascot and Sequest searches were normally carried out allowing 2.5 Da (avg) peptide mass tolerance and 1.0 Da (avg) fragment ion mass tolerance. Static modification of Cys and tryptic cleavage were specified for the searches; because TurboSequest allows cleavages at KP or RP, the Pro cleavage trypsin setting was used for
20
Mascot. One incomplete cleavage was allowed for TurboSequest and two incomplete cleavages for Mascot, using the IPI human protein database (http://www.ebi.ac.uk, version 2.18, updated April 10, 2003). In analysis of oxidation or phosphorylation, database searches were carried out allowing variable modification of Met and Trp, or Ser, Thr, and Tyr, respectively. The output files of Mascot were parsed into MYSQL using a modified version of DBParser (Yang et al,
2003) (provided by Jeff Kowalak, NIH), then into an Oracle 9i database; Sequest results were parsed directly into the Oracle database using an in-house parser. Workflow scripts were implemented by Alex Mendoza.
Text files summarizing results were generated by SQL for input to in-house Perl scripts that applied filtering criteria (MSPlus), generated protein profiles (Isoform Resolver), and carried out spectral comparisons (CLASP). MSPlus compares results of Sequest and Mascot searches, considering the two charge forms of multiply charged DTA files separately, and excludes or validates the assignments according to a set of rules. The rules are applied in the following order: (1) Exclude all assignments where (a) the observed MW is <900 Da, (b) the peptide length <8 amino acids long, (c) there is an internal KR, KK, RK, or RR sequence, (c) the number of basic residues is inconsistent with elution during SCX chromatography, or (d) the Sequest ion score is greater than or equal to 20% (+3) or 25% (+1 or +2). (2) Validate any assignment scoring above threshold for Mowse or above threshold for XCorr where RSP=1 (we observed no cases in which Sequest and Mascot disagreed and both assignments were above threshold), as described in Results. (3) Validate assignments scoring below thresholds when the following conditions are met: (a) Mascot and Sequest agree (peptide isoforms with 1 or 2 substitutions of K/Q/E, D/N/I/L, E/M, V/P, or V/T are considered identical by MSPlus; the choice of peptide isoform is made in Isoform Resolver, see below), (b) RSP=1, and (c) Sumscore is greater than or
equal to 3.5, where Sumscore = XCorr + Mowse/C [C is a normalization factor = 18 (+1), 15 (+2), or 12 (+3), obtained by linear least squares fitting of XCorr vs. Mowse values for DTA files
that have identical peptide assignments by Sequest and Mascot and at least one score above threshold]. (4) Resolve ambiguities regarding ion charge for DTA files (ambiguous multiply charged DTA files were searched assuming both +2 and +3 charge); in <2% of cases, both charge forms of a DTA were found in the validated list, and MSPlus chose the form with highest Sumscore.
Isoform Resolver uses peptides validated by MSPlus to construct a protein profile. For each peptide, protein accession numbers for all protein entries containing that peptide sequence replaces the accession number(s) assigned by the search program(s). Then, peptides are grouped according to the protein variants in which they are present. The minimum number of proteins that account for all peptides in each group are computed using a greedy algorithm. Isoform Resolver also considers peptide isoforms containing one or two amino acid replacements that are often not distinguished by ion trap mass spectrometers (D/N/I/L, K/Q/E, E/M, V/T, or V/P). If a peptide isoform is present which specifies more than one protein, all peptides are reported although only one protein is counted, favoring proteins that are supported by other peptide identifications; the other protein(s) and isoform peptides are reported in a separate list.
CLASP performs a pairwise comparison of DTA files in order to identify those that are plausibly derived from identical or related peptide sequences. First, DTA files are grouped by observed mass, normalized reverse phase elution time, and SCX elution (allowable ranges
defined by user). For each pair of DTA files, a similarity score is calculated as the percentage of fragment ions in common, using only the monoisotopic forms of each ion with mass tolerance of 2.0 Da. To reduce noise, CLASP only considers fragment ions with intensities greater than the
22
mean value of all fragment ion intensities plus 0.5 times the standard deviation. The minimum acceptable similarity score is determined from cases in which one search program made an incorrect assignment due to distraction, while the other program made a correct assignment that scored below threshold, and therefore was not validated by MSPlus. CLASP was used to
identify cases of distraction (see Results), by comparing DTA assignments that MSPlus failed to validate, against DTA assignments that were validated by MSPlus. DTA files of peptides that eluted within 90 scans of each other, eluted in the same or adjacent two SCX fractions, and had observed mass within 9 Da of predicted (to allow for error due to space charging) were scored for spectral similarity. CLASP was also used to identify spectra of peptides that were modified by dehydration (-18 Da), deammoniation (-17 Da), Met/Trp oxidation (+16, +32 Da), or Met side chain β-elimination (-48 Da). The nonvalidated spectra were compared against the validated spectra, allowing a mass difference appropriate to each case: –14 to –20 Da (dehydrated, deammoniated), +15 to +17 Da or +31 to +33 Da (Met/Trp oxidized), or –46 to –50 Da (Met β -eliminated). Sequences were checked to ensure the amino acid composition was appropriate for each modification. A second search condition for oxidation used variable modification of Met or Trp, which allowed estimation of the number of cases in which the unmodified peptide was absent.
Manual analysis was carried out by selecting a random subset of the data, and screened initially by an experienced analyst. About one-third of spectra could be evaluated based on simple criteria as incorrectly assigned (more than three major ions were not identified) or
correctly assigned (all ions with signal >10 times noise were identified, and chemically plausible cleavages C-terminal to Asp or N-terminal to Pro were observed, when present); the remainder were independently examined by a second analyst, who also evaluated internal fragment ions and
other types of fragment ions not considered by Mascot and Sequest, using Protein Prospector (http://prospector.ucsf.edu) to calculate the predicted ions. Correct assignments required that the peptide sequence accounted for >95% of the fragment ion current above background. Where necessary, the manual analysis includes a detailed assessment of chemical plausibility.
Examples of manually analyzed spectra are shown in Appendix A.
RESULTS AND DISCUSSION
Characterizing the MS/MS dataset
Experiments were carried out to determine the number of peptide assignments validated by conventional search methods. Initial studies compared the effectiveness of two database search programs, Sequest (Eng et al, 1994) and Mascot (Perkins et al, 1999), in assigning
sequences to MS/MS data collected on a tryptic digest of extracts from human K562 cells separated into 16 SCX fractions (Sample 1). For searching, MS/MS data were summarized as text files (DTA files). Two DTA files were generated for each multiply charged parent ion by assuming that the parent is either doubly or triply charged; in this discussion, these pairs are counted as one DTA file. A commonly used approach for validation of search results is to accept all peptide assignments with scores above a certain threshold; this threshold is often determined by searching against a "randomized" protein database created by inverting each protein sequence contained in the normal database (Keller et al, 2002). Fig. 2.1A shows the distributions of
cross-correlation (XCorr) scores for doubly charged ions of a dataset searched by Sequest against both the normal and randomized database. When spectra are searched against randomized databases
24
I II III IV I II III IV I II III IV 8 6 4 2 0 I: Randomized database II: Normal database III: Protein standards IV: MSPlus method
B C charge: +1 +2 +3 0 1 2 3 4 5 Number of repeats 100 80 60 40 20 0 120 TurboSequest Mascot MSPlus 0 50 100 200 250 300 0 1 2 3 4 5 6 7 8 300 200 100 0 A 0 1 2 3 4 5 6 7 8 XCorr # D TA f ile s X Cor r # pep tide as signmen ts
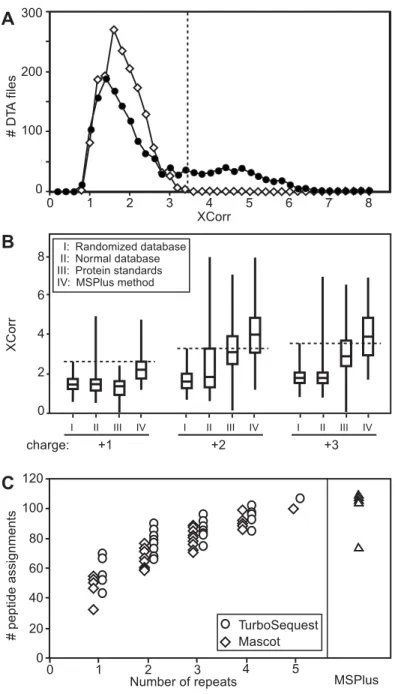
Figure 2.1. Randomly determined peptide scores. Only half of peptide assignments have scores greater than randomly determined. (A) Distribution of XCorr values for DTA files generated from Sample 1 illustrates the method used for determining thresholds from random-ized database searches. Shown are results of searching doubly charged ions (1,615 files)
against a normal protein database (IPI version 2.18, April 10, 2003) (closed circles), or against a randomized database in which each protein sequence in the normal database was inverted (open symbols). The highest score produced by chance in the randomized database search (XCorr = 3.22, vertical line) indicates the threshold value for doubly charged ions, above which sequence assignments can be accepted with high confidence. The highest XCorr score in the normal search was 7.93.
Figure 2.1. (continued) (B) Distribution of XCorr values for singly, doubly, and triply charged ions, searched using Sequest. Box plots indicate median and quartile values (boxes), and highest and lowest scores (whiskers). (I) DTA files from Sample 1 searched against the randomized database indicate thresholds of 2.56 (MH+), 3.22 (MH2+2) and 3.45 (MH3+3) (horizontal dotted lines). (II) DTA files from Sample 1 searched against the normal IPI data-base, where some assignments with scores below thresholds represent correct assignments. (III) DTA files representing manually confirmed peptides from a set of 18 protein standards (Perkins et al, 1999) showed 46% of validated assignments with scores above thresholds from random-ized searches. (IV) DTA files from Sample 1 searched using MSPlus peptide sequences accepted as valid based on the combined method, showing improved discrimination from corresponding randomized database searches. Thus, the validated peptides (set IV) are a subset of set I/II. Parallel searches using Mascot indicated Mowse thresholds of 46 (MH+), 50
(MH2+2), and 50 (MH3+3) for searches against a randomized database (not shown). Manual analysis of a random subset of peptide assignments in (II) with scores above thresholds
confirmed all Sequest and Mascot identifications as valid. Similar improved discrimination was observed using MSPlus over the Mascot search alone with the normal database. The number of DTA files in each experiment were: I and II (+1) 655, (+2) 1,462, (+3) 1,462; III (+1) 66, (+2) 201, (+3) 63; IV (+1) 167, (+2) 589, (+3) 100. (C) Repeated LC/MS/MS analyses of a single SCX fraction from Sample 3, searched with Sequest (circles) or Mascot (diamonds). The number of unique peptide assignments with scores above thresholds determined from random-ized searches (see Panel B) was determined for each of the five analyses. The number of unique peptide assignments within 5 combinations of one dataset, 10 combinations of two datasets, 10 combinations of 3 datasets, 5 combinations of 4 datasets, and one combination of 5 datasets is shown, where each data point represents one combination. The results show that the number of unique peptide assignments when considering one dataset (57 for Sequest, 50 for Mascot) increases when considering all five datasets (109 for Sequest, 95 for Mascot), indicat-ing that about twice as many peptides are identifiable in repeated experiments. In contrast, the number of peptide assignments captured by MSPlus in each individual analysis (triangles) was comparable to the number seen in aggregate by Sequest or Mascot alone, demonstrating greater sensitivity in validating assignments. Likewise, the number of proteins in each MSPlus analysis showed 92% overlap with proteins identified from 5 aggregate datasets by Sequest.
with Sequest, the XCorr distribution peaks at low values and falls to zero at a threshold value that determines the highest scores obtained by chance. In a normal search of similar database size, peptide assignments with scores above this threshold have a very high probability of being correct (MacCoss et al, 2002; Keller et al, 2002). Threshold XCorr values of 2.56, 3.22, and
3.45 for MH1+1, MH2+2, and MH3+3 ion charge states, respectively, were determined from
searching a randomized IPI database using Sequest (Fig. 2.1B, Set I). When searched by Sequest against a normal database (Fig. 2.1B, Set II), only 523 (25%) of 2,117 DTA files generated from Sample 1 showed XCorr values above these thresholds. The presence of incorrect spectra in the normal searches is revealed by the large peak centered about XCorr ~2 (Fig. 2.1A). Similar results were obtained using Mascot and evaluating Mowse score thresholds (data not shown).
It is known that many valid peptide assignments yield scores below threshold (MacCoss
et al, 2002; Keller et al, 2002); therefore, we next estimated the maximum number of peptides
that should be identifiable in a given MS/MS dataset, regardless of score. This was assessed in three ways. First, 18 standard proteins (Keller et al, 2002) were digested using trypsin, and
peptide spectra acquired during the LC/MS/MS analyses were manually validated to determine correct identifications. Analyzed by Sequest, 54% of the validated peptide assignments for this set scored below the thresholds determined by the randomized database (Fig 2.1B, Set III). Applying this estimate from the standards to Sample 1, where there are 523 DTA files with XCorr scores above threshold, predicts that an additional ~614 DTA files with scores below threshold should be identifiable, and ~1,137 of the 2,117 DTA files should represent identifiable tryptic peptides in this dataset (class positive). Thus, an estimated 980 DTA files cannot be identified by this search protocol (class negative).
A second way to estimate the number in the class positive is based on the understanding that shotgun proteomics involves population sampling and that stochastic processes lead to low scores and incorrect assignments. Therefore, repeated analysis should eventually allow all of the identifiable peptides to score above threshold. Indeed, in replicate analyses, the number of unique peptide assignments above threshold increased by 2-fold after extrapolating to an
endpoint (Fig. 2.1C). This approach predicted that at least 1,046 of the total DTA files should be assignable to tryptic peptides, similar to the 1,137 estimated by the first method.
The third method estimated the number of class negative DTA files from combined results of several experiments, which showed that ~43% of DTA files in Sample 1 represented artifacts such as oxidation during sample handling, in-source fragmentation during MS, ions too weak for search programs to assign correctly, incorrectly made DTA files, or false positives (for more detailed discussion, see below). Only 66 DTA files were not explained, and these may represent nonpeptide ions, salt adducts, or other peptide modifications. This is further evidence that ~54% of DTA files would be expected as class positive. Overall, the three approaches suggest that 50-60% of DTA files should be assignable to tryptic peptides in Sample 1. Of these, less than half can be validated based on having scores above thresholds. The rest are "hidden" due to their failure to be validated using a threshold approach.
Combining Sequest and Mascot improves validation of peptide assignments
We then looked for ways to identify and validate these low scoring peptide assignments. In studies comparing search programs, we found that a given peptide assignment might obtain a high score with one search program and a low score with another search program, presumably
28
due to variations in the scoring algorithm between programs (Fig. 2.2A). We utilized parsers to capture Mascot and Sequest outputs into a database, and wrote a script (MSPlus) that allowed easy comparison of results from Sequest and Mascot programs. Thus, in Sample 1, 7.5% of Sequest assignments with subthreshold XCorr scores were validated when Mascot assignments of the same DTA files showed Mowse scores above threshold. Another important class included cases where both search programs made the same sequence assignment, although both XCorr and Mowse scores were below threshold. However, manual analysis indicated that only half in this class were correctly assigned; therefore, a filtering protocol was implemented in MSPlus to discriminate between correct vs. incorrect assignments.
Filters tested included the Sequest scores SP and RSP (preliminary score and ranked preliminary score, where SP is the sum of the matched b and y fragment ions together with adjustment factors for matching consecutive ions in a series), ion ratio (percent of theoretical fragment ions observed in a spectrum), and ΔCN (difference in XCorr between the first and second highest ranking sequence assignments) (Eng et al, 1994; Yates et al, 1995). Examination
of manually validated data revealed that 97% of correctly assigned sequences had RSP=1, all singly or doubly charged ions had ion ratio >25%, and 95% of triply charged ions had ion ratio >20%. SP and ΔCN provided insufficient discrimination, possibly because of the large size and sequence redundancy of the human database, and were not used. We also excluded peptides with mass less than 900 Da, because we found that the frequency of incorrect assignments due to distraction (see below) was greater with small peptides. This was not a serious limitation,
because peptides smaller than 9 amino acids were not generally useful for uniquely specifying proteins. Also excluded were assignments with internal KR, RK, KK, or RR sequences, where trypsin would cleave efficiently.
30 0 2 4 6 8 0 50 100 150 0 2 4 6 8 0 50 100 150 0 1 2 3 4 5 0 20 40 60 80
A
Mowse XC or rB
Validated by Sequest 523 Additional validated by MSplus 300 FN 101 Distracted 210 Weak ions, poor fragmentation 332 FP 104 Fragment ions and nontryptic proteolysis 395 66 Unk FP 33 DTA errors+1 ions +2 ions +3 ions
Class positives = 1134 (predicted 1137)
Class negatives = 980
50 Mod.
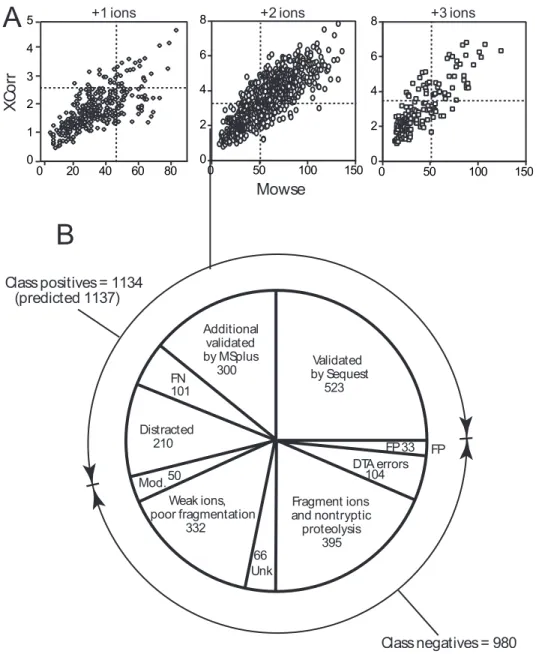
Figure 2.2. Combining Sequest and Mascot results to validate more DTA files. (A) Com-parison of XCorr vs Mowse scores for DTA files in Sample 1, in which both Sequest and Mascot identified the same peptide sequence. Thresholds for different charge states determined from randomized database searches (Fig. 1B) are indicated by lines. The results show a signifi-cant number of DTA files scoring above threshold for one program but not the other, which reveals that the two programs have overlapping but nonidentical scoring criteria. (B) Summary of DTA file classifications from Sample 1. The number of class positive assignments was estimated by extrapolating the number of DTA files for standard peptides above Sequest thresh-olds (1,137 = 46% of 2,117); the number of class negatives (980) was obtained by subtracting class positives from the total number of DTA files (980 = 2,117-1,137). The number of Sequest assignments scoring above threshold was 523. The number of assignments made by MSPlus was 856 (Table 1), which included Sequest assignments scoring above threshold (Validated by Sequest = 523), and false positive assignments (FP = 33) estimated by searching against the randomized database.
Figure 2.2. (continued) By difference, ~300 additional assignments were validated by MSPlus. False negative assignments (FN = 101) were estimated by manual analysis, as described in the text. The distracted class (Distracted = 210) is estimated from DTA files that were incorrectly assigned by Sequest, but identifiable by CLASP, as described in the text. Other classifications in Sample 1, estimated by direct counting, included: (i) 332 DTA files with weak ions or poor fragmentation (threshold defined by the lowest signal to noise for fragment ions in DTA files that were manually validated), (ii) 50 post-translationally modified peptides, e.g., containing oxidation products of methionine or tryptophan (47 DTA files), phosphate (3 DTA files), or incomplete cysteine alkylation (none observed), (iii) 395 fragment ions or nonspecific proteoly-sis products, identified by searching without specifying protease cleavage and extrapolating for false negatives and distracted cases (276 DTA files), or dehydrated/deammoniated fragment ions of parents identified using CLASP (119 DTA files), and (iv) 104 DTA errors. DTA errors included (a) 3.5% of DTA files (74) representing ions of charge greater than or equal to 4 (estimated by analyzing results from data collected with high resolution scans in order to iden-tify the charge), (b) 0.9% of DTA files (19) representing singly charged ions misassigned as multiply charged ions, due to noise peaks in the MS/MS at masses greater than the parent ion (identified by the dehydrated fragment ions of the parents in a small dataset), (c) 0.5% DTA files (11) which represent incorrect combinations of MS/MS that are actually derived from different peptide ions (identified by manual analysis of those DTA files where more than one MS/MS spectrum was summed in order to enhance signal to noise, and the peptides were validated by MSPlus, and at least 35% of the fragment ions were unidentified). After summing all classes, 66 remained with unknown classification (Unk).
An important filter criterion insured that the number of basic residues in the assigned sequence was consistent with the SCX column elution. A set of rules was delineated from the SCX behavior of the high scoring peptides. For example, only peptides with 1 basic residue were allowed in SCX fraction 4 through 8, and only peptides with 1 or 2 basic residues were allowed in fraction 9 (Fig. 2.3A and legend). These criteria were highly discriminatory; in analyses with the randomized database, the SCX filter removed half of the false positives observed among MSPlus-validated peptides generated without the filter. Fig. 2.3B shows that the SCX filter preferentially removed incorrectly assigned spectra that were concentrated in the peak between XCorr 0.8 - 3.2. This figure also shows the effect of further applying the RSP =1 filter as well as the complete set of filtering criteria. Although the filters removed a few
validated assignments, most of these peptides were captured in other fractions or from other DTA files.
MSPlus is a heuristic or expert program that implements a set of pass/fail rules using all these criteria for acceptance/rejection of peptide assignments, as described in Methods. After filtering the combined results of Sequest and Mascot searches using these criteria, MSPlus validated 854 DTA files (40% of the total DTA files) in Sample 1 (Table 2.1, Fig. 2.2B). A second script (Isoform Resolver) assembled these peptide sequences into a protein profile, applying an additional filter for false positives due to sequence isoforms in the database and reporting the minimum protein profile that will account for the peptide data (discussed in detail below and in Methods). MSPlus and Isoform Resolver were applied to the five repeated LC/MS analyses described in Fig. 2.1C (right panel) and compared to results obtained by the Sequest threshold approach. Analyses of each individual LC/MS by MSPlus/Isoform Resolver yielded
32
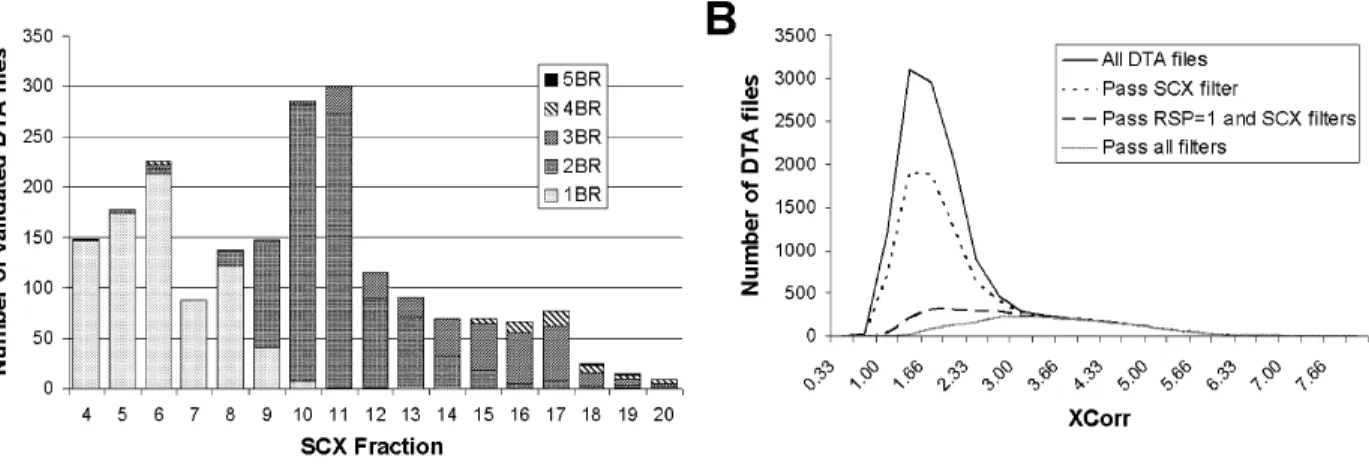
Figure 2.3. Using SCX chromatography as an MSPlus filtering criterion. (A) The number of basic residues (BR: Lys, Arg, His) in peptide sequences for DTA files that passed all
MSPlus filters (excluding the SCX filter) are plotted vs their SCX fraction number. Early eluting fractions primarily contain peptides with one basic residue, while later fractions contain peptides with multiple basic residues. Rules were developed for each SCX graphic run, because small variations were observed with column lot number and chromato-graphic conditions. The data shown represent one sizing gel fraction from Sample 3, where
the SCX filter allowed (1) 1BR in fr# 48, (2) 1 or 2 BR for fr# 9, (3) 2 BR for fraction 10, (4) 2 or 3 BR for fr# 1114, (5) 2, 3, or 4 BR for fr# 1520.(B) The effect on the XCorr distribution of
MSPlus-validated DTA files is shown after sequentially applying the SCX rules derived from Panel A, the RSP =1 filter, and the remaining MSPlus filters. Each filter removes large num-bers of incorrect assignments, without affecting the high confidence assignments with XCorr
>3.5. A few DTA files with correct assignments were lost, however many were captured in
adjacent SCX fractions. Importantly, applying the SCX filter had little effect on the protein profile. Thus, the SCX filter removed only 4 proteins in Sample 1, which in all cases were supported by only one peptide.