Metodološki zvezki, 18, Ljubljana: FDV, 2002
Virtual Selves and Web Surveys
1Katja Lozar Manfreda
2, Mick Couper
3, Mateja Vohar
2,
Salvador Rivas
4, and Vasja Vehovar
2Abstract
With rapid transfer of many forms of social inquiry through structured questionnaires to the Web it is increasingly important to explore whether the Web is indeed a ‘socially neutral’ research tool as many believe. Because of the graphical and interactive nature of the Web and the context of global environment, social desirability effects in Web surveys may be different from with other self-administered methods, which usually reduce them. In addition, increased use of interactive services, such as multiple user domains, interactive chat rooms and interactive online games encourages widespread adoption of ‘virtual personas’ on the Web. It is thus important to explore how participation in such interactive services may mitigate potential benefits of the Web for social research.
Our research explores whether those who are frequent participants in so-called ‘alternate realities’ on the Web are more likely to present their ‘virtual personas’ or their ‘real selves’ when answering questions in Web surveys. Users of interactive services are identified in a large national Web survey of Internet users in Slovenia within the project RIS (http://www.ris.org) at the Faculty of Social Sciences, University of Ljubljana. They are asked a variety of questions relating to self-image that are known to be subject to social desirability bias. At the end of the survey they are asked for their telephone number. A random sample of respondents from the population of non-users of interactive services is also selected. Both groups are then administered a telephone survey, with the key self-presentation and social desirability items replicated. We then compare the responses to the telephone survey with those provided in the Web survey. Our hypothesis is that those who are regular participants in interactive services are more likely to present themselves in a different light on the Web than on the telephone, relative to the non-user group.
1
The joint work of researchers from the University of Ljubljana and the University of Michigan for this paper was sponsored by the Slovenian Ministry of Education, Science and Sport (Project SLO-US-2001/17) and National Science Foundation (Project “Cognitive Issues in the Design of Web Surveys. Supplement for International Program: Virtual Selves and Web Surveys”).
2
Faculty of Social Sciences, University of Ljubljana, Slovenia; [email protected].
3
Institute for Social Research, University of Michigan, US.
4
1 Introduction
Web surveys can offer many benefits to the research community. With Web surveys the data can be collected easily and in a short time period. We can thus observe Web survey questionnaires almost anywhere on the Web.
Nevertheless, professional Web surveys are not easy to handle and researchers face several problems. How to gain sufficient number of respondents, how to collect data of sufficient quality, how to infer from these data to the population are only few of basic problems one is faced with while conducting on-line survey research. The new mode of data collection demands new approaches to handle these problems.
The issue of data quality presents a particular concern forWeb surveys. The question is whether data collected with a Web survey are of equal quality compared to data collected with traditional modes of data collection (face-to-face, telephone, and mail surveys). In this paper we focus our attention to a specific aspect of this problem –the problem of social desirability. In general it has been found that self-administered questionnaires are less liable to social desirability effects compared with interviewer-administered questionnaires (de Leeuw, 1992: 205; Dillman, 1983: 374; 1991: 243; Groves, 1990: 227; Lyberg & Kasprzyk, 1991; Tourangeau & Smith, 1996). Web surveys are – because of their self-administered nature – often treated as equivalent to other self-self-administered methods (e.g., mail surveys) with regard to the influences on respondents’ answers (see for example Dillman, 2000).
However, the Web is a fundamentally different medium and should be treated with special caution. Because of its graphic and interactive nature we may not reap the same gains in reduction of social desirability effects with Web surveys as we have seen with other self-administered methods. As the Internet bandwidth continues to increase, the interactive services like Internet Relay Chat (IRC), Multiple users domains (MUD and MOO systems), and interactive online games rapidly proliferate and become much more attractive, encouraging the widespread adoption of ‘virtual personas’ on the Web. A great deal of qualitative research has already begun to focus on interaction in these ‘virtual communities’ (see, for example, Bechar-Israeli, 1995; Jacobson, 2001; Serpentelli, 1999; Witmer, 1997). At the same time, the Web is rapidly developing as a method for quantitative social research on a wide variety of sensitive topics, such as interracial attitudes and affirmative action (see Couper et al., 2001), drug and alcohol use (see Coomber, 1997; McCabe et al., 2002) and sexual behavior (Ross et al., 2000). It is thus important to explore how participation in one realm of the Web may spill over into another and mitigate the potential benefits of the Web for social research.
In this paper we are examining the effect of Web survey questionnaire on social desirability of responses. However, we are not simply comparing the social desirability bias of Web responses to the responses in other ‘traditional’ survey modes. We are rather extending this research by examining whether those who are frequent participants in so-called ‘alternate realities’ on the Web are more likely to present their ‘virtual personas’ or represent their ‘real selves’ when answering questions in a Web survey. Specifically, we hypothesize that those who participate in multiple user domains (MUDs and MOOs), chat rooms (such as Internet Relay Chat or IRC), interactive games or similar interactive communications over the Web that permit or even encourage the adoption of alternative personalities may retain these personalities when participating in other Web activities.
Our research question is thus focused on the implications of these Web activities for survey research. In other words, can and do persons who use the Web to create virtual selves step out of those selves when participating in other Web activities such as surveys? Alternatively, do the alternative Web personalities endure beyond the narrow range of the interactive Internet services in which they are created? This question is important because it explores the extent to which a virtual system such as the Internet (and particularly the World Wide Web) facilitates manipulation of self-presentation, and whether Web surveys can obtain accurate answers from respondents under these conditions. Thus, the implications of this research go beyond social desirability effects in Web surveys. It begins to address the question of how enduring and pervasive the alternative personalities may be.
2
Alternative realities and implications for survey
research
Alternative realities can be adopted by Internet users using several interactive services on the World Wide Web, such as multiple user domains (MUDs5
and object-oriented MOOs6), chat rooms (such as Internet Relay Chat or IRC7),
5
MUD – Multiple User Dimensions, Domains or Dungeons – systems are based on text exchange between two or more participants in a virtual space. They developed from interactive games and their primary role was entertainment. Lately, these systems have become more “serious” with a lot of professional (educational) content.
6
MOO – MUD-object-oriented – systems have their roots in the MUD systems. However, they are technically more developed in the sense that communications take place in in the object-oriented worlds (rooms). People not only talk, but also develop objects and rooms for communication. These systems are seen as virtual places by the users (participants).
7
IRC – Internet Relay Chat - is probably the best known and the most spread interactive service of computer-mediated communication. It is primary text based on-line communication, but lately includes also multimedia. IRC as a network of chat channels connects people with the same interests (cooking channels, literature channels), of the same nationality, same age, etc.
interactive games8
(strategies, actions, arcades, such as Quake, AOE, Diablo II, Starcraft, etc.) or similar interactive communications. Communication in these interactive services is synchronous, i.e. real time communication between two or more individuals at the same time (in contrast to asynchronous mode of communication that is characteristic for email, News Groups, Bulletin Board Systems, etc.).
These interactive services enable the role exchange in sense of identity playing. Users of such systems have a possibility to take over an on-line identity, which can be very different from their off-line identity (Bruckman, 1993; Curtis, 1992). They very often cover up their real identity or at least some of the characteristics of their identity. On the other hand, they have complete control over their on-line identity and they can expose only those characteristics of that identity which they want to be seen by others. The most often used and observed phenomenon is gender-switching (Bruckman, 1993; Roberts & Parks, 1999).
Role and identity playing on the Internet stems from the characteristics of the computer-mediated communication that is different from the communication in the real life. One of the main distinctions is the absence of the visual clues (absence of physical characteristics and body language) in the interaction. Those who interact on the Internet do not know the physical appearance of each other. Information about the social context is also missing, that is the information about true gender, race, class and also information about broader social group (Parks & Floyd, 1995).
As already said, those who use interactive services can hide themselves behind fictitious identities. While communicating on-line one can adopt virtual identity in order to get new on-line friends (Jacobson, 2001). Bechar-Israeli (1995) points out that only few individuals use their real name while communicating on the Internet. This expresses a wish to be someone else, not the same person as in everyday life.
For survey research it is interesting to know whether on-line identities or at least some characteristics of those identities can be transferred to the real (everyday) life. Curtis (1992) points out that behavioral patterns created on-line can influence behavioral patterns off-line. This may have implications for survey research using the World Wide Web. We wonder whether persons who use the Internet to create virtual selves step out of those selves when participating in other Internet activities such as Web surveys. Or alternatively, do alternative Web personalities endure beyond the narrow range of the virtual worlds in which they are created?
8
Interactive games are multi-player computer games that are played with the help of the computer between more individuals, who are on-line at the same time. Players are connected to the central computer where the game is played over a local network (LAN) or public network (Internet). They can use a list of commands and in this way influence on the game of their “enemies” or react on their action. To take a part in this kind of entertainment, one has to adopt certain skills. In most cases computer games are simulations – the real world represents a model which is a very important aspect of the game (Bartle, 1999).
Since virtual systems such as the Internet facilitate the manipulation of self-presentation, we are concerned whether Web surveys can obtain accurate answers from respondents under these conditions. We address here the potential effect of these alternative personalities on the survey process. In order to explore this research question we compare those who are frequent participants in interactive Internet services enabling development of virtual personas and those who are not. We also compare responses of the two groups in a Web-survey setting and a non-Web-survey setting, i.e. in a telephone survey.
For the Web-survey setting we expect to be more likely to trigger the alternative personality for frequent interactive services users than the non-Web-survey setting. Namely, the adoption of virtual personas that is characteristic of behavior within interactive services might also be present when answering a Web questionnaire. For the users of interactive services their experience with these services might have a similar effect during the participation in a Web survey as an interviewer’s presence during the participation in a telephone survey. The effect may be a very basic consequence of the properties of any social interaction that may pressure individuals to present themselves in a more positive light. The social interaction in interactive services on the Web – although it is not personal and lacking visual clues – may thus have a similar effect as the social interaction with a live person/interviewer.
3 Research design
In order to explore the question of influence of virtual personas on data quality in Web surveys, we developed a research design to compare the survey behavior of users and non-users of interactive services in a Web and a telephone survey. We began with a Web survey that contained questions relating to image and self-presentation (more precisely, the Impression Management (IM) scale from the Balanced Inventory of Desirable Responding (BIDR); Paulhus, 1994; Robinson et al., 1991) that have been shown to reveal social desirability biases. In addition we ascertained the respondents' level of participation in a variety of interactive Internet activities. We did not directly ask about their experience with adopting virtual realities but rather assumed a tendency to use this activity if interactive services were used. At the end of the Web survey the respondents were asked if they would be willing to participate in a later telephone survey and requested their telephone number. The cooperative respondents from the Web survey were then administered a telephone survey, with the IM Scale questions replicated. We then compared the responses of the same persons to the telephone survey with those provided in the Web survey. In this comparison we distinguished among users and non-users of interactive services on the Internet.
This research was carried out in Slovenia as a part of the Research on Internet in Slovenia (RIS, http://www.ris.org) project at the Faculty of Social Sciences, University of Ljubljana, which has been conducting research on and about the Internet since 1996.
3.1
The Web survey
The Web survey used in this research was the 2001 national Web survey of Internet users in Slovenia. This survey is a non-probability self-selected Web survey. It is advertised by banner ads on all major Web sites in Slovenia (over 200 leading Web sites responded to the invitation and placed a banner ad for the survey). Email invitations to the survey are also sent to addresses from the public email directories in Slovenia. Over 14,000 responses to the survey were obtained in the period from July to October 2001.
In this experiment, only respondents who answered the Web questionnaire before the beginning of September 2001 are included. They were invited to the Web survey through banner ads (email invitations were sent later). As already said, the respondents to this survey are not representative of the general population of Internet users in Slovenia. However, for our purposes this kind of convenience sample is appropriate since the same respondents are surveyed twice and difference in their answers from two different surveys is of interest. We should also add here that in general the overall results of this self-selected Web survey (n=14,000) matched very closely with the results from the representative telephone survey on the variables where the rating scales were used. With categorical data, on the other hand, the differences between the two surveys were significantly higher.
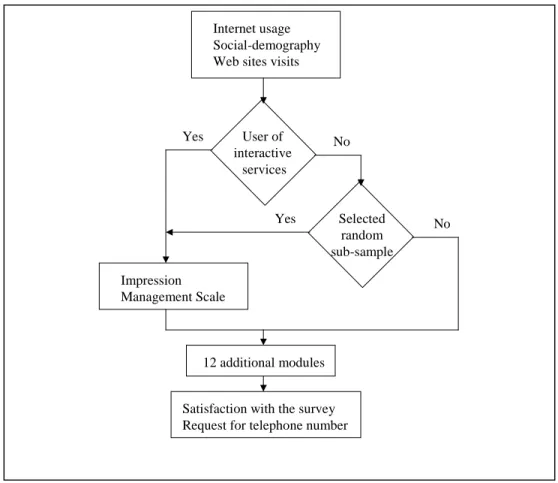
The Web questionnaire included a series of question modules with different survey topics (see Figure 1 for questionnaire flow). Most of these modules were optional. The first module, which was asked of everyone, included general questions on Internet usage, social-demographic questions, and questions on Web page visits. A question on participation in interactive services on the Internet was also included in this part of the questionnaire (see Figure 2). Answers to this question were used to distinguish between users and non-users of interactive services on the Internet where virtual personas can be adopted. We assume that those using such services are also more likely to adopt virtual personas on the Internet.
Because we expected relatively few respondents to the RIS survey to be regular users of these Internet services, all those who answered that they used any of these services at least a few times a month were assigned the questions from the IM Scale (see Section 3.3 for description). Among non-users of interactive services (those who use all of the listed services less than once a month) a random sub-sample of respondents was assigned the same questions from the IM Scale.
After that the respondents were also able to choose among additional modules of the questionnaire or to finish the questionnaire (see Figure 1).
Figure 1: Flow of the Web questionnaire.
Figure 2: Survey question on the usage of interactive Internet services. Internet usage
Social-demography Web sites visits
User of interactive services Yes No Selected random sub-sample Yes Impression Management Scale No 12 additional modules
Satisfaction with the survey Request for telephone number
How often do you use the following interactive services on the Internet? Never Less than once a month Few times a month Few times a week Almost every day Every day IRC (Internet Relay Chat)
MUD, MOO systems
Playing interactive games (strategies, action, arcades, frp, e.g., Quake, AOE, Diablo II, Starcraft etc.)
Only those respondents who answered the questions from the IM Scale are included in this analysis. There were 3,127 such respondents. However, not all of them reached the final part of the questionnaire where they were asked if they would be willing to participate in a following telephone survey and provide their telephone number. Among the 3,127 respondents, 2,369 (76%) reached the final part of the questionnaire where their telephone number was requested. Almost one third (e.g., 705 or 30%) of this group provided their telephone number9.
3.2
The telephone survey
Among the 705 Web respondents who revealed the telephone number in the Web survey, 576 actually participated in the subsequent telephone survey, which was administered a few weeks later. The exact time interval between the Web and the telephone survey is variable across individual participants. In the Web survey, telephone numbers for this study were collected in the period from July 6 to August 30, 2001. Telephone interviews – which were conducted from the telephone facility of the CATI Research Company in Ljubljana, Slovenia – took place between September 1 and September 16, 2001. The time difference between the two survey measurements therefore varies from 18 to 79 days with an average of 39 days10
. We assume that the time difference between the two surveys is large enough for the respondents in the telephone survey not to remember their answers from the Web survey.
The telephone survey replicated some of the same questions on Internet usage and social-demography from the Web survey. It also replicated the same questions from the IM Scale, so that the responses to these questions can be compared. In this paper we limit our analysis only to the comparison of the answers from the IM Scale. For the comparison of other items from the Web and the telephone survey see Vehovar and Lozar Manfreda (2002).
9
Later in the paper we analyze the responses to the IM scale that is know to be subject to social desirability (see Sections 3.3 and 4). At this point it is interesting to note that there is a difference in the Web responses to the IM scale between those who provide their telephone number for further research and those who did not. Those who were more candid in their responses, i.e. who gave less socially desirable responses, were also more willing to reveal their telephone number. For example, the percentage of socially desirable responses is 33% for those who revealed their telephone number and 36% for those who did not reveal it (the difference is statistically significant at p=0.004).
10
For all survey questions that were replicated in the Web and the telephone survey a correlation between the time interval and absolute difference between the two answers (from two surveys) was tested. The correlation turned out to be statistically significant for none of the items from the IM Scale that are of interest in this study. For the other items that were replicated in the two surveys, the correlation was statistically significant at p<0.05 only for one of the variables, and statistically significant at p<0.1 for another variable (see Vehovar and Lozar Manfreda, 2002). There was also no difference in these correlations between the two groups of respondents that are of interest here, i.e. between the users and non-users of interactive services. Therefore, time seems to have minimal impact on the differences between the two surveys.
The telephone survey response rate – the ratio of respondents in the telephone survey to all persons revealing their telephone number - was 82% (576/705). Among the non-respondents, the telephone number did not exist in 32% of the cases; nobody answered the phone in 18% of cases; or somebody answered the phone but the person participating in the Web survey was not found in 19% of the cases. In the remaining 31% of cases participants refused to be surveyed on the telephone. The refusal rate for the telephone survey was therefore 6% (refusals among all telephone numbers).
The analysis would ideally be performed on all the 576 participants who were supposed to complete both the Web and the telephone questionnaire. However, we had to further limit the number of cases for the analysis by excluding those cases whose answers to questions on gender and year of birth did not match (11 cases) or were missing on both variables (1 case). For the remaining cases, either the data matched on both variables or for at least one of them (while for the other the value was not available). Regarding year of birth, we also retained 7 cases where the year of birth was different by one year, but the data on gender and also education and employment matched. Since in the Web questionnaire a drop-down menu was used for the question on year of birth, we assume that in the Web questionnaire these respondents mistakenly chose an option next to their actual year of birth in this drop-down menu.
The cases (n=564) for which we assume the same respondents did both the Web and the telephone questionnaires are finally included in the analysis. For certain items the number of cases is actually somewhat lower and varies slightly due to some item non-response.
3.3
Impression Management Scale
As already said, in order to explore the influence of virtual personas on the social desirability of responses, items for the Impression Management Scale (IM scale) were replicated in the Web and the telephone survey and responses compared. This set of 20 items (see Figure 3) is a part of the Balanced Inventory of Desirable Responding (BIDR) scale (Paulhus, 1994; Robinson et al., 1991: 37-41) frequently used to measure social desirability bias. The construction of these items is based on the assumption that respondents systematically overreport their performance on a wide variety of desirable behavior and underreport undesirable behavior. Respondents rate their agreement with each statement on a seven-point scale. After reversing the negatively keyed items (marked with a (R) in Figure 3) one point is added for each extreme response (6 or 7). Hence, the total score on the IM scale can range from 0 to 20 with higher scores denoting more socially desirable responses. This scoring ensures that only subjects who give exaggeratedly desirable responses attain high scores.
Figure 3: Survey questions from the Impression Management Scale
(Robinson et al., 1991: 37-41).
Since there was some item non-response when respondents answered the IM scale items, we decided not only to simply count the extreme response but also to calculate the percentage of extreme responses among all given responses. In this way we do not lose those cases that did not answer some of the IM scale items. In addition, for every respondent we also calculate the average score across all items that he/she answered.
Please estimate to what extent the following statements apply to you. Please give your estimate on a scale of 1 to 7, 1 meaning “not at all true” and 7 meaning “completely true”.
not at all true partially true completely true
1 2 3 4 5 6 7
I sometimes tell lies if I have to (R). I never cover up my mistakes.
There have been occasions when I have taken advantage of someone (R). I never swear.
I sometimes try to get even rather than forgive and forget (R).
I always obey laws, even if I’m unlikely to get caught.
I have said something bad about a friend behind his or her back (R). When I hear people talking privately I avoid listening.
I have received too much change from a salesperson without telling him or her (R).
I always declare everything at customs. When I was young I sometimes stole things (R).
I have never dropped litter on the street.
I sometimes drive faster than the speed limit (R).
I never read sexy books or magazines. I have done things that I don’t tell other people about (R).
I never take things that don’t belong to me.
I have taken sick-leave from work or school even though I wasn’t really sick (R).
3.4
Description of the sample
Participants in this study are self-selected. They are Internet users who decided to participate in the national RIS 2001 Web survey after they had noticed banner ads for the survey on Slovenian Web sites. They were also very co-operative, since most provided their telephone number for further research.
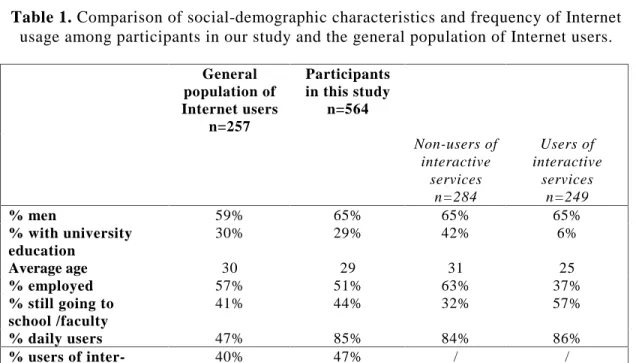
Nevertheless, they do not differ much from the general population of Internet users in Slovenia11
in terms of social-demographic characteristics (see Table 1). However, they differ significantly in the frequency of Internet usage. Participants in this study are intensive Internet users, mostly using the Internet every day. This presents a limitation to this study since results cannot be inferred to the general population of Internet users without caution.
Table 1. Comparison of social-demographic characteristics and frequency of Internet
usage among participants in our study and the general population of Internet users.
General population of Internet users n=257 Participants in this study n=564 Non-users of interactive services n=284 Users of interactive services n=249 % men 59% 65% 65% 65% % with university education 30% 29% 42% 6% Average age 30 29 31 25 % employed 57% 51% 63% 37% % still going to school /faculty 41% 44% 32% 57% % daily users 47% 85% 84% 86% % users of inter-active services 40% 47% / /
Participants in this study differ from the general population of Internet users also as regards their usage of interactive Internet services where virtual personas can be adopted. However this is an effect of the design with respect to the individual’s path through the questionnaire; all the users of interactive services in this Web survey were administered the questions from the IM scale, while only a random sample of non-users of interactive services was administered these same questions. This skews the ratio among the users and non-users of interactive services in the sample of respondents that are analyzed in this study. Therefore, 47% of the sample are users of interactive services (use at least one of the listed
11
Data for the general population of Internet users are taken from a telephone survey on a representative sample of Slovenian households (n=901). This survey was conducted in June 2001 (RIS, 1996-2002) and 257 Internet users were interviewed.
services – IRC; MUD, MOO systems; interactive games – at least few times a month) compared to 40% in the general population of Internet users.
This skew in comparison to the general population of Internet users is of minor importance in our case since we explicitly distinguish among users and non-users of interactive services. Table 1 presents also the difference in social-demographic characteristics of users and non-users of interactive services in our sample. It is clearly seen that users of interactive services are younger, more often still involved in formal education and therefore with lower levels of formal education.
3.5
Hypotheses and analysis
Two groups of respondents, e.g., users and non-users of interactive services will be compared in two survey settings, i.e. in the Web and the telephone survey. More precisely, their answers to items from the IM scale will be compared.
We expect responses in the Web survey to be less socially desirable than responses in the telephone survey, regardless of the use of interactive services (hypothesis 1). We believe that this happens mostly because of the interviewer presence in the telephone survey. As already said, it has already been shown that interviewer-administered surveys suffer from larger desirability bias than self-administered surveys (de Leeuw, 1992: 205; Dillman, 1983: 374; 1991: 243; Groves, 1990: 227; Lyberg & Kasprzyk, 1991; Tourangeau & Smith, 1996).
When comparing Web and telephone responses, there may be another influence on the difference in responses, i.e. the difference in the visual Web mode and the oral telephone mode. During the visual presentation of survey answers the first answers on the list are more cognitively processed and therefore more likely to be selected (primacy effect). However, since in self-administered surveys the respondent has usually enough time to carefully read all the answers, this effect might be of minor importance. During the oral presentation, on the other hand, the last heard answers are more remembered, more cognitively processed and therefore more likely to be selected (recency effect) (de Leeuw, 1992; 68-69; Schwarz et al., 1992). In our case, for the IM scale items responses with the lowest values meaning “not true” are heard or seen the first and responses with the highest values meaning “true” heard or seen the last. However, since half of the items are reversed (see Section 3.3), for half of the items the highest values and for the other half the lowest values mean socially desirable responses. Therefore, if there is some primacy and/or recency effect, its effect on the overall score across all 20 items is nullified. For our study we can therefore assume that the possible differences between the Web and the telephone responses are due to the (lack of) interviewer presence and not the difference in the visual and oral way of presenting survey items. The differences are presented in Section 4.1.
Our second hypothesis regards the impact of the use of interactive services. We expect the users of interactive services that enable the adoption of virtual
personas to continue playing their possible virtual roles from the interactive services also in the Web survey but not in the off-line world, i.e. in the telephone survey. In other words, the users of interactive services will be more likely to present themselves in a different light on the Web than on the telephone, relative to the non-user groups (hypothesis 2). Specifically, because users often adopt virtual personas in order to present themselves more favorably, we expect higher levels of socially desirable responding on the Web among this group than among non-users of interactive services. The second hypothesis will be tested in two alternative ways (see Figure 4).
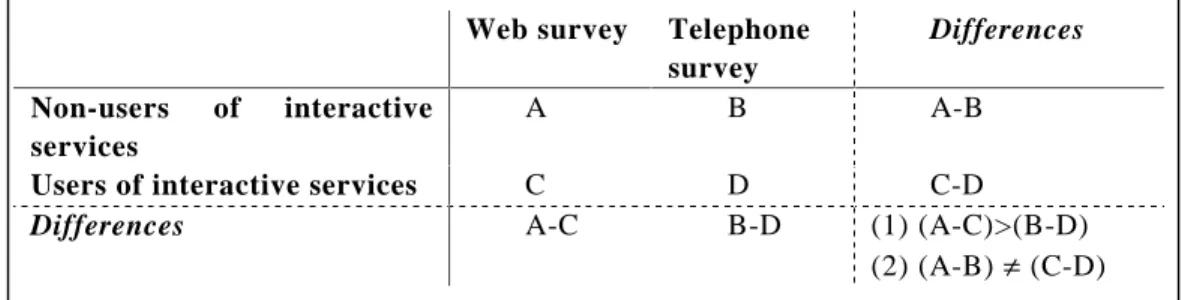
Figure 4: Graphical presentation of hypothesis testing.
First, the users and non-users of interactive services will be compared separately in the Web (A, C) and the telephone survey (B, D) (Section 4.2.1). The difference between the users and non-users from the Web survey (A-C) is expected to be larger than the difference between these two groups (B-D) in the telephone survey. We expect the difference in the Web survey to be larger due to different behavior of users on the Web, as a consequence of their behavior in the other interactive activities on the Internet.
Secondly, responses from the Web and the telephone survey will be compared separately for the users and non-users of interactive services (Section 4.2.2). We expect the difference between the two survey responses for the non-users (A-B) to be different from the difference between the two survey responses for the users (C-D). We expect the users of interactive services to continue playing their virtual roles, and we expect such roles to have more socially desirable characteristics than their real selves. In this case the responses of the users in the Web survey will be more socially desirable than responses of the non-users. This would result in a smaller difference between the Web and the telephone responses for the users than for the non-users ((A-B)>(C-D)), given that telephone responses are more subject to social desirability (see hypothesis 1). An alternative hypothesis is that that because of the lack of personal contacts on the Web, users of interactive services may be more inclined to openly admit their negative characteristics or even invent less desirable characteristics. In this case the responses of users of interactive services may show less social desirability than those on non-users.
Web survey Telephone survey
Differences
Non-users of interactive services
A B A-B
Users of interactive services C D C-D
Differences A-C B-D (1) (A-C)>(B-D)
The quality of measurement by mode and the user/non-user group is tested not only by looking at the social desirability of responses, but also by checking the reliability of measurement by calculating the Cronbach’s coefficient alpha12 for the two groups in both survey settings (Section 4.3). If users of interactive services are behaving differently in the Web survey (retaining their virtual personas) than the reliability of measurement and hence the quality of the data should be lower for this group.
4
Results
4.1
Difference in Web and telephone answers
First, we present the difference in respondents’ answers to the items from the IM scale in the Web and the telephone survey, regardless of their use of interactive services. Overall, we expect more socially desirable answers in the telephone survey due to the presence of interviewers in this mode. The absence of interviewer presence in the Web survey reduces the respondents' need to present them in a better light.
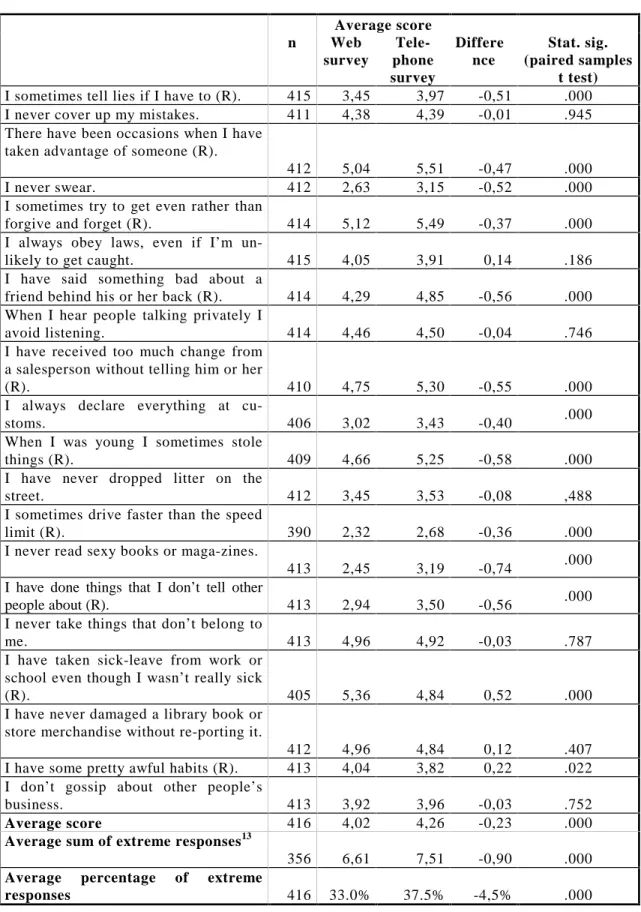
Table 2 presents the average scores on the 7-point scale for each of the 20 items from the IM scale for the Web and the telephone survey. The negatively keyed items were reversed prior to this calculation. Paired sample t tests are used to test the statistical significance of the difference in the average scores between the two modes. Significant differences (p< 0.05) are found for 13 of the 20 items (65%). In most of these cases (except two) the average score is higher in the telephone survey. Also for the non-significant differences the direction of the differences is the same, i.e. higher scores in the telephone survey.
Similar results are found when the overall IM scale scores are compared (either the average score, the sum or the percentage of extreme responses (6 or 7) across all 20 items for each respondent). All three overall measures are significantly higher – therefore showing larger social desirability bias – in the telephone survey (see the last three rows in Table 2). For example, in the Web survey, respondents gave socially desirable answers to 6.6 items on average, while in the telephone survey they gave socially desirable answers to an average of 7.5 items.
These results support the hypothesis of larger social desirability effects in the telephone survey. Due to interviewer presence respondents tended to give more socially desirable responses in the telephone survey in comparison to the Web survey where they completed the questionnaire by themselves.
12
Cronbach’s coefficient alpha is used as a measure of internal consistency, thus as a measure of scale reliability (DeVellis, 1991: 25). The variability in a set of item scores is due to one of the two things: (1) the actual variation across individuals in the phenomenon that the scale measures (i.e. true variation in the latent variable) and (2) the error. The Alpha coefficient is the proportion of the actual variation among the total variation in a set of item scores.
Table 2: Difference in answers in the Web and the telephone survey. Average score n Web survey Tele-phone survey Differe nce Stat. sig. (paired samples t test) I sometimes tell lies if I have to (R). 415 3,45 3,97 -0,51 .000 I never cover up my mistakes. 411 4,38 4,39 -0,01 .945 There have been occasions when I have
taken advantage of someone (R).
412 5,04 5,51 -0,47 .000
I never swear. 412 2,63 3,15 -0,52 .000
I sometimes try to get even rather than
forgive and forget (R). 414 5,12 5,49 -0,37 .000
I always obey laws, even if I’m
un-likely to get caught. 415 4,05 3,91 0,14 .186
I have said something bad about a
friend behind his or her back (R). 414 4,29 4,85 -0,56 .000 When I hear people talking privately I
avoid listening. 414 4,46 4,50 -0,04 .746
I have received too much change from a salesperson without telling him or her
(R). 410 4,75 5,30 -0,55 .000
I always declare everything at
cu-stoms. 406 3,02 3,43 -0,40 .000
When I was young I sometimes stole
things (R). 409 4,66 5,25 -0,58 .000
I have never dropped litter on the
street. 412 3,45 3,53 -0,08 ,488
I sometimes drive faster than the speed
limit (R). 390 2,32 2,68 -0,36 .000
I never read sexy books or maga-zines.
413 2,45 3,19 -0,74 .000
I have done things that I don’t tell other
people about (R). 413 2,94 3,50 -0,56 .000
I never take things that don’t belong to
me. 413 4,96 4,92 -0,03 .787
I have taken sick-leave from work or school even though I wasn’t really sick
(R). 405 5,36 4,84 0,52 .000
I have never damaged a library book or store merchandise without re-porting it.
412 4,96 4,84 0,12 .407
I have some pretty awful habits (R). 413 4,04 3,82 0,22 .022 I don’t gossip about other people’s
business. 413 3,92 3,96 -0,03 .752
Average score 416 4,02 4,26 -0,23 .000
Average sum of extreme responses13
356 6,61 7,51 -0,90 .000
Average percentage of extreme
responses 416 33.0% 37.5% -4,5% .000
13
4.2
Effect of interactive activities on survey answers
In this section we go beyond the simple exploration of social desirability bias in Web surveys. We explore whether there is any effect of the use of interactive Internet services on socially desirable responding. For this purpose we distinguish among users and non-users of interactive services where virtual personas can be adopted. As already said, we define users of interactive services as those respondents who use either IRC, MUD and MOO systems or interactive games at least few times a month. Non-users of interactive services are defined as those respondents who use all of these services less than once a month.
The alternative classification of participants with respect to their usage of interactive services has also been performed using k-means cluster method. Using this method we similarly found two groups of participants, users and non-users of interactive services. Classifying into more than two groups results in splitting the group of users into more and less intensive users. Comparison of responses to IM scale in these groups gives similar results as those obtained by using the two groups defined above. We therefore decided to present the simplest classification of participants and to compare their social desirability bias.
We first present the test of differences between the users and the non-users of interactive services within the Web and the telephone surveys separately (Section 4.2.1). Since both groups of respondents also differ in socio-demographic characteristics (see Section 3.4), this comparison is rather limited. Differences between users and non-users could be explained by socio-demographic differences between the two groups. Therefore, we also present the differences between the users of interactive services in the Web and the telephone survey, and the differences between the non-users of interactive services in the Web and the telephone survey (Section 4.2.2).
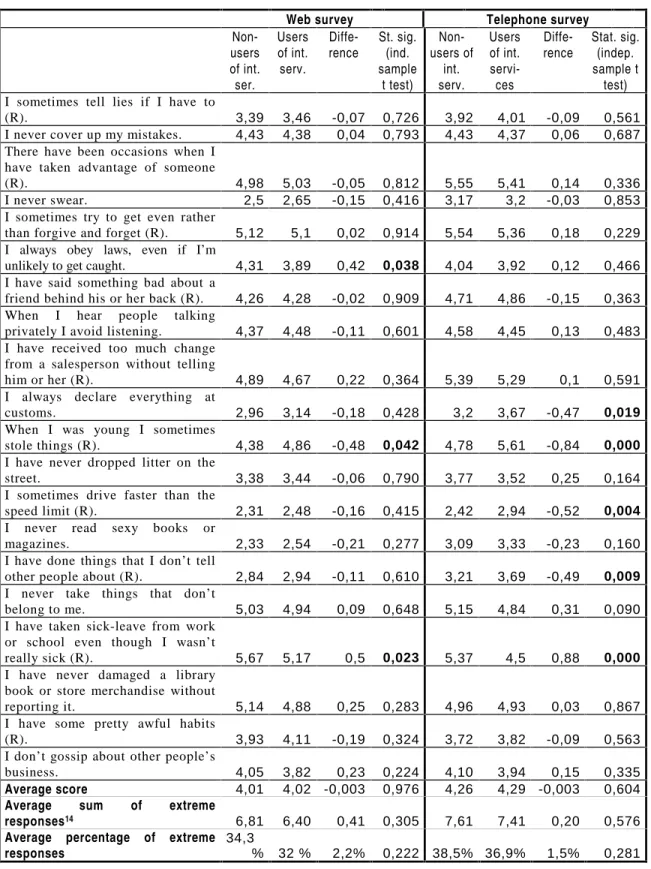
4.2.1 Users and non-users of interactive services within individual surveys We first present the impact of the use of interactive services on survey answers to the IM scale in the Web survey and the telephone survey separately. Within each survey, the average value for each IM item for the two groups of participants is presented and the differences tested (using independent sample t tests) in Table 3. Overall average score and sum of extreme responses are also compared.
For the Web survey, the comparison of average scores on the IM scale items shows that there are only minimal differences among users and non-users of interactive services. The difference is actually statistically significant (at p<0.05) for only three of the items (see the first part of Table 3). For two of these items more socially desirable answers are actually given by the non-users of interactive services, and, for the other item, more socially desirable answers are given by the users of interactive services.
Similarly, the comparison of the overall measures (the last three rows in Table 3) shows no differences between the two groups of respondents. For example, if we compare overall extreme responses, which really show socially desirable behavior as suggested by the authors of the IM scale (see Section 3.3), there are no statistically significant differences between the two groups of respondents. The non-users of interactive services gave socially desirable answers on average for 6.8 of the items while the users of the interactive services did so for 6.4 of the items (the difference is not statistically significant, p=0.305). Thus, we do not find support for our hypothesis that in the Web survey the users of interactive services would behave differently than the non-users. Although they give somewhat less socially desirable responses, the differences are not statistically significant.
In the telephone survey, the differences in average scores on the IM scale items between the non-users and the users of the interactive services occur somewhat more often, but are still relatively rare. The difference is statistically significant (at p<0.05) for five of the items (see the second part of Table 3). For four of these items more socially desirable answers are given by the users of interactive services. For one of the items, on the other hand, more socially desirable answers are given by the non-users of interactive services. For all the other items the differences are not statistically significant.
The comparison of overall measures across all 20 items (see the last three rows in Table 3) shows no statistically significant difference in socially desirable responding between the non-users and users of interactive services while answering the IM scale in the telephone survey, as was found in the Web survey.
The lack of differences in behavior of users versus non-users of interactive services as regards the IM scale within individual survey settings might suggest that our hypothesis of the impact of interactive services on survey behavior is not correct. However, as already noted, this comparison is rather limited due to socio-demographic differences between the two groups. Therefore weighting in order to make the both groups similar in social-demographic characteristics was tested. However, the results do not change significantly after this correction. Therefore, these results are not presented here. Instead, an alternative way of testing the hypothesis regarding the impact of interactive services is presented in the next section.
4.2.2 Web and telephone responses for individual groups
In this section we present another comparison, i.e. the comparison of Web and telephone answers for the non-users and the users of the interactive services separately. As already said, we expect the difference between the answers from the two surveys to be different for the non-users than for the users of the interactive services.
Table 3: Average values and test for differences for the items from the IM scale in Web
survey and the telephone survey.
Web survey Telephone survey
Non-users of int. ser. Users of int. serv.
Diffe-rence St. sig.(ind. sample t test) Non-users of int. serv. Users of int. servi-ces
Diffe-rence Stat. sig.(indep. sample t test)
I sometimes tell lies if I have to
(R). 3,39 3,46 -0,07 0,726 3,92 4,01 -0,09 0,561
I never cover up my mistakes. 4,43 4,38 0,04 0,793 4,43 4,37 0,06 0,687
There have been occasions when I have taken advantage of someone
(R). 4,98 5,03 -0,05 0,812 5,55 5,41 0,14 0,336
I never swear. 2,5 2,65 -0,15 0,416 3,17 3,2 -0,03 0,853
I sometimes try to get even rather
than forgive and forget (R). 5,12 5,1 0,02 0,914 5,54 5,36 0,18 0,229
I always obey laws, even if I’m
unlikely to get caught. 4,31 3,89 0,42 0,038 4,04 3,92 0,12 0,466
I have said something bad about a
friend behind his or her back (R). 4,26 4,28 -0,02 0,909 4,71 4,86 -0,15 0,363
When I hear people talking
privately I avoid listening. 4,37 4,48 -0,11 0,601 4,58 4,45 0,13 0,483
I have received too much change from a salesperson without telling
him or her (R). 4,89 4,67 0,22 0,364 5,39 5,29 0,1 0,591
I always declare everything at
customs. 2,96 3,14 -0,18 0,428 3,2 3,67 -0,47 0,019
When I was young I sometimes
stole things (R). 4,38 4,86 -0,48 0,042 4,78 5,61 -0,84 0,000
I have never dropped litter on the
street. 3,38 3,44 -0,06 0,790 3,77 3,52 0,25 0,164
I sometimes drive faster than the
speed limit (R). 2,31 2,48 -0,16 0,415 2,42 2,94 -0,52 0,004
I never read sexy books or
magazines. 2,33 2,54 -0,21 0,277 3,09 3,33 -0,23 0,160
I have done things that I don’t tell
other people about (R). 2,84 2,94 -0,11 0,610 3,21 3,69 -0,49 0,009
I never take things that don’t
belong to me. 5,03 4,94 0,09 0,648 5,15 4,84 0,31 0,090
I have taken sick-leave from work or school even though I wasn’t
really sick (R). 5,67 5,17 0,5 0,023 5,37 4,5 0,88 0,000
I have never damaged a library book or store merchandise without
reporting it. 5,14 4,88 0,25 0,283 4,96 4,93 0,03 0,867
I have some pretty awful habits
(R). 3,93 4,11 -0,19 0,324 3,72 3,82 -0,09 0,563
I don’t gossip about other people’s
business. 4,05 3,82 0,23 0,224 4,10 3,94 0,15 0,335
Average score 4,01 4,02 -0,003 0,976 4,26 4,29 -0,003 0,604
Average sum of extreme
responses14 6,81 6,40 0,41 0,305 7,61 7,41 0,20 0,576
Average percentage of extreme
responses 34,3% 32 % 2,2% 0,222 38,5% 36,9% 1,5% 0,281
14
Table 4: Average values and test for differences for the items from the IM scale for
non-users and non-users of interactive services. Non-users of
interactive services Users of interactiveservices
Web sur-vey Pho-ne surv-ey
Diffe-rence St. sig.(paired sample s t test) Web sur-vey Tele-phone survey Differe
nce Stat.sig(paired sample s t test)
I sometimes tell lies if I have to (R). 3,39 3,88 -0,48 0,003 3,46 4,02 -0,56 0,000
I never cover up my mistakes. 4,43 4,43 -0,01 0,968 4,38 4,38 0,01 0,953
There have been occasions when I have
taken advantage of someone (R). 4,98 5,6 -0,62 0,000 5,03 5,42 -0,39 0,002
I never swear. 2,5 3,12 -0,62 0,000 2,65 3,19 -0,53 0,000
I sometimes try to get even rather than
forgive and forget (R). 5,12 5,65 -0,52 0,000 5,1 5,35 -0,25 0,051
I always obey laws, even if I’m unlikely to get
caught. 4,31 3,92 0,38 0,042 3,89 3,91 -0,02 0,855
I have said something bad about a friend
behind his or her back (R). 4,26 4,76 -0,5 0,002 4,28 4,87 -0,59 0,000
When I hear people talking privately I
avoid listening. 4,37 4,53 -0,16 0,425 4,48 4,46 0,02 0,919
I have received too much change from a salesperson without telling him or her
(R). 4,88 5,35 -0,47 0,016 4,67 5,28 -0,61 0,000
I always declare everything at customs. 2,97 3,05 -0,08 0,649 3,08 3,69 -0,6 0,000
When I was young I sometimes stole
things (R). 4,37 4,82 -0,45 0,009 4,85 5,61 -0,76 0,000
I have never dropped litter on the street. 3,38 3,5 -0,12 0,546 3,44 3,55 -0,1 0,516
I sometimes drive faster than the speed
limit (R). 2,24 2,45 -0,22 0,189 2,34 2,87 -0,53 0,000
I never read sexy books or magazines. 2,33 3,02 -0,69 0,000 2,54 3,33 -0,78 0,000
I have done things that I don’t tell other
people about (R). 2,84 3,18 -0,34 0,071 2,94 3,72 -0,78 0,000
I never take things that don’t belong to
me. 5,03 5,03 0 1 4,94 4,84 0,1 0,543
I have taken sick-leave from work or school even though I wasn’t really sick
(R). 5,67 5,31 0,36 0,036 5,15 4,51 0,64 0,000
I have never damaged a library book or
store mer-chandise without reporting it. 5,14 4,66 0,48 0,049 4,87 4,96 -0,09 0,615 I HAVE SOME PRETTY AWFUL
HABITS (R).
3,93 3,75 0,18 0,296 4,11 3,83 0,28 0,018
I don’t gossip about other people’s
business. 4,05 3,99 0,07 0,720 3,82 3,94 -0,12 0,354
Average score 4,01 4,20 -0,19 0,001 4,02 4,29 -0,27 0,000
Average sum of extreme responses15 6,81 7,61 -0,80 0,002 6,40 7,41 -1,00 0,000 Average percentage of extreme respo-nses 34,3 38,5 -4,2 0,001 32,0 36,9 -4,9 0,000
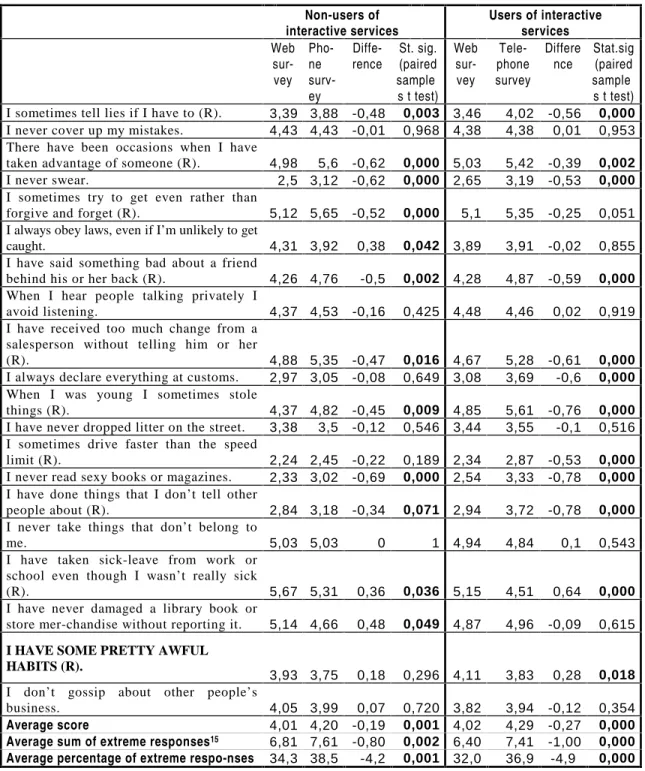
The answers from the two surveys are presented separately for the non-users and the users of interactive services in Table 4. Within each group for each item from the IM scale the average value from the two surveys is presented and the differences tested (using paired sample t tests). Overall average scores, sums and percentages of extreme responses are also compared.
15
For the non-users of interactive services (see the first part of Table 4) the differences from the two surveys are statistically significant (at p< 0.05) in 12 out of 20 items (60%). In almost all of these cases (except three) the answers from the telephone survey are more socially desirable. In addition, the overall scores (the last three rows in Table 4) show more socially desirable answers in the telephone survey. For example, the non-users of interactive services gave socially desirable responses for an average of 6.8 of the items in the Web survey and 7.6 of the items in the telephone survey (the difference is statistically significant at p=0.002). The result is expected since we already showed that telephone responses suffer from larger social desirability bias due to interviewer presence.
For the users of interactive services (see the second part of Table 4), the differences between the two surveys are also statistically significant (at p< 0.05) in 12 out of 20 items (60%). Again, in almost all of these cases (except two), the answers from the telephone survey are more socially desirable. Again, the overall scores (the last three rows in Table 4) show more socially desirable answers in the telephone survey. For example, the users of interactive services gave socially desirable responses for an average of 6.4 of the items in the Web survey and 7.4 of the items in the telephone survey (the difference is statistically significant at p<0.005). Again, the result is expected, given the larger social desirability effects in the telephone survey.
4.2.3 Overview of overall scores
In this section we review the results regarding the hypothesis whether differences among the groups of participants are larger in the Web survey than in the telephone survey ((A-C)>(B-D)), or alternatively, whether differences among the responses from the two surveys are different for the users than for the non-users of the interactive services ((A-B) ≠ (C-D)). In the Web survey respondents might still play their virtual role while answering the survey questionnaire, and they might stop playing this role while answering the telephone survey questionnaire. In such a case the differences between the users and the non-users of the interactive services should be larger in the Web survey while smaller in the telephone survey. Or alternatively, the differences between responses from the two surveys should be different for the users than for the non-users of interactive services.
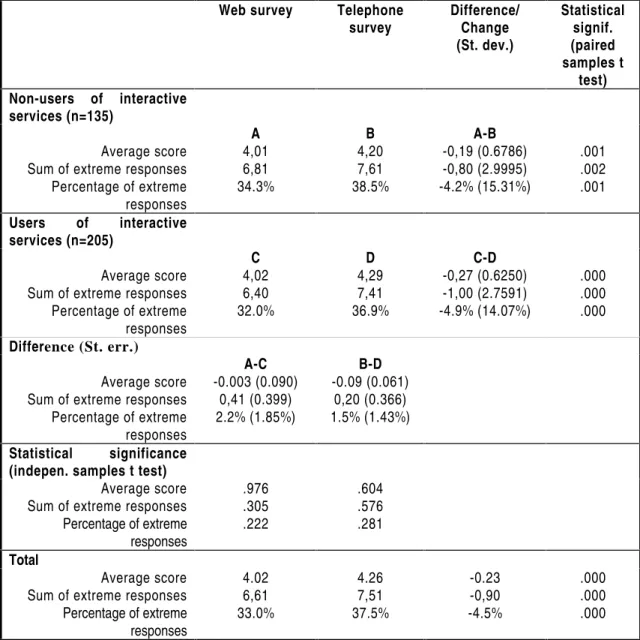
In order to test this hypothesis the overall scores – overall average, sum and percentage of extreme responses across all IM items – for each group of participants for each survey are presented in Table 5.
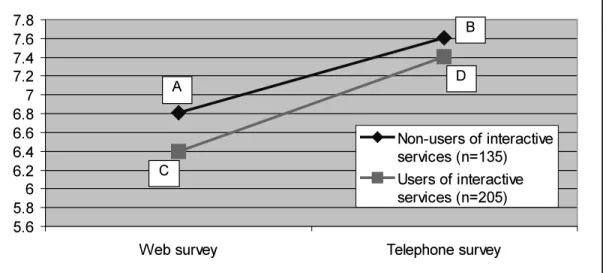
We present the findings regarding the sum of extreme responses also graphically in Figure 5. There, we ordered the categorical variable ‘survey mode’ from less social desirable (i.e. Web) to more desirable (i.e. telephone). It is clearly seen that we can confirm our first hypothesis: the social desirability of answers in the interviewer-administered telephone survey is larger than in the
self-administered Web survey, due to interviewer presence in the first case. This effect is noticeable for all respondents, regardless of their usage of interactive services.
As seen in Table 5, the differences between the Web and the telephone survey responses – for all participants in the study and for both groups separately – are actually the only statistically significant differences. Thus, we cannot confirm our second hypothesis on the impact of usage of interactive services on survey responses. We discuss this more in detail below.
Table 5: Overall scores across items and significance tests.
Web survey Telephone
survey Difference/Change
(St. dev.) Statistical signif. (paired samples t test) Non-users of interactive services (n=135) Average score Sum of extreme responses Percentage of extreme responses A 4,01 6,81 34.3% B 4,20 7,61 38.5% A-B -0,19 (0.6786) -0,80 (2.9995) -4.2% (15.31%) .001 .002 .001 Users of interactive services (n=205) Average score Sum of extreme responses Percentage of extreme responses C 4,02 6,40 32.0% D 4,29 7,41 36.9% C-D -0,27 (0.6250) -1,00 (2.7591) -4.9% (14.07%) .000 .000 .000 Difference (St. err.)
Average score Sum of extreme responses Percentage of extreme responses A-C -0.003 (0.090) 0,41 (0.399) 2.2% (1.85%) B-D -0.09 (0.061) 0,20 (0.366) 1.5% (1.43%) Statistical significance
(indepen. samples t test) Average score Sum of extreme responses Percentage of extreme responses .976 .305 .222 .604 .576 .281 Total Average score Sum of extreme responses Percentage of extreme responses 4.02 6,61 33.0% 4.26 7,51 37.5% -0.23 -0,90 -4.5% .000 .000 .000
Comparing the users and the non-users of interactive services within individual survey settings, we find little support for the hypothesis of the impact of the usage of interactive services. If we look at the sum of extreme responses, the non-users give somewhat more socially desirable responses in both surveys, although neither of the differences – the difference in the Web (A-C) and the difference in the telephone survey setting (B-D) – between the users and non-users of interactive services is statistically significant (p=0.305 for the Web survey and p=0.576 for the telephone survey). We can observe that the difference between the non-users (A) and the users (C) of the interactive services is slightly larger in the Web (users gave on average 0.41 more socially desirable responses than non-users) than in the telephone survey (where the difference (B-D) is 0.20), although the decrease in the difference (from 0.41 to 0.20) is not statistically significant (p=0.394). A similar result is found if the percentage of extreme responses is considered (the decrease in the differences from 2.2% to 1.5% is not statistically significant, p=0.417). When the average score is taken into account, we find a slight increase in the difference from Web to the telephone survey ((A-C)<(B-D)), however both differences are actually very close to zero and the increase is again not statistically significant (p=0.281). These results provide only modest support at best for the hypothesis that users of interactive services would behave differently in the Web survey setting. :HEVXUYH\ 7HOHSKRQHVXUYH\ 1RQXVHUVRILQWHUDFWLYH VHUYLFHVQ 8VHUVRILQWHUDFWLYH VHUYLFHVQ $ ' & %
Figure 5: Differences between users and non-users of interactive services in the Web
and the telephone survey – sum of extreme responses presented.
We can analyze the impact of the use of interactive services on survey responses also in another way, i.e. by comparing the Web and the telephone responses of users and non-users of interactive services separately. Both give more socially desirable responses in the telephone survey. The difference in social
desirability from the Web and the telephone survey is somewhat larger for the users of interactive services ((A-B) < (C-D)). For example, the non-users of the interactive services gave on average 0.8 more socially desirable responses in the telephone than in the Web survey. The users of the interactive services, on the other hand, gave on average 1.0 more socially desirable response in the telephone than in the Web survey. However, the increase in difference (from 0.8 to 1.0) is not statistically significant (p=0.268). A similar result is found if the average score (p=0.121) or the percentage of extreme responses (p=0.326) is taken into account. Thus we find no support for our hypothesis that the difference would be different for the users of interactive services because of their different behavior in the Web survey.
4.3
Reliability of measurement
In addition to social desirability bias, the reliability of measurement is another indicator of the quality of the survey responses obtained. Cronbach’s coefficient alpha for the IM scale items (see Section 3.5) for each of the groups for each of the surveys is presented in Table 6.
Table 6: Cronbach’s coefficient alpha for the IM scale items. Web survey Telephone survey Non-users of inter-active services 0.7816 0.6299
Users of interactive services 0.7900 0.6517
Total 0.7852 0.6408
The average scores for these IM scale items reported in the literature range from 4.3 to 11.2 and Cronbach’s coefficient alpha measuring internal consistency range from 0.75 to 0.83, depending on the type of population surveyed (Robinson et al., 1991: 37-39). In our case the Cronbach’s alpha coefficients from the Web survey are consistent with those reported in the literature. However, in the telephone survey, these coefficients are lower, indicating lower reliability of measurement in the telephone survey. This might suggest that in the Web survey respondents took more time to carefully read and answer the IM scale items. On the other hand, they were under more time pressure and had lower ability to appropriately cognitively process the items read by the interviewer in the telephone survey. This might also explain the larger social desirability of answers in the telephone survey (in addition to the interviewer effect) given the time pressure and reduced ability to process each question, respondents were possibly more likely to answer with a socially desirable response than with a true response for themselves.
With regard to the difference between the users and the non-users of interactive services, the differences in reliability are minimal. In both surveys,
users of interactive services have slightly larger alpha coefficients than the non-users. This contradicts our hypothesis that the users would give less reliable responses due to the persistence of alternative personas during the completion of the Web survey. For the Web survey this result might be the consequence of the larger experience with the Web technology in general for the users of interactive services. And in both cases, for the telephone and the Web survey, this result might be affected by the differences in social-demographic characteristics between the two groups of respondents. As shown earlier (see Section 3.4) users are younger and therefore possibly answering the IM scale items was somewhat easier for them.
5 Conclusions
In our analysis we studied the interaction between the respondent’s involvement in the interactive Internet services (i.e. MUD, MOO systems, IRC and interactive games) and his/her behavior while answering a Web questionnaire. With this study we wanted to explore a potential concern with respect to the quality of data in Web surveys. Web surveys are often uncritically treated as completely equivalent method to other self-administered questionnaires (such as traditional mail surveys) with respect to their influence on respondents’ answers (for example, Dillman, 2000). However, the Internet is a fundamentally different medium because of its graphic and interactive nature. Behavior in interactive services where alternative realities – which differ radically from offline realities – are developed may interact with the behavior in other Internet activities, such as answering survey questionnaires on the Internet.
The present study concentrated only on one specific aspect of the data quality in Web surveys, i.e. on the social desirability of answers. We showed that socially desirable responding is lower on the Web than in a telephone survey. Of course, this finding is not very surprising, as similar results have been found for other self-administered questionnaires (de Leeuw, 1992: 205; Dillman, 1983: 374; 1991: 243; Groves, 1990: 227; Lyberg & Kasprzyk, 1991; Tourangeau & Smith, 1996). Similarly, the reliability of measurement is larger in the Web survey. On the other hand, we did not find that there is an impact of the usage of interactive services such as MUD and MOO systems, interactive chat and interactive games, on behavior in another interactive activity, i.e. when answering a Web survey questionnaire. Although we found some evidence that users of interactive services may behave somewhat differently (giving less socially desirable answers) than non-users in the Web survey, the impact was not large enough to be statistically significant.
One explanation of our findings is that the experience of using interactive services (such as MUD and MOO systems, interactive chat and interactive games)
where virtual personas are adopted has little or no influence on the behavior in another interactive activity, i.e. on the participation in a Web survey. In this case we would conclude that Web surveys – despite therich graphics and interactive nature of the World Wide Web – could obtain responses of equal quality in terms of social desirability bias as other self-administered surveys (such as mail surveys).
Another possible explanation for the results we obtained lies in the limitations of our study. In particular, we had no direct measure of respondents’ experience with adopting virtual personas, neither of their possible persistence with these virtual personas when answering the Web questionnaire.
Future research on this topic is therefore worth considering. Some more direct measures of behavior in terms of adopting virtual personas on the Internet might be used. The study, however, contributes to the debate on the quality of data in Web surveys and goes beyond traditional research on social desirability since it takes into account the special interactive nature of the Internet.
References
[1] Bartle, R.A. (1999): Interactive Multi-user Computer Games. [July 26, 2002],
http://www.mud.co.uk/richard/imucg.htm
[2] Bechar-Israeli, H. (1995): FROM <Bonehead> TO <cLoNehEAd>: Nicknames, play and identity on Internet relay chat. Journal of Computer Mediated Communication, 1. [July 23, 2001]
http://www.ascusc.org/jcmc/vol1/issue2/bechar.html
[3] Bruckman, A. S. (1993): Gender swapping on the Internet. Paper Presented at The Internet Society Conference, San Francisco, CA, August 1993.
[4] Coomber, R. (1997): Using the Internet for survey research. Sociological Research Online, 2. [November 26, 2001]
http://www.socresonline.org.uk/2/2/2.html
[5] Couper, M.P., Traugott, M., and Lamias, M. (2001): Web survey design and administration. Public Opinion Quarterly, 65, 230-253.
[6] Curtis, P. (1992): Mudding: Social phenomena in text-based virtual realities. Proceedings of the 1992 Conference on the Directions and Implications of Advanced Computing. [July 26, 2002].
http://www.cpsr.org/cpsr/sociology/mud_moo/DIAC92.txt.
[7] de Leeuw, E.D. (1992): Data Quality in Mail, Telephone and Face-to-Face Surveys. Amsterdam: TT-Publikaties.
[8] DeVellis, R. (1991): Scale Development. Theory and Applications. Newbery Park: Sage Publications.