Peer-review status of attached le:
Peer-reviewed
Citation for published item:
Ghasemi, Golara and Noorollahi, Younes and Alavi, Hamed and Marzband, Mousa and Shahbazi, Mahmoud (2019) 'Theoretical and technical potential evaluation of solar power generation in Iran.', Renewable energy., 138 . pp. 1250-1261.
Further information on publisher's website:
https://doi.org/10.1016/j.renene.2019.02.068Publisher's copyright statement: c
2019 This manuscript version is made available under the CC-BY-NC-ND 4.0 license
http://creativecommons.org/licenses/by-nc-nd/4.0/
Use policy
The full-text may be used and/or reproduced, and given to third parties in any format or medium, without prior permission or charge, for personal research or study, educational, or not-for-prot purposes provided that:
• a full bibliographic reference is made to the original source
• alinkis made to the metadata record in DRO
• the full-text is not changed in any way
The full-text must not be sold in any format or medium without the formal permission of the copyright holders. Please consult thefull DRO policyfor further details.
Accepted Manuscript
Theoretical and technical potential evaluation of solar power generation in Iran Golara Ghasemi, Younes Noorollahi, Hamed Alavi, Mousa Marzband, Mahmoud Shahbazi
PII: S0960-1481(19)30222-8
DOI: https://doi.org/10.1016/j.renene.2019.02.068
Reference: RENE 11200 To appear in: Renewable Energy
Received Date: 23 October 2018 Revised Date: 11 February 2019 Accepted Date: 13 February 2019
Please cite this article as: Ghasemi G, Noorollahi Y, Alavi H, Marzband M, Shahbazi M, Theoretical and technical potential evaluation of solar power generation in Iran, Renewable Energy (2019), doi: https:// doi.org/10.1016/j.renene.2019.02.068.
This is a PDF file of an unedited manuscript that has been accepted for publication. As a service to our customers we are providing this early version of the manuscript. The manuscript will undergo copyediting, typesetting, and review of the resulting proof before it is published in its final form. Please note that during the production process errors may be discovered which could affect the content, and all legal disclaimers that apply to the journal pertain.
M
AN
US
CR
IP
T
AC
CE
PT
ED
Theoretical and Technical Potential Evaluation of Solar
Power Generation in Iran
Golara Ghasemia, Younes Noorollahia,b, Hamed Alavic, Mousa Marzbandd,e, Mahmoud Shahbazif
aDept. of Renewable Energy and Environmental Eng., Faculty of New Sciences and Technologies, University
of Tehran, Tehran, Iran
bInstitute for planning, Dept. of Energy Planning, Aalborg University, Aalborg,Denmark
cDept. of Electrical Engineering, South Tehran Branch, Islamic Azad University, Tehran, Iran
dFaculty of Engineering and Environment, Dept. of Maths, Physics and Electrical Engineering,
Northumbria University Newcastle, Newcastle upon Tyne NE1 8ST, UK
eDept. of Electrical Engineering, Lahijan Branch, Islamic Azad University, Lahijan, Iran
fDept. of Engineering, Durham University, Durham, UK
Abstract
Nowadays, utilizing solar energy for power production at high efficiency and in a cost-effective status is a challenging issue for power plant engineers. This challenge would be answered by considering several affecting parameterssuch as technical, economic, and environmental criteria. In this investigation, in order to provide an assessment for implementing solar power plants in the southeast of Iran, Sis-tan and BaluchisSis-tanprovince, a multi-criteria decision making (MCDM) approach
islinked to a geographic information system (GIS). The MCDM approach is used to appraise the effective criteria for implementing solar power plants. The envi-ronment, orography, economic and climate are selected as the important criteria. Each criterion is assessed for the defined location of the investigation (Sistan and Baluchistan province) and in addition, GIS is employed to provide a geographical-graphical valuation to determine the most appropriate place for installing a large-scale solar power production plant.The solar systems considered in this study are
photovoltaic (PV) collectors and concentrated solar power (CSP) generation plants (e.g. solar trough collectors). Technical andtheoretical valuationsare made to specify the amount of solar power which can be harnessed in Sistan and
M
AN
US
CR
IP
T
AC
CE
PT
ED
ACCEPTED MANUSCRIPT
tan. In overall, it is demonstrated that this specific location in the southeast of Iran has the technical potential to provide 7,419 TWh/y and 8,758 TWh/y of solar electricity by installing CSP and PV technologies, respectively.
Keywords: Multi-criteria decision making; Potential study; Solar power
generation; Geographic information system.
1. Introduction 1
Recently, due to the advantage of renewable energy technologies, increasing
2
the cost of fossil fuels and its globalwarmingeffect, the use of distributedenergy
3
sources has been growing[1–4]. Moreover, accessibility to electric power results in
4
social, economic, and technological advances. In the recent decade, the thermal
5
energy demand has increased considerably because of the urbanization, changes in
6
lifestyles and consumption patterns[5]. On the other hand, due to environmental
7
concerns, the use of renewable energies has received more attention. Many
po-8
tential siting studies about renewable energy have been done previously such as,
9
wind energy [6], geothermal energy [7–9], biomass [10]and solar energy [11]
10
that were conducted using GIS. Amongst different sources of renewable energies,
11
solar energy is widely available throughout the world. Therefore, it can contribute
12
significantly to reducing the dependence on imported energy sources forenergy
13
importing countries[12].
14
In order to utilize the solar energy, sunlight is converted into the usable
en-15
ergy forms(heat or electricity). Generally, there are two different technologies
16
namely photovoltaic panel (PV) and concentrated solar power (CSP) for electricity
17
generation[13]. The CSP technology uses concentrated solar radiation as a
high-18
temperature thermal energy source to drive steam turbines and converts it to the
19
electricity[14][15]. These systems areappropriated for the areas where the direct
20
solar radiation is available and also a number of clear sunny days in the year are
21
high[16, 17]. As well, PV technology is a power system based on the PV cells
22
which converts solar energy into the electricity. Annually, considering the PV
mar-23
ket growing by 30-40%, the PV system is turnedinto one of the most energy carriers
24
M
AN
US
CR
IP
T
AC
CE
PT
ED
by appropriatedtechnologies[15]. 25Geographical information system (GIS) is a powerful tool to visualize and
ana-26
lyze the energy resource potentials. Several investigations have been performed to
27
assess the solar power plant implementing process and also its feasibility by using
28
remotesensing and GIS. Various interacting criteria areeffective for evaluationof
29
the solar power plant. Thus, selecting the most appropriate location and also the
30
better technology for implementing the power plant is a crucial decision. Classic
31
single criterion decision-making methods are not able to address this complicated
32
issue[18].
33
In this regard, Trieb et al.[19]analyzed the technical and economic potential of
34
the CSP using annual direct normal irradiance (DNI) data by excluding sites where
35
geographically unsuitable for solar plants in the world. Inasimilar study, Tahri
36
et al. [20]appliedintegrationof GIS and multi-criteria decision making (MCDM)
37
methods to assess the suitability land for large scale solar electric generation farms.
38
The criteria which were usedarelocation, orography, land use and climate. Based
39
on the location criterion, the ground which was flat and oriented toward the source
40
was selected as the best suitable area. Within another study, Janke[21]identified
41
suitable areas for wind and solar farm using MCDM and GIS modeling techniques.
42
In this investigation, land-cover, population density,federal owned lands, and
dis-43
tance to roads, transmission lines, and cities were considered according to their
44
suitability. Finally, theyconcluded that the solar energy in small scale is more
suit-45
able in comparison to the large scale powerplant. Based on a combination of GIS
46
capability and an MCDM technique, the evaluation of the optimal placement of
pho-47
tovoltaic solar power plants in southeast Spain was studied by Lozano et al.[22]. In
48
the study,environmentaland economic factors were used in site selectionprocess.
49
Currently, Iran’s total power generation capacity is approximately 75GW. Over
50
the past 10 years, demand for power in its domestic market has grown by 6.5%
51
annually, and the country has also started to export significant amounts of power
52
to its neighboring countries[23]. Iran is a large country with a diverse climate
53
and topography in which the solar resources are also abundant with more than 300
54
grid-M
AN
US
CR
IP
T
AC
CE
PT
ED
ACCEPTED MANUSCRIPT
connected PV and CSP power plants are prompted by the Iranian Government. In
56
this regard, several studies were conducted to estimate the solar energy potential
57
in Iran. Moini et al. [25]provided the monthly and annual maps of Iran’s solar
58
radiation on the horizontal surface using angstrom approximated model. Besarati
59
[26]computed a map of the value of the solar energy reaching to the earth surface in
60
50 Iranian main cities based on solar radiation value.Alamdari et al.[27]estimated
61
the global horizontal irradiance (GHI) map for Iran. In the study, they suggested
62
some citieswithaverage horizontal solar radiation above of the 500Wh/m2for
63
moreinvestigations in thephotovoltaic application.
64
In this study, the methodology based on the literatureis developedby
consider-65
ing various criteria and alternatives to find the most appropriate solar farms for PV
66
and CSP sites in Sistan and Baluchistan province located in the southeast of Iran.
67
Despite the previous studies, a novel methodology is conducted in the current
re-68
search regarding theoretical and technical methods of the solar power generation
69
for both PV and CSP technologies in a non-build-up area which can also be used
70
in another location in the world. Defined alternatives which were used in some
71
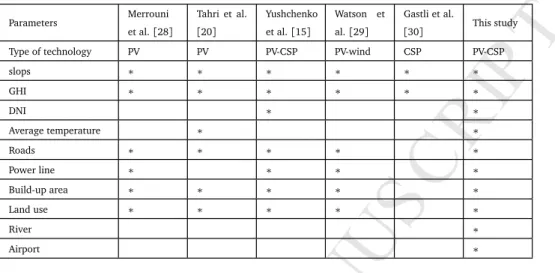
literature reviews and this study are shown in Table 1. The aim of this study is
72
to present the technical and theoretical potential of the best suitable area for
so-73
lar power generation with regard to the appropriate technology in each city of the
74
selected province.
75
2. Methodology 76
2.1. Defining criteria for site selection 77
To achieve the best area for installing a solar power plant, the defined criteria
78
in the literatureareidentified and categorized. It makespossibleto characterize
79
and quantify alternatives in a decision- making process[31]. The proposed goal,
80
which is divided into two levels of criteria and related alternatives are shown in
81
Figure 1. Climate, orography, environmental, and economic criteria are considered
82
in the firstlevel. These can be subdivided into seven alternatives at the second level
83
M
AN
US
CR
IP
T
AC
CE
PT
ED
Table 1: Defined alternatives of literature review and proposed study
Parameters Merrouni et al.[28] Tahri et al. [20] Yushchenko et al.[15] Watson et al.[29] Gastli et al. [30] This study
Type of technology PV PV PV-CSP PV-wind CSP PV-CSP
slops ∗ ∗ ∗ ∗ ∗ ∗ GHI ∗ ∗ ∗ ∗ ∗ ∗ DNI ∗ ∗ Average temperature ∗ ∗ Roads ∗ ∗ ∗ ∗ ∗ Power line ∗ ∗ ∗ ∗ Build-up area ∗ ∗ ∗ ∗ ∗ Land use ∗ ∗ ∗ ∗ ∗ River ∗ Airport ∗
including land use, slope, aspect, distance to the urban area, distance to roads and
84
highways, potential solar radiation, and land surface temperature.
85
Figure 1: A flow diagram of decision making for selecting the best solar potential area
A group of experts in solar and power plant engineering fields was asked to do
86
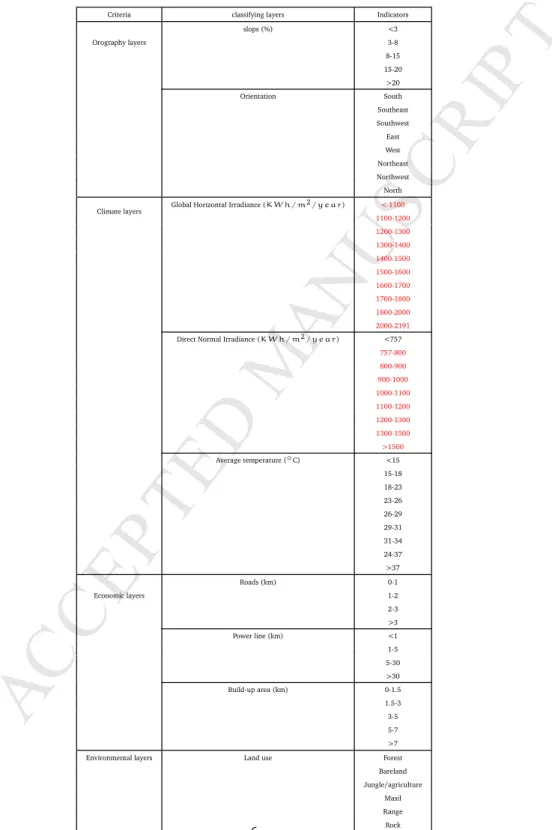
a survey and their comments were used and presented in Table 2. Furthermore,
87
due to the fact that in some areas like the environmentally protected areas, roads,
M
AN
US
CR
IP
T
AC
CE
PT
ED
ACCEPTED MANUSCRIPT
Table 2: Input data of criteria, alternatives and indicators
Criteria classifying layers Indicators Orography layers slops (%) <3 3-8 8-15 15-20 >20 Orientation South Southeast Southwest East West Northeast Northwest North Climate layers Global Horizontal Irradiance (KWh/m
2/year) <1100 1100-1200 1200-1300 1300-1400 1400-1500 1500-1600 1600-1700 1700-1800 1800-2000 2000-2191
Direct Normal Irradiance (KWh/m2/year) <757
757-800 800-900 900-1000 1000-1100 1100-1200 1200-1300 1300-1500 >1500 Average temperature (◦C) <15 15-18 18-23 23-26 26-29 29-31 31-34 24-37 >37 Economic layers Roads (km) 0-1 1-2 2-3 >3 Power line (km) <1 1-5 5-30 >30 Build-up area (km) 0-1.5 1.5-3 3-5 5-7 >7 Environmental layers Land use Forest
Bareland Jungle/agriculture Masil Range Rock 6
M
AN
US
CR
IP
T
AC
CE
PT
ED
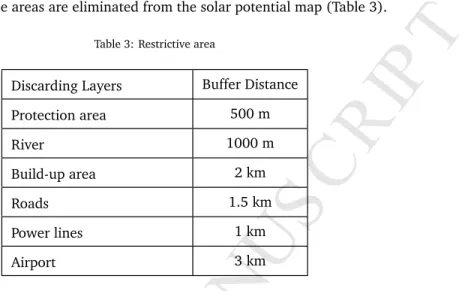
rivers, airports, and transmission lines, there is no possibility of solar power plant
89
installation, these areas are eliminated from the solar potential map (Table 3).
90
Table 3: Restrictive area
Discarding Layers Buffer Distance
Protection area 500 m River 1000 m Build-up area 2 km Roads 1.5 km Power lines 1 km Airport 3 km
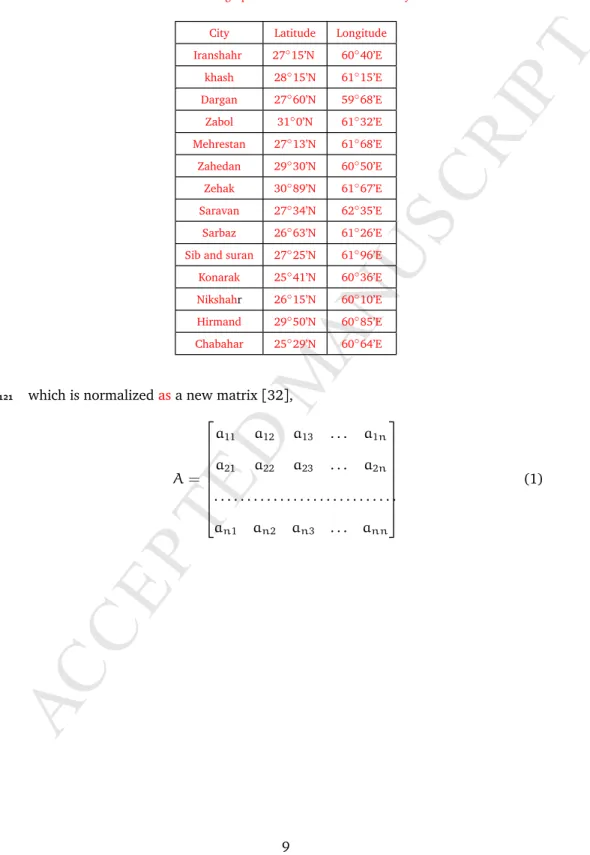
For identification of the solar power plant potential on a regional scale in Iran,
91
Sistan and Baluchistan province is selected as a case study. Sistan and Baluchistan
92
province is one of the 31 provinces of Iran with the highest potential of solar
irra-93
diance[31]in the country. It is located in the southeast of the country (27.5300N,
94
60.5821E) as shown in Figure 2. As well, the geographic coordinates of Sistan
95
and Baluchistan’s cities are shown in Table 4. The province areais 181,779km2,
96
which represents about 4.11% of the totalnational landof Iran, with 2.5 million
97
inhabitants. in 2016 in 19 districts. Based on solar statistics reports, the number of
98
sunny days is more than 300 days in this region. Sistan and Baluchistan province
99
has a warm climate and its average mean temperature is 43C. On the other hand,
100
the minimum temperaturewhich is-11.4◦C can be experienced in the provincein
101
January.
102
2.2. Multi-criteria decision making and analytical hierarchy process 103
The analytical hierarchy process (AHP) is based on mathematics and psychology.
104
It was originally introduced by Saaty in 1980[32].The AHP covers multiple aspects
105
process tohelp decision makersto make comparisons and solvecomplex decision
106
problems[32].
M
AN
US
CR
IP
T
AC
CE
PT
ED
ACCEPTED MANUSCRIPT
11For an identification of the solar power plant potential on a regional scale in Iran, Sistan and Baluchistan province is selected as a case study. Sistan and Baluchistan province is one of the 31 provinces of Iran with the highest potential of solar irradiance [45] in the country. It is located in the southeast of the country (27.5300° N, 60.5821° E) as shown in Figure 2. The province area is of 181,779 km², which represents about 4.11 percent of the total area of Iran, with 2.5 million inhabitations in 2016 in 19 districts. Given the yaers, the number of sunny days is more than 300 days. Sistan and Baluchistan has a warm climate and its average . On the other hand, the minimum temperature
(-experienced in the province in the month of January.
Figure 2. Geographic location of Sistan and Baluchistan Province
In order to define the best suitable area, all of four different criteria is classified (sorted out) to various alternatives. Also, each final output maps of different criteria hase been achieved by classifying alternatives integrated with the AHP method and GIS tool. For more details, four categorized criteria are subdivided as:
2.1.1.1 Climate
Climate factors (solar irradiance and average earth temperature) are the most important parameters for the decision rule that defines whether the selected location will be sufficient for electricity production capacity
Figure 2: Geographic location of Sistan and Baluchistan Province
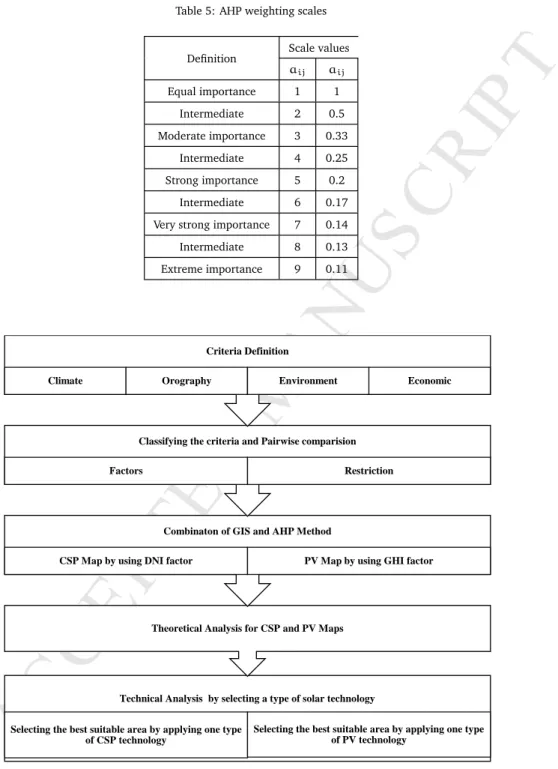
The first step in the AHP method is to assess the criteria that enable us to make
108
an accurate comparison and right decisions to provide subjective judgments. In the
109
AHP process the decision making procedure is breaking down into a hierarchy of
110
the goals, criteria, and alternatives, respectively. The framework of this approach is
111
illustrated in Figure 3. Itshould benoted that the AHP method is based on applying
112
pairwise comparison in order to drive weight for alternatives[15].
113
Typically, to show the importance of factors, 9 points with values ranging from 1
114
to 9 are used as shown in Table 5[32, 33]. For instance, A1 is more important than
115
A2 equals toa12(as an examplea12=3) and the relative of A2 to A1 is its reciprocal
116
(a21=1/3). The higher weight, the higher importanceof the corresponding
crite-117
rion. Also, a decision by sensitivity analysis and synthesis results can be made. To
118
visualize the suitable area, the AHP method is mostly used in combination with GIS
119
[29, 34].The weightof criteria and alternatives can be defined as matrix A (Eq. 1)
120
M
AN
US
CR
IP
T
AC
CE
PT
ED
Table 4:Geographic coordinates of the case study
City Latitude Longitude Iranshahr 27◦15’N 60◦40’E khash 28◦15’N 61◦15’E Dargan 27◦60’N 59◦68’E Zabol 31◦0’N 61◦32’E Mehrestan 27◦13’N 61◦68’E Zahedan 29◦30’N 60◦50’E Zehak 30◦89’N 61◦67’E Saravan 27◦34’N 62◦35’E Sarbaz 26◦63’N 61◦26’E Sib and suran 27◦25’N 61◦96’E Konarak 25◦41’N 60◦36’E
Nikshahr 26◦15’N 60◦10’E
Hirmand 29◦50’N 60◦85’E
Chabahar 25◦29’N 60◦64’E
which is normalizedasa new matrix[32],
121 A= a11 a12 a13 . . . a1n a21 a22 a23 . . . a2n . . . . an1 an2 an3 . . . ann (1)
M
AN
US
CR
IP
T
AC
CE
PT
ED
ACCEPTED MANUSCRIPT
Table 5: AHP weighting scales
Definition Scale values
aij aij Equal importance 1 1 Intermediate 2 0.5 Moderate importance 3 0.33 Intermediate 4 0.25 Strong importance 5 0.2 Intermediate 6 0.17
Very strong importance 7 0.14
Intermediate 8 0.13
Extreme importance 9 0.11
Technical Analysis by selecting a type of solar technology
Selecting the best suitable area by applying one type of CSP technology
Selecting the best suitable area by applying one type of PV technology
Theoretical Analysis for CSP and PV Maps Combinaton of GIS and AHP Method
CSP Map by using DNI factor PV Map by using GHI factor
Classifying the criteria and Pairwise comparision
Factors Restriction
Criteria Definition
Climate Orography Environment Economic
Figure 3: The steps of methodology for selecting the best suitable area of solar power plants
M
AN
US
CR
IP
T
AC
CE
PT
ED
The weights of criteria and alternatives are calculated by expert choice which
122
is a user-friendly and practical tool for analytical thinkers. The decision-making
123
problem is modeled in the expert choice software to arrange a goal or decision down
124
to fewer parts. So, by dividing goalsintosub-criterion, decision-makers would be
125
able to apply judgment to achieve their goals. Finally, the result of the computation
126
can provide beneficial information about the defined criteria and alternatives.
127
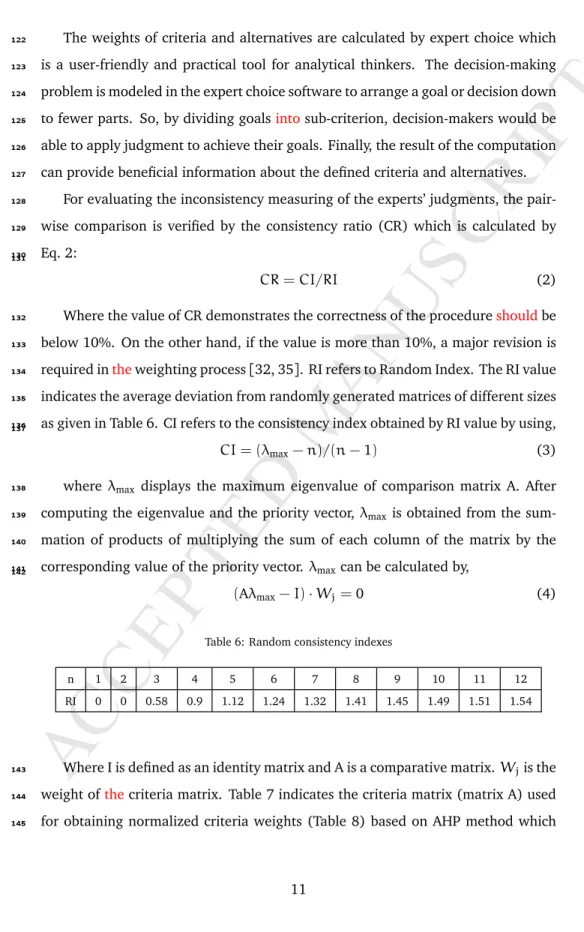
For evaluating the inconsistency measuring of the experts’ judgments, the
pair-128
wise comparison is verified by the consistency ratio (CR) which is calculated by
129
Eq. 2:
130 131
CR=CI/RI (2)
Where the value of CR demonstrates the correctness of the procedureshouldbe
132
below 10%. On the other hand, if the value is more than 10%, a major revision is
133
required intheweighting process[32, 35]. RI refers to Random Index. The RI value
134
indicates the average deviation from randomly generated matrices of different sizes
135
as given in Table 6. CI refers to the consistency index obtained by RI value by using,
136 137
CI= (λmax−n)/(n−1) (3) whereλmax displays the maximum eigenvalue of comparison matrix A. After
138
computing the eigenvalue and the priority vector,λmaxis obtained from the
sum-139
mation of products of multiplying the sum of each column of the matrix by the
140
corresponding value of the priority vector.λmaxcan be calculated by,
141 142
(Aλmax−I)·Wj=0 (4) Table 6: Random consistency indexes
n 1 2 3 4 5 6 7 8 9 10 11 12
RI 0 0 0.58 0.9 1.12 1.24 1.32 1.41 1.45 1.49 1.51 1.54
Where I is defined as an identity matrix and A is a comparative matrix.Wjis the
143
weight ofthecriteria matrix. Table 7 indicates the criteria matrix (matrix A) used
144
for obtaining normalized criteria weights (Table 8) based on AHP method which
M
AN
US
CR
IP
T
AC
CE
PT
ED
ACCEPTED MANUSCRIPT
saysthat the climate criterion has the weight of 58% in comparison to the
orog-146
raphy (25%), economic (5%) and environment (12%). In this study, the pairwise
147
comparison is verified by the consistency analysis where the value ofλmax, CI, and
148
n are, 4.056, 0.01867 and 4, respectively. When the criteria were organized by the
149
AHP method, the same procedureisrepeated with nine alternatives. As shown in
150
Table 9, the alternatives final weights using in each criterion is obtained by the AHP
151
method.
152
Table 7: Pairwise comparison matrix ( assigned to criteria)
Criteria Orography Environment Economic Climate
Orography 1 3 5 0.33
Environment 0.33 1 3 0.2
Economic 0.2 0.33 1 0.11
Climate 3 5 9 1
Table 8: Normalized pairwise comparison matrix
Criteria Orography Environment Economic Climate
Normalized priority Vector (Wj) Weights (Wj%) Orography 0.22 0.32 0.28 0.2 0.25 25 Environment 0.07 0.11 0.17 0.12 0.12 12 Economic 0.04 0.04 0.06 0.07 0.05 5 Climate 0.66 0.54 0.5 0.61 0.58 58
2.3. Criteria classification maps 153
In order to specify the most suitable area, a combination of defined alternatives
154
in each criterion (Figure 4)isapplied to indicate the best suitable area in criteria as
155
shown in Figure 5. Regarding the GIS and spatial analysis tool, all the criteria final
156
mapsareclassified from 1(low potential) to 10(high potential). For more details,
157
four categorized criteria are subdivided asfollows,
158
M
AN
US
CR
IP
T
AC
CE
PT
ED
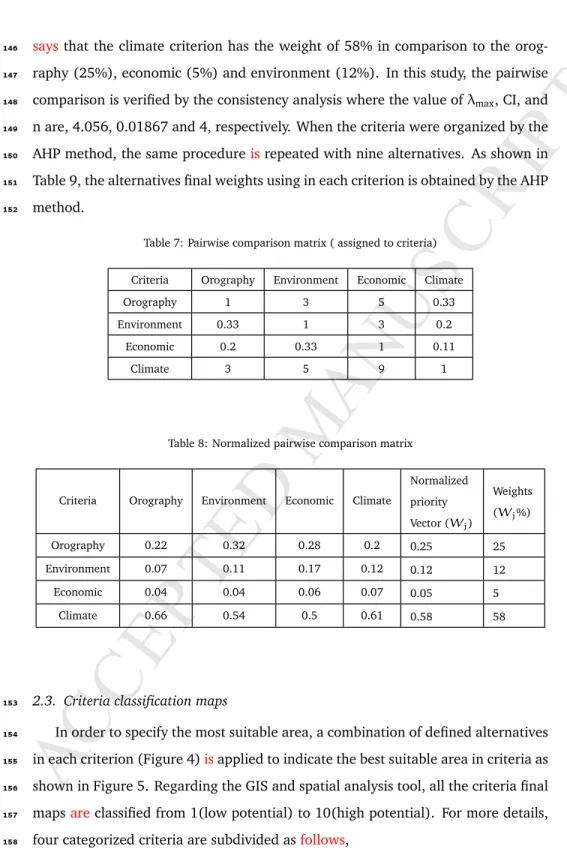
Table 9: Final weights of alternatives
Factors Weights (%)
Land use 7
Average temperature 26
Distance from roads 2
Distance from power lines 4
Distance from build-up area 2
Slope 16
Orientation 12
GHI/DNI 31
2.3.1. Climate 159
Climate factors (solar irradiance and average earth temperature) are known as
160
the most significant parameters for the decision rule that defines whether the
se-161
lected location will be appropriate for the estimated electricity production capacity
162
of the PV or CSP power plants[31]. In the presented study, solar irradiance and
163
average temperature valuesareredefined by distributed classes.
164
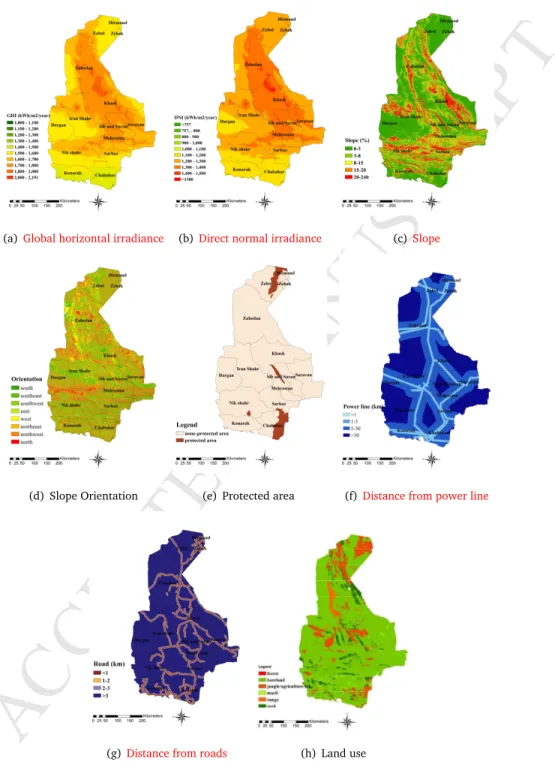
As depicted in Figure 4(a) and Figure 4(b), the most significant area is
cov-165
ered by more than 1600kWh/m2and 1400kWh/m2for global horizontal irradiance
166
(GHI) and direct normal irradiance (DNI), respectively. These figures represent the
167
theoretical potential of the both types of the solar irradiance which is categorized
168
from the least irradiation to the highest irradiation (Table 2). As seen in Figure 5(a),
169
the climate alternatives are combined based on the weighting method.
170
2.3.2. Orography 171
Generally, the most suitable areas for installation solar panels are the ground
172
which isflat and oriented to the south. In this paper, ground’s slopes by more than
173
3% are considered as less valuable due to higher construction cost. Basically, due
174
to the geographic location of the selected area, most areas are highly desirable as
175
shown in Figure 4(c) and Figure 4(d). By combining the slope and orientation
176
classified maps, a map of orography is produced as shown in Figure 5(b).
M
AN
US
CR
IP
T
AC
CE
PT
ED
ACCEPTED MANUSCRIPT
2.3.3. Environment 178In addition to the climate and orography criteria, several influencing variables
179
including roads, rivers, land uses, build-up areas, protected areas and airports are
180
chosen as environmental alternatives. Some studiesprefer to install power plants
181
close locations to urban areas because of the high demand for electricity and also
182
reducing the associated transmission cost. However, making solar power plants
183
close to urban areas may impede urban growth[36]. In this case, the
environ-184
ment parameters are shown in Figure 4(e) to Figure 4(h). A view of the classified
185
environmental alternatives is demonstrated in Figure 5(c).
186
2.3.4. Economic 187
Economic factors such as the distance from roads and power lines can impact
188
the construction cost of the solar power plant installation. Projects are also more
189
likely to be successful if they are in an accessible distance from the power grid[37].
190
Likewise, if the ground slope is less than 3% and suitable for solar panel installation,
191
it can be the most cost-effective for instance,reducing the number of extra roads
192
which should be constructed. Also, there is a wide range of slope values. Some
193
of these values may add more costs tothe construction. Considering all of the
194
classified alternatives, a map of the economic criterion is presented in Figure 5(d).
195
2.4. Description of solar power generation 196
In overall, the methods for solar power calculation have been categorized
ac-197
cording to the theoretical, technical and economic potential assessments. Basically,
198
the theoretical potential can be defined as the total annual solar radiation in a
suit-199
able area for installing large-scale solar power plants (outside of the built-up area).
200
Based on the GIS tools and AHP method, by extraction of the restrictive area from
201
solar irradiance map, the theoretical solar potential is obtained. In this case, both
202
GHI and DNI solar irradiances are considered to evaluate the proposed area for PV
203
and CSP power plant installation, respectively.
204
From the technical potential perspective, the solar power generation is
esti-205
mated bearing in mind the theoretical potential by considering the solar power
206
M
AN
US
CR
IP
T
AC
CE
PT
ED
Powered by TCPDF (www.tcpdf.org)(a)Global horizontal irradiance
Powered by TCPDF (www.tcpdf.org)
(b)Direct normal irradiance
Powered by TCPDF (www.tcpdf.org)
(c)Slope
Powered by TCPDF (www.tcpdf.org)
(d) Slope Orientation Powered by TCPDF (www.tcpdf.org)
(e) Protected area Powered by TCPDF (www.tcpdf.org)
(f)Distance from power line
Powered by TCPDF (www.tcpdf.org)
(g)Distance from roads
14
Figure 3. Physical factors of the study area
h) Land use g) Buffer from roads
f) Buffer from power e) Protected area
(h) Land use
M
AN
US
CR
IP
T
AC
CE
PT
ED
ACCEPTED MANUSCRIPT
Powered by TCPDF (www.tcpdf.org) (a)Climate Powered by TCPDF (www.tcpdf.org) (b)Orography Powered by TCPDF (www.tcpdf.org) (c)Environmental Powered by TCPDF (www.tcpdf.org) (d)EconomicFigure 5:Criteria classificationof the case study
M
AN
US
CR
IP
T
AC
CE
PT
ED
technologies. To calculate annual power generation potential based on the solar
207
radiation technical characteristic, PV and CSP solar technologies are presented in
208
Table 10. Also, the PV modules tilted at the latitude angle with the south surface
209
orientation[26].Accordingly, the power generation potential is calculated by Eq. 5,
210 211
Solar Electric Generation(SEG) = (GHI)or(DNI)(Efficiency)(Available Area)(prPV)
(5) where GHI and DNI are measured as (kWh/m2/year). The term "efficiency"
de-212
scribes how efficient the solar system is in converting sunlight into electricity. The
213
term "available area" refers to the total suitable area for PV or CSP installation. prPV
214
is the assumed performance of the PV system.
215
Table 10:PV and CSP technologies considered to calculating the technical potential.
Technology Type of modules Efficiency(%) Pr PV Mono crystalline silicon 15-22 70-85 CSP Parabolic trough steam cycle 15-21
-The economic potential method estimates the cost of the total technical solar
216
power generation in comparison to the conventional electricity sources. The total
217
initial costs including construction, maintenance, and solar technology costs are
218
considered to be constant. In this study,we considered this issuefor a view of the
219
theoretical and technical power potential of PV and CSP systems.
220
3. Results and Discussion 221
Having processed a combination of GIS and AHPtools, this paper has identified
222
asuitableland for the logical location of solar power plants. In order to calculate
223
the suitability index, a pairwise comparison matrix obtained from the AHP method
224
is calculated, and the weights of the criteria and alternatives for assessing the most
225
proper location for solar power generation from both PV and CSP systems are
de-226
termined. The main criteria are divided into four categories including orography,
227
climate, economy, and environment. As discussed, the climate was identified to be
M
AN
US
CR
IP
T
AC
CE
PT
ED
ACCEPTED MANUSCRIPT
the most important criterion. Orography stands in the next stage which extremely
229
depends on a land-oriented to the south and a flat area. In comparison, a distance
230
to river, road, airport, power line and urban area were found to have a less
promi-231
nence on the economic and environmental criteria.
232
The results of the processareshown in Figure 6 and Figure 7 which is the final
233
comparison of PV and CSP solar maps driven by GHI and DNI radiation,
respec-234
tively. In our case study, the final outputs (Figure 6 and Figure 7) were sorted into
235
five separated categories: best suitable, suitable, moderate and less suitable and
236
unsuitable. The unsuitable area showed the restrictive factors, referred to roads,
237
rivers, power line, airports, build-up area and protected area, were not accounted
238
in land potential calculations. The results demonstrate the high potential of PV
239
power compared to CSP power. This result is due to the fact that the annual
vari-240
ation in solar irradiation is from 1546 kWh/m2/year - 2191 kWh/m2/year in the
241
case of the global solar radiation and from 1188 kWh/m2/year-1666 kWh/m2/year
242
in the case of the direct solar radiation. In the proposed GIS models, most of the
243
region demonstrated a suitable land area for both PV and CSP power plants rather
244
than the other classified area. Based on the results, the central and east areas were
245
endowed with remarkable solar energy resources.
246
M
AN
US
CR
IP
T
AC
CE
PT
ED
18Figure 5. Technical solar potential of PV systems in selected region.
Figure 6. Technical solar potential of CSP systems in selected region.
Figure 6:Suitability classes oftechnical solar potential in the PV case
18
Figure 5. Technical solar potential of PV systems in selected region.
Figure 6. Technical solar potential of CSP systems in selected region.
Figure 7:Suitability classesof technical solar potential in the CSP case
poten-M
AN
US
CR
IP
T
AC
CE
PT
ED
ACCEPTED MANUSCRIPT
tial of the selected regionhavebeen estimated in order to find out the suitable area
248
for solar installations. The classified area values, the theoretical and technical
po-249
tential and installed power in 14 cities are summarized in Table 11 and Table 12. It
250
should be noted that the capacity factor of 23%[26]and 20%[38]are considered
251
to calculate the installed power in the PV and CSP cases, respectively. Due to the
252
differences in solar radiation in cities and the land area, the amount of solar power
253
potential is significantly variant. Consequently, about 14% of the chosen case study
254
represents the best suitable area for PV system installation and around 12% would
255
fit for CSP system installation. Hence, Zahedan is specified as the best suitable area
256
since it shown an excellent proportion of solar energy sources in both PV and CSP
257
cases.In Zahedan, the highest theoretical potential is 19537 TWh/yearand 14206
258
TWh/year in PV and CSP cases, respectively. Likewise, the technical potential of
259
PV and CSP cases based on the selected technologies is calculated 3438 TWh/year
260
and 2841 TWh/year, respectively. On the other hand, Hirmand and Chabahar are
261
found as the lowest theoretical power potential by less than 1% best suitable area
262
for both types of technologies. Figure 8 compares the solar power generation in
263
cities with the best suitable location percentage on each case. In our case study,
264
the total technical solar power potential is assumed annually 8758 TWh/year and
265
7419 TWh/year for PV and CSP systems in the best suitable area. Figure 9showsthe
266
solar electricity generation capacity intheclassified land suitability (less suitable,
267
moderate, suitable and best suitable area) in each case, in which the PV electricity
268
generation is athigher level in comparison the CSP case. Overall, the technical
po-269
tential of solar energy generation is highly dependent on the type of the selected
270
solar technology, including the efficiency of PV or CSP systems which has a dramatic
271
effect on the proposed potential compared to the theoretical potential.
272
M
AN
US
CR
IP
T
AC
CE
PT
ED
T able 11: and technical potential of PV power generation in Sistan and Baluchistan province P arameters T otal Area Less Suitable Area Moderate Area Suitable Area Best Suitable Area Annual A verage Solar Radiation theoretical P o-tential (Best Suitable) T echnical tial (Best able) km 2/ % km 2/ % km 2/ % km 2/ % km 2/ % kWh / m 2/ y TWh / y TWh / y Iranshahr 20131 / 11 1534 / 8 6569 / 14 8285 / 15 1159 / 4 1750 2028.25 356.97 Khash 20123 / 11 279 / 2 3816 / 8 6297 / 12 6714 / 25 1900 12756.6 2245.16 Dargan 11534 / 6 2152 / 12 5218 / 11 3005 / 6 21 / 0.1 1710 35.91 6.32 Zabol 15044 / 8 775 / 4 3441 / 8 4910 / 9 293 / 1 1730 506.89 89.21 Mehrestan 6418 / 4 150 / 1 856 / 2 1930 / 4 1776 / 7 1860 3303.36 581.39 Zahedan 36022 / 20 905 / 5 7176 / 16 13628 / 25 10229 / 39 1910 19537.39 3438.58 Zehak 802 / 0.44 48 / 0.26 140 / 0.31 102 / 0.19 0 / 0 1700 0 0.00 Saravan 13274 / 7 115 / 1 2059 / 5 5886 / 11 3056 / 12 1910 5836.96 1027.30 Sarbaz 11146 / 6 1109 / 6 3073 / 7 2830 / 5 628 / 2 1790 1124.12 197.85 Sib and suran 7157 / 4 48 / 0.3 527 / 1 2816 / 5 2128 / 8 1840 3915.52 689.13 K onarak 8968 / 5 3694 / 20 2754 / 6 3 / 0 0 / 0 1700 0 0.00 Nikshahr 20409 / 11 5164 / 28 7964 / 17 3780 / 7 422 / 2 1710 721.62 127.01 Hirmand 1012 / 1 23 / 0.1 23 / 0.1 9.7 / 0 0 / 0 1700 0 0.00 Chabahar 9739 / 5 2418 / 13 1999 / 4 21 / 0 0.1 / 0 1700 0.17 0.03 T otal 181779 18414 / 10 45615 / 25 53502 / 29 26426 / 15 1779 49766 8758M
AN
US
CR
IP
T
AC
CE
PT
ED
ACCEPTED MANUSCRIPT
T able 12: Theoretical and technical potential of C SP power generation in Sistan and Baluchistan province P arameters T otal Area Less Suitable Area Moderate Area Suitable Area Best Suitable Area Annual A verage Solar Radiation Theoretical P o-tential (Best Suitable) T echnical P oten-tial (Best Suit-able) T echnical P oten-tial (Best Suit-able) km 2/ % km 2/ % km 2/ % km 2/ % km 2/ % kWh / m 2/ y TWh / y TWh / y G W Iranshahr 20131 / 11 1884 / 10 5315 / 12 8741 / 16 1606 / 7 1660 2665.96 533.19 304.5 khash 20123 / 11 1142 / 6 4656 / 10 5930 / 11 5378 / 23 1680 9035.04 1807.01 1031.4 Dargan 11534 / 6 1544 / 8 4428 / 10 3981 / 7 442 / 2 1600 707.2 141.44 80.7 Zabol 15044 / 8 491 / 3 1911 / 4 5818 / 10 1198 / 5 1380 1653.24 330.65 188.7 Mehrestan 6418 / 4 453 / 2 1157 / 3 1664 / 3 1437 / 6 1400 2011.8 402.36 229.7 Zahedan 36022 / 20 2361 / 12 7000 / 15 14071 / 25 8507 / 36 1670 14206.69 2841.34 1621.8 Zehak 802 / 0.4 2.7 / 0 131 / 0.3 150 / 0.3 5.7 / 0 1380 7.866 1.57 0.9 Saravan 13274 / 7 634 / 3 3187 / 7 5309 / 4 1987 / 2 1390 2761.93 552.39 315.3 Sarbaz 11146 / 6 1670 / 9 3352 / 7 2234 / 4 383 / 2 1380 528.54 105.71 60.3 Sib and suran 7157 / 4 204 / 1 907 / 2 2243 / 4 2164 / 9 1400 3029.6 605.92 345.8 K onarak 8968 / 5 1875 / 10 3145 / 7 1412 / 3 1.3 / 0 1350 1.755 0.5 0.2 Nikshahr 20409 / 11 5640 / 29 7752 / 17 3594 / 6 342 / 1 1410 482.22 96.44 55 Hirmand 1012 / 1 0.03 / 0 28 / 0.1 26 / 0 0.4 / 0 1380 0.552 0.11 0.1 Chabahar 9739 / 5 1329 / 7 2204 / 5 904 / 2 0.8 / 0 1310 1.048 0.21 0.1 T otal 181779 19229 / 11 45173 / 25 56077 / 31 23452 / 13 1456 37093 7418 4234.4 22M
AN
US
CR
IP
T
AC
CE
PT
ED
0 5 10 15 20 25 30 35 40 45 0 5000 10000 15000 20000 25000 Tehoretical Potential (PV)(a) Theoretical potential (PV)
0 5 10 15 20 25 30 35 40 45 0 500 1000 1500 2000 2500 3000 3500 4000 Technical Potential (PV) (b) Technical potential (PV) 0 5 10 15 20 25 30 35 40 0 2000 4000 6000 8000 10000 12000 14000 16000 Theoretical Potential (CSP (c) Theoretical potential (CSP) 0 5 10 15 20 25 30 35 40 0 500 1000 1500 2000 2500 3000 Technical Potential (CSP) (d) Technical potential (CSP)
Figure 8: Solar power generation in each city
0 10000 20000 30000 40000 50000 60000 70000 80000 90000 100000 Less suitable
Area Moderate Area Suitable Area Best suitableArea Geographical Potentioal (PV) Geographic Potential (CSP) Technical Potencial (PV) Technical Potential (CSP)
M
AN
US
CR
IP
T
AC
CE
PT
ED
ACCEPTED MANUSCRIPT
4. Conclusion 273This paper evaluatedthe potential of CSP and PV power plants in Sistan and
274
Baluchistan province,southeast Iran. Multi-criteria decision making methods
us-275
ing GIS as a digital-based spatial computation tool was conducted to estimate the
276
theoretical and technical potential of the non-build-up area. Basically, having a
277
solar power plant installation would necessitate a consideration of the economic,
278
climate, environmental, and orography criteria for whichall thelimiting parameters
279
are measured. The restrictive factors, for instance, roads, rivers, airport, build-up
280
area, and protected area were not accounted to define the suitability of the solar
281
land. In addition, the climate criterion and the total land area were demonstrated
282
to have a significant direct effect on the potential of solarpowergeneration. Based
283
on the outcomes, it is confirmed that the choice of a solar farm provides a high
284
supplying electricityisvery encouraging for investors. Furthermore, theproposed
285
methodology in this paper can be performed in other locations and scales. The
286
following conclusions were drawn from the present study,
287
• The study applied to select the best suitable area of solar power plant potential
288
using a combination of GIS and MCDM methods.
289
• The final outputmaps demonstratethat the climate criterion has a significant
290
effect on the solar power potential.
291
• about 14% and 12% of the selected area host the best suitable area for PV
292
and CSP solar power generation, respectively.
293
• Theoretical potential of solar energy generation in the best suitable area is
294
about 49766TWh/year in the PV case and 37093TWh/year in the CSP case.
295
• The solar power potential of the best suitable area based on the technical
296
method for estimating the solar energy was calculated and determined to be
297
8758TWh/year and 7419TWh/year for PV and CSP systems.
298
• The choice of PV solar farm provides a high potential in supplying the
elec-299
tricity demand compared to the CSP solar plants.
300
M
AN
US
CR
IP
T
AC
CE
PT
ED
References[1] M. Marzband, F. Azarinejadian, M. Savaghebi, J. M. Guerrero, An optimal en-ergy management system for islanded microgrids based on multiperiod artifi-cial bee colony combined with markov chain, IEEE Systems Journal 11 (2015) 1712 – 1722.
[2] M. Marzband, H. Alavi, S. S. Ghazimirsaeid, H. Uppal, T. Fernandod, Optimal energy management system based on stochastic approach for a home micro-grid with integrated responsive load demand and energy storage, Sustainable Cities and Society 28 (2017) 256–264.
[3] M. Marzband, F. Azarinejadian, M. Savaghebi, E. Pouresmaeil, J. M. Guerrero, G. Lightbody, Smart transactive energy framework in grid-connected multiple home microgrids under independent and coalition operations, Renewable En-ergy 126 (2018) 95 – 106.
[4] M. Marzband, M. Javadi, S. A. Pourmousavi, G. Lightbody, An advanced retail electricity market for active distribution systems and home microgrid interop-erability based on game theory, Electric Power Systems Research 157 (2018) 187–99.
[5] U. E. I. Administration, International energy outlook 2017 overview,[Online] Available: www.eia.gov/.
[6] Y. Noorollahi, H. Yousefi, M. Mohammadi, Multi-criteria decision support sys-tem for wind farm site selection using gis, Sustainable Energy Technologies and Assessments 13 (2016) 38–50.
[7] H. Yousefi, Y. Noorollahi, S. Ehara, R. Itoi, A. Yousefi, Y. Fujimitsu, J. Nishi-jima, K. Sasaki, Developing the geothermal resources map of iran, Geother-mics 39 (2) (2010) 140–151.
[8] Y. Noorollahi, R. Itoi, H. Fujii, T. Tanaka, Geothermal resources exploration and wellsite selection with environmental consideration using GIS in Sabalan geothermal area, Iran, PROCEEDINGS, 20122.
M
AN
US
CR
IP
T
AC
CE
PT
ED
ACCEPTED MANUSCRIPT
[9] M. Tavakoli, F. Shokridehaki, M. F. Akorede, M. Marzband, I. Vechiu, E. Poures-maeil, Cvar-based energy management scheme for optimal resilience and op-erational cost in commercial building microgrids, International Journal of Electrical Power Energy Systems 100 (2018) 1 – 9.
[10] Y. Noorollahi, M. Kheirrou, H. FarabiAsl, H. Yousefi, A. Hajinezhad, Biogas production potential from livestock manure in iran, Renewable and Sustain-able Energy Reviews 50 (2015) 748–54.
[11] M. Azizkhani, A. Vakili, Y. Noorollahi, F. Naseri, Potential survey of photo-voltaic power plants using analytical hierarchy process (ahp) method in iran, Renewable and Sustainable Energy Reviews 75 (2017) 1198–206.
[12] T. Ramachandra, R. Jain, G. Krishnadas, Hotspots of solar potential in india, Renewable and Sustainable Energy Reviews 15 (6) (2011) 3178–86.
[13] T. Huld, Pvmaps: Software tools and data for the estimation of solar radiation and photovoltaic module performance over large geographical areas, Solar Energy 142 (2017) 171–181.
[14] M. H. Ahmadi, M. Ghazvini, M. Sadeghzadeh, M. A. Nazari, R. Kumar, A. Naeimi, T. Ming, Solar power technology for electricity generation: A crit-ical review, Energy Science and Engineering.
[15] A. Yushchenko, A. de Bono, B. Chatenoux, M. Kumar Patel, N. Ray, Gis-based assessment of photovoltaic (pv) and concentrated solar power (csp) genera-tion potential in west africa, Renewable and Sustainable Energy Reviews 81 (2018) 2088–103.
[16] P. Blanc, B. Espinar, N. Geuder, C. Gueymard, R. Meyer, Direct normal irradi-ance related definitions and applications: The circumsolar issue, Solar Energy 110 (2014) 561–577.
[17] M. Marzband, M. H. Fouladfar, M. F. Akorede, G. Lightbody, E. Poures-maeil, Framework for smart transactive energy in home-microgrids
M
AN
US
CR
IP
T
AC
CE
PT
ED
ering coalition formation and demand side management, Sustainable Cities and Society 40 (2018) 136–54.
[18] S. Cristobal, Multi-criteria decision-making in the selection of a renewable energy project in spain: the vikor method, Renewable Energy 36 (2011) 498– 502.
[19] F. Trieb, C. Schillings, M. Sullivan, T. Pregger, C. Hoyer-Klick, Global potential of concentrating solar power, SolarPaces Conference Berlin 0 (1) (2009) 1–11. [20] M. Tahri, M. Hakdaoui, M. Maanan, The evaluation of solar farm locations applying geographic information system and multi-criteria decision-making methods: Case study in southern morocco, Renewable and Sustainable Energy Reviews 51 (2015) 1354–62.
[21] J. R. Janke, Multi-criteria GIS modeling of wind and solar farms in colorado, Renewable Energy 35 (10) (2010) 2228–34.
[22] J. M. Sánchez-Lozano, J. Teruel-Solano, P. L. Soto-Elvira, M. Socorro García-Cascales, Geographical information systems (gis) and multi-criteria decision making (mcdm) methods for the evaluation of solar farms locations: Case study in south-eastern spain, Renewable and Sustainable Energy Reviews 24 (24) (2013) 544–56.
[23] T. Berhan, Renewable energy projects in ethiopia, [ On-line]Available: https://www.dentons.com/en/insights/ guides-reports-and-whitepapers/2016[accessed october 31 2016].
[24] M. Daneshyar, Solar radiation statistics for iran, Solar Energy 21 (4) (1978) 345–349.
[25] S. Moini, S. Javadi, M. D. Manshadi, Feasibility study of solar energy in iran and preparing radiation atlas, Recent Adv Environ Energy Syst Nav Sci (2011) 1–7.
M
AN
US
CR
IP
T
AC
CE
PT
ED
ACCEPTED MANUSCRIPT
[26] S. Besarati, R. Padilla, D. Goswami, E. Stefanakos, The potential of harnessing solar radiation in iran: Generating solar maps and viability study of pv power plants, Renewable Energy 53 (2013) 193–99.
[27] P. Alamdari, O. Nematollahi, A. Alemrajabi, Solar energy potentials in iran: A review, Renewable and Sustainable Energy Reviews 21 (2013) 778–88. [28] A. A. Merrouni, F. Elwali Elalaoui, A. Mezrhab, A. Mezrhab, A. Ghennioui,
Large scale pv sites selection by combining gis and analytical hierarchy pro-cess. case study: Eastern morocco, Renewable Energy 119 (April 2018) 863– 873.
[29] J. J. W. Watson, M. D. Hudson, Regional scale wind farm and solar farm suit-ability assessment using gis-assisted multi-criteria evaluation, Landscape and Urban Planning 138 (2015) 20–31.
[30] A. Gastli, Y. Charabi, Solar electricity prospects in oman using GIS-based solar radiation maps, Renewable and Sustainable Energy Reviews 14 (2) (2010) 790–97.
[31] Arán Carrión, J. Espín Estrella, A, Aznar Dols, F, Zamorano Toro, M. R. guez, , A. Ramos Ridao, Environmental decision-support systems for evaluating the carrying capacity of land areas: Optimal site selection for grid-connected pho-tovoltaic power plants, Renewable and Sustainable Energy Reviews 12 (9) (2008) 2358–80.
[32] T. L. Saaty, The analytic hierarchy process: planning, priority setting, re-sources allocation, New York: McGraw 281.
[33] M. H. Hussain, Assessment of groundwater vulnerability in an alluvial inter-fluve using gis, Unpublished Ph. D Thesis, Department of Hydrology, Indian Institute of Technology Roorkee, Roorkee-247 667.
[34] Y. Charabi, A. Gastli, Pv site suitability analysis using gis-based spatial fuzzy multi-criteria evaluation, Renewable Energy 36 (9) (2011) 2554–61.
M
AN
US
CR
IP
T
AC
CE
PT
ED
[35] F. Zahedi, The analytic hierarchy process, a survey of the method and its ap-plications, Interfaces 16 (4) (1986) 96–108.
[36] M. SocorroGarcía-Cascales, J. M. Sánchez-Lozano, Geographical Information Systems (GIS) and Multi-Criteria Decision Making (MCDM) methods for the evaluation of solar farms locations: Case study in south-eastern Spain, Re-newable and Sustainable Energy Reviews 24 (2013) 544.
[37] Perpiña Castillo, Carolina, Batista e Silva, Filipe, Lavalle, Carlo, An assessment of the regional potential for solar power generation in eu-28, Energy Policy 88 (2016) 86–99.
M
AN
US
CR
IP
T
AC
CE
PT
ED
ACCEPTED MANUSCRIPT
Highlight
• An integration between geographic information system and analytical hier-archy process methods has been developed to assess solar power potential.
• Four main criteria including environmental, economic, orography and cli-mate are defined and nine alternatives with six restrictive areas.
• The methods have been applied in the theoretical and technical evaluation of solar power plants in both photovoltaic and concentrated solar power.
• 14% and 12% of the selected area host the best suitable area for photo-voltaic and concentrated solar power technologies, respectively.