Micro-CI: A Model Critical Infrastructure Testbed for Cyber-Security Training
and Research
William Hurst, Nathan Shone, Qi Shi
Department of Computer Science Liverpool John Moores UniversityByrom Street, Liverpool, UK {W.Hurst, N.Shone, Q.Shi}@ljmu.ac.uk
Behnam Bazli
School of Computing Staffordshire University Beaconside, Stafford, UK [email protected]Abstract— Critical infrastructures encompass various sectors,
such as energy resources and manufacturing, which tend to be dispersed over large geographic areas. With recent technological advancements over the last decade, they have developed to be dependent on Information and Communication Technology (ICT); where control systems and the use of sensor equipment facilitate operation. However, the persistently evolving global state of ICT has resulted in the emergence of sophisticated cyber-threats. As dependence upon critical infrastructure systems continues to increase, so too does the urgency with which these systems need to be adequately protected. Modelling and testbed development are now crucial for the study and analysis of security within critical infrastructures; particularly as testing within a live system can have far-reaching impacts, including potential loss of life. Existing testbed approaches are not replicable or involve the use of simulation, which impacts upon the realism of the datasets constructed. As such, the research presented in this paper discusses the novel development of a replicable and affordable critical infrastructure testbed for cyber-security training and research. The testbed can be used to anticipate cyber-security incidents and assist in the development of new and innovative cyber-security methods. The access to real-world data for training, research and testing new design methodologies is a challenge for security researchers; as such, the aim of this project is to provide an original methodology for the construction of accessible data for cyber-security research. The testbed data is evaluated through a comparison with a simulation comprised of the same components.
Keywords-critical infrastructure; cyber-security; modelling; testbed; data analysis; teaching.
I. INTRODUCTION (HEADING 1)
Critical infrastructures are comprised of a network of interdependent man-made systems. They interoperate to provide a continuous flow of services, which are essential for economic development and social well-being. Food and water distribution, energy supply, finance, military defence, manufacturing, transport, governmental services and healthcare are all notable examples of services provided by critical infrastructures (Merabti et al.,). One of their key defining factors is society’s dependence on their amenities and the potential loss encountered if a successful physical or cyber-attack takes place. For example, Reichenbach et al., detail that public life within Germany would reach civil war
levels if power supply breaks down; optimistic worst-case scenarios had this occurring within a 10-day period. This illustrates the emphasis placed on critical infrastructure safeguarding practices.
All critical infrastructure areas are becoming substantial Information and Communication Technology (ICT) users; making use of automation to facilitate production and expand their services. ICT has also increased in areas such as agriculture and water (Mafuta et al.,), where control systems and the use of sensor equipment increases the efficiency of production to satisfy growing demands. For example, the use of robotics in farming to assist with labour-intensive work is revolutionising the way in which crops are grown and maintained (Mafuta et al.,). However, the challenge of low-power operation, means that almost no update, encryption or debugging capabilities are possible for the sensors in place.
Infrastructure interdependencies have developed as ICT usage has increased. Many companies accept that IC systems' communication is not encrypted and try to hide them within internal networks. Many network protocols have now been replaced by normal TCP and HTTP. The challenge is, many systems that were not accessible before, are now within the public internet. In addition, a critical failure in one infrastructure can directly lead to disruptions in others, exacerbating the risks being faced. This increase in digitisation and interconnectivity has also meant that such failures could be deliberately implemented from a remote location by means of a cyber-attack. Furthermore, the increasing complexity of cyber-attacks and the open source availability of attack-toolkits mean that effective security within critical infrastructures is a challenging task.
Developing future cyber-attack countermeasures requires real-world critical infrastructure data, which can be problematic. Real-world data is sensitive and often classified, thus companies are unwilling to part with it, even to aid researchers and students investigating cyber-security methods that may help safeguard their systems in the future.
The novel Micro-CI project, featured in this paper, aims to address the lack of access to experimental data and the hands-on experience needed to properly understand the challenges involved in an era of growing digital threats. This is achieved through the design and construction of a replicable critical infrastructure testbed for cyber-security training and research.
As such, the intended output of the project is to construct a bespoke ‘bench-top’ testbed for data generation; consisting of a model infrastructure system. The testbed is used for cyber-security research purposes and testing new experimental methods for enhancing the level of security in cyber-critical systems. The testbed consists of a hackable water distribution plant with control system and realistic infrastructure data output. This results in the creation of a safe and interactive environment, in which, theoretical cyber-security systems can be tested.
Software-based simulation data is often used to test theoretical cyber-security systems; however, data constructed through emulators is inherently lacking in realism and a hands-on learning experience is missed. A simulation is a representation of a mental model. This is an issue, as a tester would test the correctness of the mental model and not the real world application, which would have a negative impact. In addition, environmental concerns (e.g. temperature) might be a significant consideration during a test; typically, this is not a consideration during simulation design. Also, from an educational perspective, there are multiple modes of learning (e.g., aural, visual,) and there is a category of students that need physical hands-on experience to understand a concept.
For that reason, in this paper, the architecture for the Micro-CI testbed, which replicates a water distribution plant, is outlined. Similarly, both the physical design and construction of the testbed is detailed. The Micro-CI testbed forms the basis of the novel contribution made by this paper. A case study and evaluation, in which cyber-attacks are launched against the water distribution plant, is also presented. For this, both the Micro-CI testbed and industry-leading critical infrastructure simulation software are used to generate results, and compare the datasets produced. This then enables the assessment of the suitability of the data produced by the testbed for future cyber-security research and experimentation.
The remainder of this paper is organised as follows. Section 2 presents a background discussion on testbed and critical infrastructure modelling. Cyber-security and cyber-threats are also highlighted. Section 3 presents the novel methodology used to construct the Micro-CI testbed, the software simulation control model and an example of the data constructed from the testbed and the simulation. Section 4 focuses on a case study of the impact of an attack on both the simulated and physical infrastructures. The application offered in Section 4 is an example to demonstrate the effectiveness of the methodology highlighted in Section 3. Section 5 presents a discussion of the experiment and case study results. Finally, the paper is concluded in Section 6 and future work is highlighted.
II. TYPE STYLE AND FONTS
Having a well-established critical infrastructure network is often considered a sign of civilised life. Nations can be mediated by the strength of their infrastructure network and the services provided to their citizens. Dependence on these infrastructures is also one of society’s greatest weaknesses. A disruption to a single critical infrastructure can result in debilitating consequences on the population, economy and
government. Operating as part of a distributed system, failures within critical infrastructures have the potential to cascade rapidly.
A. The Cyber-Threats
As dependence on these critical infrastructures increases, it is important that the ability to avoid disasters is enhanced. However, cyber-crime is becoming an increasingly concerning problem, especially with the abundance of freely available hacking toolkits. The effects of a cyber-attack can have far-reaching consequences including the availability of other dependent critical infrastructure services and the economy.
Most cyber-attacks are financially motivated, whether this is from offering the attack as a paid-for service, through selling stolen information, exploiting information captured from spear-phishing attacks or from ransom or extortion tactics. Understanding the strategies employed by cyber-attackers is crucial to counteracting the threat posed. Typically, attackers’ strategies can be categorised into three different types, Reckless, Random and Opportunistic (Mitchell et al.,). A Reckless attacker performs attacks whenever there is an opportunity to inflict maximum disruption to the services provided. A Random attacker strikes arbitrarily, to avoid detection, with the intention to cripple the target system. An Opportunistic attacker exploits the ambient noise of a system, and only attacks when the system is weak and the probability of success is high.
As mentioned previously, most attacks are financially motivated. The most common of which is paid-for Distributed Denial of Service attacks (DDoS). DDoS attacks can be used to incapacitate the host servers of a organisation and usually involve the use of illegal botnets (Poisel et al.,). Botnets are effectively a hidden and illegal cyber-army, which can span across the globe, without the controlling-user having to invest in their own hardware or own any physical components (Feily et al.,). The popularity of this attack can be attributed to the operator having a relatively high level of anonymity. The usual form of a DDoS attack involves overloading routers and intermediate links by sending them enormous volumes of network traffic (Feily et al.,). There are several different types of DDoS techniques, some of which include:
• SYN Flood: Known as a Transmission Control Protocol Synchronised Flood (SYN Flood), the attack involves exploiting the TCP connection establishment process (Haris et al.,). Specifically, to establish a connection, a device sends and receives a SYN. The DDoS attack, in this case, functions by making the server unavailable and the SYN process is blocked.
• Peer-to-peer: This type of attack normally involves forcing clients of significant peer-to-peer file sharing centres to connect to a victim after disconnecting from their own network. These attacks operate differently to a botnet and the bot computers are often controlled individually.
• Permanent denial of service: Often DDoS attacks can be so severe that the target hardware needs replacement as a
result. This is known as a permanent denial of service (PDoS), where backdoors are exploited and used to target device firmware which is replaced by the attackers’ own firmware.
Spear-phishing is another common form of cyber-attack, which relies on human error and a lack of threat awareness to be successful. The aim is to trick victims into thinking an email-based scam is legitimate by ensuring the information inside is specific to that person or organisation. As a result of successful spear-phishing attacks, numerous military and private industry systems have been breached in recent years (McAfee et al.,). Each penetration is the direct result of lack of understanding about the nature of the attack, which leads to sensitive information being disclosed. Unfortunately, once attackers have gained an initial point of entry to the system, they can often freely move throughout most of the network.
The consequences of a successful spear-phishing attack are made possible through the tactical goal of achieving a foothold on the targeted system. For that reason, attacks are usually accomplished by using shellcode, code injection and capture attacks to compromise a physical component. Within a critical infrastructure setting, after a target node is compromised, the adversary refocuses the attack and employs the use of forgery, data modification, greyhole/blackhole (packet drop) and replay attacks to compromise sensors and return incorrect readings or execute incorrect commands (forgery attacks). These techniques ensure maximum damage is caused through a foothold situation. The above mentioned attacks comprise part of the background discussion as they are the most common faced by critical infrastructures. As such, they are demonstrated in the case study presented in Section 4.
B. A Cyber-Security Challenge
The control systems currently used in critical infrastructures systems are understandably closed source and not publically available. However, such systems continue to be at risk from cyber-attacks; and the facilitation of essential cyber-security research remains inherently a challenge.
Critical infrastructures tend to be civilian owned by majority. Commercial companies operate competitively with limited capital for spending on security. The result of this is that security can be put at a disadvantage. Different technologies may be used in separate infrastructures as owners are hesitant to share or co-operate with others. This is because information or strategy can be given away by the actions it takes to secure the infrastructure. Separate private ownership of infrastructures poses a challenge for access to real-world data for cyber-security research and teaching. It is this challenge that is at the core of the research put forward in this paper.
One aspect, which all critical infrastructures adopt to secure their service provision despite their separate ownership, is a Defence in Depth (DiD) approach (Hitchins et al.,). DiD involves compartmentalising the system into various layers, each of which operates with different security technologies and Intrusion Detection Systems (IDS). This ensures that if an attacker penetrates one layer, they are not
automatically able to access the next one (Mukherjee et al.,). DiD is most effective when layers are created that are independent of each other. These various levels of security would, for example, include Low levels, Medium levels and High levels. The Low levels would be accessible by general employees who require basic security clearance to the infrastructure to perform their tasks and have access to only a small amount of necessary data. Whereas, the High levels would only be accessible by management and system administrators as the contents would be of a more sensitive nature.
Inside the DiD approach, IDSs have the role of detecting hostile activities within a network, and signalling alarms when attacks are identified (Nowak et al.,). There are multiple types of IDS that are widely used to enhance network security (Zhang et al.,) by providing real time identification of misuse or unauthorised use, whilst allowing the system to continue functioning. Two common types of IDSs used for the identification of intrusion attempts include anomaly detection and signature-based detection. Anomaly detection involves the detection of abnormal network activities. For example, such an anomaly may include a sudden increase in data flow to a certain part of the system, which is unexpected (Sekar et al.,). Signature-based detection is the use of a pattern to identify data that stands out as being an intrusion (Nowak et al.,). The pattern is based on the comparison of the attack with known attack signatures. Signature-based detection, however, is non-adaptive and cannot detect zero-day attacks (which do not have a pre-existing signature), making it an ineffective technique when used by itself (Li et al.,). To cover for various forms of attack, critical infrastructures typically use a combination of multiple types of IDS to maximise infrastructure protection from the many threats that can originate from external network connections.
The continued growth in scale and complexity of some critical infrastructure systems means that they are becoming increasingly enticing targets for cyber-attacks. One such example is healthcare critical infrastructure systems, which are expanding to accommodate the influx of eHealth monitoring systems spawned by smart devices and the Internet of Things (IoT) concept. Modern eHealth monitoring systems are comprised of two main infrastructure layers (Sawand et al.,). The first is the Physical Layer, which encompasses wireless body area networks (WBANs), smart health trackers, IoT sensors and physical equipment used by medical staff. The second is the Service Layer, which houses the cloud computing and storage facilities, and the applications, software and services offered to patients that utilise the data provided by the Physical Layer.
The Physical Layer is composed of many heterogeneous and computationally limited devices (e.g. heart rate sensors, blood oxygen sensors and blood sugar monitors), which pose many security and privacy challenges. For example, wireless communications make sensor technologies internet-accessible, which leaves them publically exposed and highly vulnerable (Hill et al.).
This exposure can be used to an attacker’s advantage by disseminating specific attacks to the patient-side that target
both hardware and software. Attacks on medical critical infrastructure systems are increasing, with attackers aiming to cause maximum damage. This is exacerbated by the increasing number of attack vectors, such as over-the-air software update mechanisms, limited security/encryption capabilities, exploitable developer API exploitation and open source software exploitation. As an example, in over-the-air software update attacks, if updates are frequent, attackers can configure a radio to the appropriate frequency and with a demodulation technique, record updates, reverse engineer the format, craft a software containing malware and deliver it to the targeted device. Additionally, in source code analysis (through Open Source software or disassembled and decompiled binaries), stack buffer overflow vulnerabilities can be revealed. The attacker can also use fuzzing to execute stack buffer overflow attacks.
C. Current Critical Infrastructure Testbeds
Cyber-security research is hampered by a lack of realistic experimental data and opportunities to test new theories in a real-world environment (Benzel et al.,). Ordinarily, the production of reliable and accurate research results would require the purchase of critical infrastructure hardware, which is extremely expensive and impractical. This has led to the development of specific software-based simulators, such as Technomatix (Stoll et al.,) and NS3 (Aalamifar et al.,)]; and the adaptation of existing software-based simulators such as OMNET++ (Queiroz et al.,), Simulink and Matlab (Ficco et al.,). These software simulators enable affordable representations of critical infrastructure systems, by modelling their behaviour, interactions and the integration of their specific protocols (e.g. MODBUS).
However, the suitability of simulation has long been disputed; with the argument that simulations do not represent real-world scenarios accurately, as they lack the ability to model the interactions of control system components. As such, this project aims to provide a testbed that is rudimentary and low-cost to build, but remains extensible. The practical nature of the testbed aims to provide users with a greater level of realism, and a more accurate representation of how different events and behaviours would manifest themselves in real-world scenarios.
As critical infrastructure testbed development for security research is an active yet relatively infantile subject area, there are several similar, yet limited, existing research projects. Some of them are outlined as follows. SCADA LAB (Aragó et al.) is an EU funded project to build a critical infrastructure testbed with a conjoined security lab, to facilitate security experiments. However, the primary limitation of this system is that it is a remote access system, with both the configuration and experimentation carried out by a third party. The testbed proposed in the paper is localised, where researchers/students are able to oversee and manage all aspects of their experiments directly. This means it is more tangible and users can more readily relate directly with their experimentations.
As the implementation of a working critical infrastructure testbed can be time-consuming, Farooqui et al., propose a hybrid approach by combining physical commercial
hardware and simulation software. However, our project consists of the implementation of working control devices, rather than relying on simulation software. Additionally, the testbed utilises small-scale, and therefore portable, hardware; rather than rigid commercial hardware.
Benzel et al., discuss the use of DETER, a cyber-DEfense Technology Experimental Research testbed for supporting the development of next-generation security technologies and experimentation. The testbed is deigned to bridge the gap between small-scale and Internet-scale experiments, through combing both software and hardware components. The testbed also offers tools that aid the experimenters. The main drawback of the DETER testbed is that it is not sufficiently replicable or portable. Meaning users are unable to create their own and its operation relies on connecting to the DETER host.
In addition to the aforementioned testbed approaches, there are several existing proposals for critical infrastructure testbed architectures, which focus on specific systems, such as electricity substations (Wei et al.,). However, our long-term goal is not to constrain our testbed to a single role, but to adopt a modular approach; whereby new critical infrastructure roles can be integrated at a later stage. This would make it suitable and useful to a wider audience. Specifically, the proposed system focuses on a water distribution plant; however, the design is extendable and testbeds can be extended to incorporate other infrastructure types, such as an ecologically-aware power plant.
A framework has also been proposed to address the problem of simulating large-scale critical infrastructure systems on a localised testbed by Ficco et al. As such, they present a framework, which acts as a glue layer between a distributed testbed and simulation of components. The drawback of such an approach is the use of a hybrid method to combine both simulation and physical systems. This results in a testbed which is not rudimentary and where simulation impacts the quality of data produced. Within the MicroCI project, we are primarily concerned with the practical realism of the data and reliability of the generated results through a real-world implementation.
The testbed proposed in by Morris et al., is the most similar existing research to ours in terms of its design, and pedagogical and research purposes (Morris et al.,). The research put forwards proposes a testbed that focuses on cyber-security and utilises miniature hardware for a realistic representation of critical infrastructures. However, the project is only available locally at the authors’ institution and is not easily replicable or portable.
A defining factor of the MicroCI project is to develop a testbed, which is cost effective and easily replicable by other institutions. The design and implementation will both be detailed in publications and made accessible during the project dissemination process.
III. METHODOLOGY & IMPLEMENTATION Currently, model critical infrastructure testbeds are sparse in the UK. This project provides research opportunities for the testing and development of security enhancements in a real-life scenario. As such, the aim of the research is to have a
practical output; a fully working critical infrastructure testbed. The goal is to demonstrate that the datasets generated by the Micro-CI testbed, are of comparable suitability to those created by industry-standard software. In this section, an outline of the architecture of the Micro-CI project is presented. This includes an explanation of how the architecture is identically replicated using both the physical Micro-CI hardware and the industry-standard simulation software.
A. Testbed Architectural Overview
The design displayed below in Figure 1 presents a water distribution plant. The specification is modest, meaning there is scope for future expansion; yet is sufficient in size to produce realistic infrastructure behaviour datasets for research purposes. As illustrated in the diagram, there are two reservoir tanks, which are fed by two pumps moving water from external sources.
Figure 1. Water distribution plant testbed architecture
The remote terminal unit (RTU) is used to monitor the outgoing flow rate and water level, to dynamically adjust the pump speed ensuring adequate replenishment of the reservoir tanks. However, vulnerabilities exist in the system, meaning that it is possible for an attacker to cut off the water supply or flood the reservoir tanks. The design is extendable to other applications, in that it can be connected to other critical infrastructure models (such as power plants, telecommunications etc.), if additional equipment is to be included. This would facilitate future research projects investigating the effect of cascading failures throughout a network of inter-connected critical infrastructures.
B. Practical Micro-CI implementation and data generation
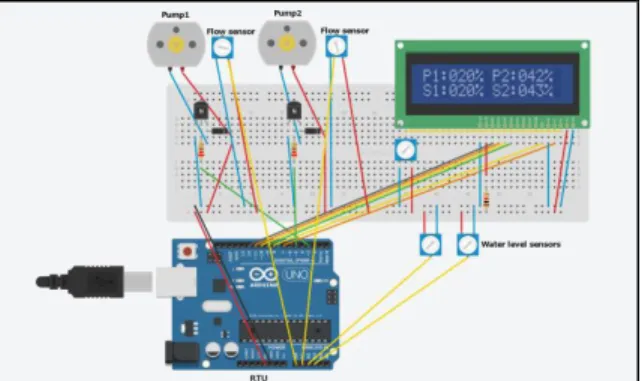
To replicate the architecture illustrated in Figure 1, we will be constructing the physical Micro-CI testbed in accordance with the wiring schematics shown in Figure 2. Specifically, the physical components required include: an Arduino Uno Rev. 3 as the RTU, two 12v peristaltic pumps as the water pumps, two liquid flow meters, two water level sensors, two amplification transistors, diodes, resistors and an LCD.
Figure 2. Physical wiring schematics
In the schematics shown in Figure 2, potentiometer symbols have been used in place of the four sensors; this is due to the limited symbols available in the modelling software. The fifth, unlabelled, potentiometer is used to control the brightness of the LCD. As the maximum output of the Arduino is only 5v, transistors amplify this to the 12v required by the pumps. Lastly, the diodes are used to ensure the current can only travel in one direction, thus preventing damage to the Arduino. The hardware specification used is modest, meaning there is scope for future expansion; yet is sufficient in size to produce realistic infrastructure behaviour datasets for research purposes.
Figure 3. Example Serial Data Stream
For the purpose of this experiment, the Arduino board remains connected to a PC via a USB cable (although this could be replaced with a network connection for similar experiments). Through this USB connection, a serial connection is established to supply a real-time data feed, which is recorded and preserved by the PC (as illustrated in Figure 3). The metrics collected in this instance include: Water level sensor1/2 readings, Flow meter1/2 readings and Pump1/2 speeds. These readings are taken from each sensor every 0.25 seconds (4Hz) and written to the serial data stream.
To examine the quality of the data produced by the Micro-CI implementation, a dataset was recorded over the period of 1 hour. During this time, the testbed was operating
under normal parameters (i.e. no cyber-attacks were present). Essentially, this means that the pump speeds are configured to slowly continue filling the tanks at a controlled speed until full (even if no water is being used) and to cover the current rate of water consumption (if possible). The outflow (water being consumed) is a randomly applied value within a specific range (to make usage patterns more realistic). In this instance, the water source pipe is 60% smaller than the outflow pipe, which allows for a more accurate representation (and to simulate overflow).
Table 1 – Physical testbed Data Sample (%)*
Sample (t) P1 P2 P3 P4 P5 P6 00:10.5 65.0 69.9 47.3 55.4 81.9 85.1 00:10.7 65.0 69.9 39.4 48.5 74.1 78.8 00:11.0 65.0 69.9 39.4 53.4 74.1 83.1 00:11.2 65.0 69.9 33.6 50.5 69.0 81.1 00:11.5 65.0 69.9 41.4 39.7 76.0 70.2
*Symbol explanations are given in the Appendix
C. Software simulation model implementation and data generation
The simulation is constructed, in accordance with the architecture shown in Figure 1. The software is based on object-oriented modelling, where each component inserted is an individual object, which can be adjusted and used to construct data. The resulting simulation environment is displayed in Figure 4.
Figure 4 – Case Study Simulation Testbed
The figure depicts a graphical overview of the emulation, including a water source, two pumps, two tanks and network of pipes used to deliver the water throughout the system. Sensors are coded to extract data at a sampling rate of 0.25 seconds (4Hz) from each of the components within the system. The flow of water from the source to the tanks is governed by the two pumps, and the speed can be adjusted as required. During simulation run-time, the behaviour of one simulation component has a direct impact on another. When a component failure occurs, the simulation is able to keep functioning, but the effects of the fault should be
visible in the dataset. The system functions smoothly and consistently. However, the output and behaviour differs slightly every time the system operates resulting in variance in the datasets.
As previously mentioned, it is clear the use of simulation has many benefits in critical infrastructure protection planning. The advantage of using simulation is that conducting experimentation can be done on a realistic representation of a system without the worry that any damage done would have a real impact. It is this aspect that is transferred over the physical testbed. However, the drawback of simulation is in the quality of data produced. As such, in the following subsection, data constructed from the simulation and the physical testbed are presented and compared in a case study put forward in Section 4.
The water distribution infrastructure in the simulation consists of 12 components. To provide a benchmark to compare the Micro-CI data against, the simulation data was again captured over the period of 1 hour of simulation, with the system functioning under normal conditions. Appendix (1) clarifies the selected components presented in the table. The numbers in Table 2 represent the percentage of the water level in the corresponding component or the operational speed of the component. For example, at 00:10.5 component C1 is 85.7% full, whereas C2 is empty. Each of the components within the simulated system are started with the initial configuration of 0 % full. This is because, unlike the Micro-CI testbed, it is a challenge to begin a simulation with the tanks partially filled. The tank water level is calculated based upon the units of water, which flow into and out of the component.
Table 2 – Simulation Data Sample (%)*
Sample (t) C1 C2 C3 C4 C5 C6 00:10.5 85.7 0 0 100 100 83.3 00:10.7 100 100 100 100 100 100 00:11.0 100 100 100 100 100 100 00:11.2 100 100 100 100 100 100 00:11.5 100 100 100 100 100 100
*Symbol explanations are given in the Appendix
There is no significant change in the data during the one second sample presented above. This demonstrates that the water flow is consistent within each of the components at the given point in time.
IV. 4. CASE STUDY
In this section, a case study is presented, which involves conducting known cyber-attack types on both the Micro-CI testbed and the simulation. The quality of the data produced is assessed and a discussion is put forward on the suitability of both data types for cyber-security research.
In the scenario of this case study, the end users’ water is supplied by a remote water distribution plant. The control of
this plant is governed by an RTU, which is under a DDoS attack. The attack degraded the stability of the communication links between the RTU and its sensors. This in turn means that the availability and frequency of the sensor value measurements is degraded.
A. Simulation Data Preparation
In the simulation, each of the components has a random failure implemented and a specified time to repair. This enables the introduction of a level of realism within the dataset constructed. However, the system should not stop functioning if one of the minor components has a fault. As such, threat behaviour is constructed by causing targeted and random disruptions to the system by increasing the availability percentage in specific components. Turning components off and on, during the simulation, causes a knock-on effect throughout the rest of the system. To construct our abnormal dataset, the availability percentage was increased in each of the components, whilst ensuring the system was able to continue functioning. The Availability Percentage refers to the chances of a machine or component being ready to use at any given time taking into account failures and blockages. It is calculated using the following formula (1):
(1) Here, A is the unavailability of the component, M is the Mean Time To Repair (MTTR) and F is the Mean Time Between Failures (MTBF). The implementation of random failures is intended to reflect realistic unexpected component malfunctions, which occur in all infrastructures. However, due to the fact that power plant systems are designed to be enduring, the failure percentage in the system components was kept low.
When constructing the anomalous behaviour dataset, this approach facilitates impacting system behaviour and, subsequently, the data produced. By implementing more extensive system failures, orchestrated attacks can be conducted on the simulation in order to construct a data set, which would be similar to that of a cyber-attack taking place. In order to generate attack behaviour, a number of recognised faults are introduced to the system. This facilitates an understanding of the system operating whilst under the effects of a cyber-attack.
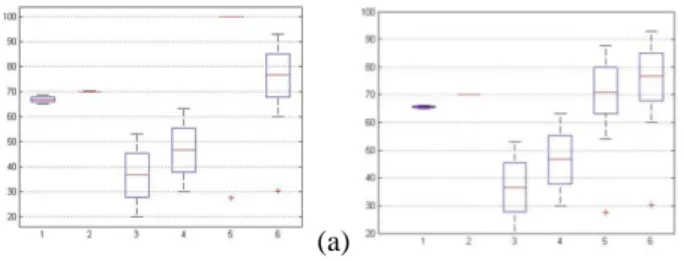
(a) (b)
Figure 5 – Simulation Normal Data Plot(a) vs Cyber-Attack Data Plot (b)
These faults are introduced to the system over a period of two hours, to create a balanced dataset for normal and attack behaviour. Figure 5 displays box plots of the simulation data for normal behaviour and when in a cyber-attack scenario. The components are displayed along the x-axis, with labels 1 to 6. The y-axis displays the level of water within the component. The change in behaviour, as a result of the attack, can be seen in the average value changes in the datasets, and is clearer in some components, such as C1 and C4. The change in behaviour is not visually apparent in others. Changes in behaviour as a result of an attack taking place can often be subtle and hard to identify, particularly when individual components within a vast system are targeted.
B. Testbed Data Preparation
For the first part of this case study, data for the water distribution plant is recorded whilst operating under normal conditions. This allows for the building of a behavioural norm profile for the system, in order to identify anomalies. Within the testbed, during the DDoS attack, only intermittent readings from the sensors are received, forcing it to make drastic (and therefore uncharacteristic) changes to the pump speeds, rather than gradual as when operating as normal.
In this cyber-attack dataset, a DDoS attack is launched against the RTU’s communications channel, so it is only able to get sensor readings intermittently. Whilst no new values are readily available, the RTU will continue to maintain the previous pump speed.
(a) (b)
Figure 6 – Testbed Normal Data Plot (a) vs Cyber-Attack Data Plot (b) Again, the components are displayed along the x-axis, with labels 1 to 6. The y-axis displays the operating capacity of the component. The exact behaviour induced by this experiment was relatively unknown. The results obtained showed that one tank kept filling whilst the other maintained the same level. Figure 6 displays box plots of the testbed data for normal behaviour and when in a cyber-attack scenario. The change in behaviour, as a result of the attack, can be seen in the average value changes in the datasets, as previously for the simulation dataset. Particularly a change in the output for P5 is visually apparent.
The data constructed during normal operation and under cyber-attack is used to assess the potential of the data to be used for cyber-security training and research. The data is
evaluated using data classification techniques to identify the nature and timing of the conducted cyber-attacks. The quality of the results produced by the testbed is compared with the data constructed through simulation.
C. Data Pre-Processing
Before data classification is performed, the data requires pre-processing. One of the main issues with the dataset generated by the simulation is the level of noise in the data. In order to achieve the highest possible results in the classification process, the noise needs to be reduced. This is achieved by editing or removing values from the dataset which are unwanted by the classifiers but constitute parts of the dataset which are of interest.
As a result of the behaviour of specific components in the system, there is a high level of zeros in the simulation dataset. The zeros are a result of either component failing due to introduced errors, or units of liquid in the system passing through a component faster than the sampling rate. Zeros, therefore, represent aspects such as pipes functioning normally. If the samples are consistently above zero for components, such as the water pipes, it would be the result of failures in the system. For that reason, the zero values are retained in our data set.
Data pre-processing and feature extraction are essential stages, and affect the data classification results. The features selected represent characteristics of system behaviour (Xu et al.,). The process of feature selection effectively minimises the dataset and presents a representation of the behaviour taking place in the data to the classifier. Primarily, the goal of the feature selection process has three clear benefits including data comprehension, increased efficiency and prediction performance.
Table 3 – Feature Construction
Mechanism Component Feature Construction Sample Rate Variable Extraction Total Time
C1 C2 C3 C4 C5 C6 4Hz Every Minute 1 Day
P1 P2 P3 P4 P5 P6 4Hz Every Minute 1 Day
• Data Comprehension: Extracting features from a data set allows for a better comprehension of what the data is representing.
• Efficiency: Reducing the amount of data being classified allows for faster processing, reducing time of learning and reducing memory use.
• Prediction: The performance of the classifiers is also improved through effective feature selection. Factors such as noise reduction and the elimination of irrelevant data enable the classifiers to be efficiently trained.
• The data manipulation process is the construction of feature vectors from significantly large normal and abnormal data sets. For this initial case study, the components themselves comprise the features, with the variables extracted every minute or 240 rows in the raw data. The data analysis is presented in the following subsection.
D. Data Analysis
In this section, data classification techniques are employed to assess the effectiveness of the data produced by the testbed for research purposed. Neural network classifiers are selected to assess the quality of the data produced. Previous research has used neural networks to successfully measure data quality (Tchorbadjieff et al.,). Hence, we will be using neural networks as a bench mark to assess the quality of the data produced, a comparison and discussion on the datasets is put forward.
In order to perform the classification of the data, a selection of classifiers where used, these include: back-propagation trained feed-forward neural network classifier (BPXNC), levenberg-marquardt trained feed-forward neural network classifier (LMNC), automatic neural network classifier (NEURC), trainable linear perceptron classifier (PERLC), voted perception classifier (VPC) and the random neural network classifier (RNNC) (Hyong et al.,). The classification experiments are run 30 times on the datasets. The reason the classification experiments are conducted 30 times is to account for errors and to give consistency. Statisticians identify that experiments conducted 30 times provide an adequate realistic average (Salkind et al.,).
In order to calculate the results, firstly, a Confusion Matrix determines the distribution of errors across all classes (Marom et al.,). The estimate of the classifier is calculated as the trace of the matrix divided by the total number of entries. Additionally, a Confusion Matrix highlights where misclassification occurs in experiment. In other words, it shows true positive (a), false positive (c), true negative (d) and false negative (b) values. Diagonal elements show the performance of the classifier, while off diagonal presents errors. This is displayed in Table 4. Table 4 – Confusion Matrix
+ -
+ a b
- c d
The results are calculated mathematically, using the following formulae, where a refers to True Positive, d implies True Negative and b and c refer to False Positive and False Negative respectively. N is the total number of feature vectors within the dataset.
(1)
(2)
(3) Tables 5 and 6 present the results of the classification process and include the success of the classification or Area under the Curve (AUC), sensitivity, specificity and error. Where specificity refers to normal system behaviour, sensitivity refers to abnormal (or attack behaviour) and accuracy represents the success of the classification. Each of the results are calculated using the above formulae.
Table 5 – Simulation Classification Results
Classifiers AUC Sensitivity Specificity Error
VPC 0.050 0.500 0.000 0.500 RNNC 0.850 0.769 1.000 0.150 PERLC 0.750 0.667 1.000 0.250 BPXNC 0.767 0.682 1.000 0.233 LMNC 0.833 0.750 1.000 0.167 NEURC 0.867 0.789 1.000 0.133
It is clear from the results in both tables, that the classifiers are able to detect accurately both the normal and abnormal behaviours in the data set. A discussion and comparison of the results is subsequently presented in the following section.
Table 6 – Testbed Classification Results
Classifiers AUC (%) Sensitivity Specificity Error
VPC 0.733 0.652 1.000 0.267 RNNC 0.850 0.818 0.889 0.150 PERLC 0.800 0.875 0.750 0.200 BPXNC 0.983 1.000 0.968 0.017 LMNC 0.997 0.997 0.997 0.033 NEURC 0.933 0.933 0.933 0.063 V. EVALUATION
Within the simulation classification results, the NEURC classifier is the most accurate; able to classify 86.7% of the data correctly with an error of 0.133. For the NEURC classifier 28 out of 30 normal behaviours are correctly classified. During the physical testbed classification process LMNC is to identify 99.67% of the behaviours accurately,
with an error of 0.0667. In the following subsection, a discussion is put forward on the significance of the results obtained.
A. Results Comparison
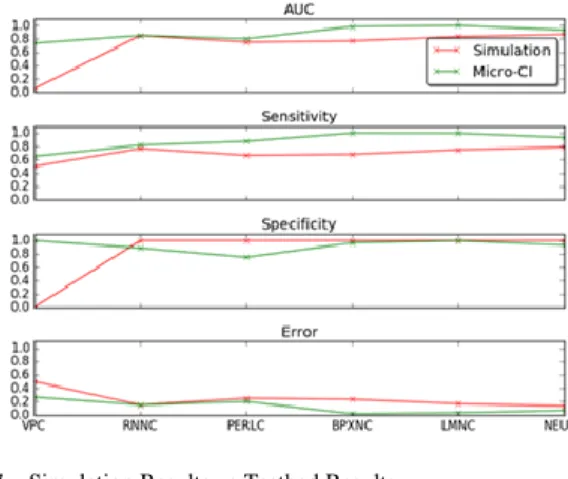
Figure 7 displays a comparison of the results achieved from the neural network classification. The graphs depict that the classifiers are able to more successfully identify threat behaviours using the Micro-CI testbed, rather than through a simulation approach. This is particularly the case for the sensitivity, AUC and error. In addition to the difference between the AUC results produced by the neural network classification, the specificity results, in particular, hold significance for the evaluation of the datasets.
Figure 7 – Simulation Results vs Testbed Results
A comparison between the specificity results (normal behaviours) show that the simulation approach results in 5/6 classifiers being able to identify 100% of normal behaviour; with most of the misclassification occurring for the sensitivity (the identification of abnormal/attack behaviour). Within the simulation approach, normal system behaviour is straightforward to identify, as the simulation behaviour doesn’t have significant changes in its operation and performs as coded to perform. In a ‘real-life’ environment, the physical system is set up to behave in a specific way but always functions slightly differently to the anticipated. This means that any research conducted using simulation to construct data is hampered by over classification for the specificity/normal behaviour dataset.
B. Testbed Attacks Comparison
As previously discussed, one of the aims of this project is to devise a testbed, which is suitable for cyber-security training and research. As demonstrated in the previous subsection, it is our belief that the use of real-life data is more suitable for cyber-security research, than that of simulation. The second part of the case study involves a demonstration of the two further datasets constructed through launching the following cyber-attacks on the Micro-CI testbed:
• Signal injection: Falsified malicious data is injected, masquerading as one of the flow sensors. This forces the
RTU to change the pumps’ settings to suit the malicious data. Specifically, a signal injection attack is launched against the water flow sensor on tank 2, in which we tell it there is no water leaving tank2. The water level drops, however, it drops slowly as the tank is still on a slow refill (as it is not full).
• DoS: One of the water level sensors is rendered completely inaccessible to the RTU by means of a DoS attack. This causes the RTU to labour to accurately control the pumping station, as the crucial data needed is unavailable. Specifically, a DoS attack was launched against the water level sensor in tank1, meaning the RTU is getting a result of 0, which misleads it into thinking the tank is empty, so the tank fills up much quicker.
• As such, Figure 8 below displays the resulting data output of the Micro-CI testbed pump speeds, during normal operation and when subjected to the three attacks discussed in this paper. Each of the experiments was conducted on an identical testbed.
Figure 8 – Simulation Attack Data Visualisation
The graphs display a clear change in behaviour as a result of the attacks taking place. The majority of the attacks are targeted at pump 2, where the separation of the datasets can be clearly identified. This is a demonstration of realistic data construction though use of the testbed. The RTU inclusion means that Micro-CI users have remote access to the functioning components. Different attack types produce diverse dataset outputs.
C. Physical Testbed Benefits
As a whole, modern education and research is becoming increasingly reliant on virtualised labs and tools (Topham et al.,). Despite the numerous benefits they offer, there are many inherent limitations. Therefore, any learning or research undertaken using these tools is based around the limitations and characteristics of such tools, as well as any assumptions made by their developers. Additionally, the accuracy of data resulting from such simulations and models may be further decreased if used outside of their intended usage scenario. For example, in network reconnaissance, a Christmas tree packet (a packet set with an unusual combination of TCP headers), can cause different operating
systems to respond in different ways (differing from defined IP standards). The disparity amongst these responses can be used to identify the underlying operating system. These types of unusual quirks can be utilised by attackers, and are often not something that is covered by simulation software. The practical element involved in the Micro-CI project introduces a level of realism that is difficult to match through simulation.
A recent report (Lewis et al.,) examined the usage of both physical and virtual tools and labs. The report concluded that a virtual-based approach offers significant cost savings and a self-paced and active approach to learning. However, it also highlighted that it has several key limitations including: no hands-on experience, no real-world training with specific equipment and no experience in identifying and interpreting incorrect or uncharacteristic data.
The findings of this report echo our concerns that simulation is very effective at representing “correct” behaviour. However, critical infrastructure systems need to be protected against situations where they are exposed to extreme abnormal events. Unfortunately, in such circumstances, systems will not always behave in the way expected, fail gracefully or consistently respond in the same manner. Similarly, it is therefore difficult to accurately model how a system’s erratic behaviour might affect other parts of the infrastructure. This is why we firmly believe that adopting Micro-CI’s unique approach would provide an ideal solution, as it allows for the advantages of both physical and virtual tools to be combined, some of which are discussed below.
• Pedagogical benefits: The Micro-CI approach offers students and researchers with hands-on experience and first-hand knowledge of the unpredictability of a system under attack or stress. It will also help them to refine their problem solving and practical skills.
• Cost effectiveness: The Micro-CI project has been designed to be as cost effective as possible. For example, at the time of writing, we estimate that at current prices, the design presented in this paper can be replicated for around £100.
• Portability: As the project components are on a miniaturised bench top scale, it enables them to be packed away, stored and transported with ease. In most cases, projects can still be moved and/or stored whilst partially assembled.
• Platform independency: The Micro-CI project does not require any specific requirements, dependencies or operating systems to interact with the testbeds developed. Additionally, it is not tied or restricted by any licencing model, so it can be used on an infinite number of different machines, without incurring additional costs.
As with all solutions, there are some drawbacks to our approach. The first is that the use of low cost hardware reduces the level of accuracy that can be achieved. For
example, the Arduino Uno uses an ATMega microcontroller, which is only capable of recording 4-byte precision in double values (Lewis et al.,). This can present problems if precision is a crucial part of the research being undertaken. However, this can be mitigated by purchasing more expensive hardware. Another, limitation is that in comparison to simulation software, the practical approach may require a greater level of improvement to students’ skillsets (which is not a detrimental attribute), and a longer initial construction time, to accomplish a working implementation.
VI. CONCLUSION AND FUTURE WORK
One of the main challenges for governments around the globe is the need to improve the level of awareness for citizens and businesses about the threats that exist in cyberspace. The arrival of new information technologies has resulted in different types of criminal activities, which previously did not exist, with the potential to cause extensive damage to internal markets.
Given the fact that the Internet is boundary-less, it makes it difficult to identify where attacks originate from and how to counter them. Improving the level of support for security systems helps with the evolution of defences against cyber-attacks. This project supports the development of critical infrastructure security research, in the fight against a growing threat from the digital domain.
The research project will further knowledge and understanding of information systems; specifically acting as a facilitator for cyber-security research. In our future work, we will publish the constructed testbed and make the datasets available for cyber-security and critical infrastructure research. In addition, we propose to add 2-3 cheap CHIPs/ Raspberry Pi’s to the testbed. In a real-world scenario, ICS systems are continually connected to a computing infrastructure. Therefore, with the addition of the PIs the following would be possible.
• Denote a Pi as the ‘Coorporation Firewall’. Behind the Firewall, there would be two systems: the existing ICS as well as another Pi, referred to as the ‘office computer’. External to the firewall, there should be another computer called ‘Target’. All three of these could be implemented using CHIPs. The additional cost of this implementation would be minimal (around £15 together).
This additional equipment would then enable further attack scenarios, such as:
• The office computer periodically surfs to the external ‘target’. Now the attacker could place a payload on the external computer. This would emulate a waterhole attack, which is quite common for spear phishing. With that, it would be possible to connect a mentioned threat to the test lab.
• As ICS are often part of a botnet, with this setup it would then also be possible to measure outgoing traffic
from the ICS to the external computer. That would make the DoS scenario increasingly realistic.
• Pivoting, i.e., lateral movement after the initial breach would also be testable with this setup.
This future implementation would move the testbed from pure IC testbed to IC within a company setup testbed. Such a testbed would be invaluable for education. In addition, the forthcoming work will involve making the construction design and instructions available to other researchers and students.
REFERENCES
A. A. Farooqui, S. H. Zaid, A. Y. Memon, and S. Qazi, Cyber Security Backdrop: A SCADA Testbed,” in Computing, Communications and IT Applications Conference (ComComAp), pp. 98 – 103, 2014.
A. McAfee Foundstone Professional Services and McAfee Labs, Global Energy Cyberattacks: Night Dragon, [Accessed January 2015, Available at http://www.mcafee.com/jp/resources/white-papers/wp-global-energy-cyberattacks-night-dragon.pdf], 2011.
A. S. Aragó, E. R. Martínez, and S. S. Clares, SCADA Laboratory and Test-bed as a Service for Critical Infrastructure Protection, in Proceedings of the 2nd International Symposium for ICS & SCADA Cyber Security Research, pp. 25–29, 2014.
A. Sawand, S. Djahel, Z. Zhang, and F. Nait-Abdesselam, Multidisciplinary approaches to achieving efficient and trustworthy eHealth monitoring systems,” in 2014 IEEE/CIC International Conference on Communications in China (ICCC), pp. 187–192, 2014.
A. Tchorbadjieff, Automatic data quality control for environmental measurements, Large-Scale Scientific Computing: 9th International Conference, LSSC, Springer, 2013.
B. Mukherjee, L. T. Heberlein, and K. N. Levitt, Network intrusion detection, IEEE Netw., vol. 8, no. 3, pp. 26–41, 1994.
C. Hyong Jin, Helen Lavretsky, Richard Olmstead, Myron J. Levin, Michael N. Oxman, Michael R. Irwin, Sleep Disturbance and Depression Recurrence in Community-Dwelling Older Adults: A Prospective Study, The American Journal of Psychiatry, December, 2008.
C. Queiroz, A. Mahmood, J. Hu, Z. Tari, and X. Yu, Building a SCADA Security Testbed, in Proceedings of the 3rd International Conference on
Network and System Security, pp. 357–364, 2009.
D. K. Hitchins, Secure systems - Defence in Depth, IEEE European Convention on Security and Detection, pp. 34-39, 1995
D. Lewis, I, The pedagogical benefits and pitfalls of virtual tools for teaching and learning laboratory practices in the Biological Sciences, HE Academy, 2014.
F. Aalamifar, A. Schlögl, D. Harris and L. Lampe, (2013), Modelling power line communication using network simulator-3, in Proceedings of Global Communications Conference (GLOBECOM), 2013.
G. Reichenbach., R. Göbel., H. Wolff., and S. S. von Neuforn, Risks and Challenges for Germany, Scenarios and Key Questions,Green Paper of the Forum on the Future of Public Safety and Security, 2008.
J. Stoll, B. Kemper and G. Lanza, Throughput analysis and simulation-based improvement of baked varnish stacking for automotive electric drives, in the Proceedings of the 4th International Production Conference on Electric
Drives, 2014.
K. Hill, The Terrifying Search Engine That Finds Internet-Connected Cameras, Tra_c Lights, Medical Devices, Baby Monitors and Power Plants - Forbes. [Available at: URL http://www:forbes:com/sites/ kashmirhill/2013/09/04/ shodan-terrifying-search-engine/], 2014
L. Topham, K. Kifayat, Y. A. Younis, Q. Shi and B. Askwith, Cyber Security Teaching and Learning Laboratories: A Survey, Information & Security: An International Journal, vol. 35, 2016.
M. Feily, A. Shahrestani, and S. Ramadass, A Survey of Botnet and Botnet Detection, in Proceedings of the 3rd International Conference on Emerging
Security Information, Systems and Technologies, pp. 268–273, 2009. M. Ficco, G. Avolio, L. Battaglia, and V. Manetti, Hybrid Simulation of
Distributed Large-Scale Critical Infrastructures, Intell. Netw. Collab. Syst., pp. 616–621, 2014.
M. Mafuta, M. Zennaro, A. Bagula, and G. Ault, Successful deployment of a Wireless Sensor Network for precision agriculture in Malawi, Proceedings of the Third IEEE International Conference on Networked Embedded Systems for Every Application (NESEA), pp. 1–7, 2012.
M. Merabti, M. Kennedy, and W. Hurst. Critical infrastructure protection: A 21st century challenge. In the Proceedings of the International Conference on Communications and Information Technology (ICCIT), pp. 1–6, 2011. N. J. Salkind, Statistics for people who (think they) hate statistics, Third Edition,
Sage Publications, 2008.
N. Marom, L. Rokach, and A. Shmilovici, Using the Confusion Matrix for Improving Ensemble Classifiers, Proceedings of the Twenty-Sixth IEEE Convention of Electrical and Electronics Engineers in Israel, pp. 000555– 000559, 2010.
P. Nowak, B. Sakowicz, G. Anders, and A. Napieralski, Intrusion Detection and Internet Services Failure Reporting System, Proceedings of the Second IEEE International Conference on Dependability of Computer Systems, pp. 185-190, 2007.
P. Li, Z. Wang, and X. Tan, Characteristic Analysis of Virus Spreading in Ad Hoc Networks, Proceedings of the International Conference on Computational Intelligence and Security Workshops (CISW 2007), pp. 538– 541, 2007.
R. Mitchell and I.-R. Chen. Behavior Rule Specification-Based Intrusion Detection for Safety Critical Medical Cyber Physical Systems, IEEE Trans. Dependable Secur. Comput., vol. 12, no. 1, pp. 16–30, 2015.
R. Poisel, M. Rybnicek, and S. Tjoa, Game-based Simulation of Distributed Denial of Service (DDoS) Attack and Defense Mechanisms of Critical Infrastructures, Proceedings of IEEE 27th International Conference on Advanced Information Networking and Applications, pp. 114–120, 2013. R. Sekar, T. Bowen, and M. Segal, on preventing intrusions by process behavior
monitoring. In Proceedings of the Symposium on Operating Sytem Design and Implementaion (OSDI II), 1999.
S. H. C. Haris, R. B. Ahmad, and M. A. H. A. Ghani, Detecting TCP SYN Flood Attack Based on Anomaly Detection, in Proceedings of the 2nd International Conference on Network Applications, Protocols and Services, pp. 240–244, 2010.
T. Benzel, R. Braden, D. Kim and C. Neuman, Experience with DETER: a testbed for security research, in Proceedings of the 2nd International
Conference on Testbeds and Research Infrastructures for the Development of Networks and Communities, 2014.
T. Morris, A. Srivastava, B. Reaves, W. Gao, K. Pavurapu, and R. Reddi, A control system testbed to validate critical infrastructure protection concepts, Int. J. Crit. Infrastruct. Prot., vol. 4, no. 2, pp. 88–103, Aug. 2011. Y. Zhang, F. Deng, Z. Chen, Y. Xue, and C. Lin. UTM-CM: A Practical Control
Mechanism Solution for UTM System, in Proceedings of the 2nd IEEE
International Conference on Communications and Mobile Computing, pp. 86-90, 2010.
Z. Xu, I. King, M. R.-T. Lyu, and R. Jin, Discriminative Semi-Supervised Feature Selection Via Manifold Regularization, IEEE Trans. Neural Networks, vol. 21, no. 7, pp. 1033–1047, 2010.
Z. L. H. Wei, G. Yajuan, and C. Hao, Research on information security testing technology for smart Substations, in Proceedings of the International Conference on Power System Technology (POWERCON), pp. 2492–2497, 2014.
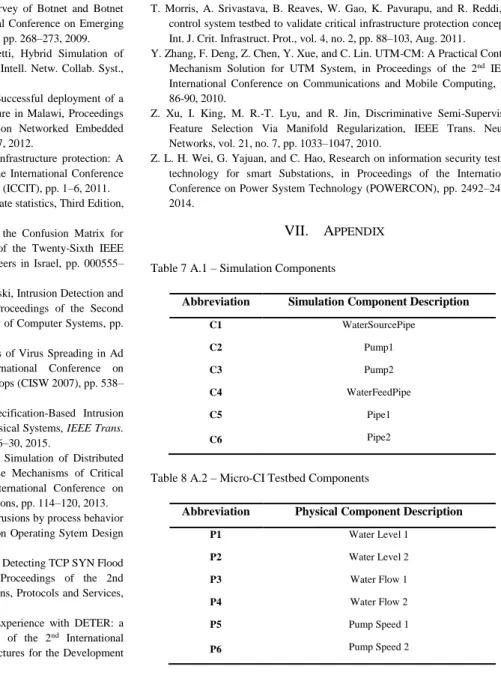
VII. APPENDIX Table 7 A.1 – Simulation Components
Abbreviation Simulation Component Description
C1 WaterSourcePipe C2 Pump1 C3 Pump2 C4 WaterFeedPipe C5 Pipe1 C6 Pipe2
Table 8 A.2 – Micro-CI Testbed Components
Abbreviation Physical Component Description
P1 Water Level 1 P2 Water Level 2 P3 Water Flow 1 P4 Water Flow 2 P5 Pump Speed 1 P6 Pump Speed 2