Title:
Root phenotyping pipeline for cereal plants
Author:
Michał Słota, Mirosław Małuszyński, Iwona Szarejko
Citation style:
Słota
Michał, Małuszyński
Mirosław, Szarejko
Iwona (2017).
Root phenotyping pipeline for cereal plants. W:
J. Jankowicz-Cieslak, T. Tai, J.
Kumlehn, B. Till (red.),
"Biotechnologies for plant mutation breeding : protocols"
(S. 157-172). Springer, DOI: 10.1007/978-3-319-45021-6_10
Root Phenotyping Pipeline for Cereal Plants
Michal Slota, Miroslaw Maluszynski, and Iwona Szarejko
Abstract The proposed system for the phenotypic analysis of root traits that is presented here enables the precise description of the root growth kinetics of cereal plants. The designed pipeline is composed of a drip irrigation system to supplement plants with a medium, a high-resolution root system scanning facility and a method for comprehensive image analysis. The system enables low-effort, accurate and highly repeatable analysis of features of the root system of cereal seedlings and young plants until the early tillering stage. This system employs an automatic drip irrigation line, which is controlled remotely by a programmable logic controller (PLC). The PLC adapter used facilitates the automated control of all system modules, thus allowing the rate of the medium flow to be adjusted for the supple-mentation of plants. The system employs measuring sensors for the continuous monitoring of the parameters of the culture medium. This continuous sensing of medium parameters can be applicable for mineral nutrition studies and abiotic stress response testing. The installed drip lines are injected into transparent acrylic tubes (500 mm high, 32/30 mm in outer and inner diameter, with a circular opening in the bottom of 3 mm in diameter) that are filled with glass beads. The acrylic tubes are placed in opaque cover tubes that permit the non-destructive observation of the growth of the root system. Enhanced imaging quality contributes to an increase in the precision of the results that are obtained in the course of the analysis of root parameters using specialised root scanners coupled with the WinRHIZO system. This novel phenotyping pipeline permits noninvasive observation of root system growth adjusted for the subsequent root image acquisition with a reduced back-ground noise. The method combines automated control of plant growth conditions with good imaging quality and high replicability of growth parameters.
Keywords Root system • Root system architecture • Hydroponics • Root phenotyping
M. Slota • M. Maluszynski • I. Szarejko (*)
Department of Genetics, Faculty of Biology and Environmental Protection, University of Silesia, Jagiellonska 28, 40-032 Katowice, Poland
e-mail:[email protected]
©International Atomic Energy Agency 2017
J. Jankowicz-Cieslak et al. (eds.),Biotechnologies for Plant Mutation Breeding, DOI 10.1007/978-3-319-45021-6_10
10.1
Introduction
10.1.1
Issue of Root Phenotyping
The analysis of root system growth and development remains a challenge in the area of plant phenotyping. Classical root phenotyping approaches in the field are extremely laborious and require a considerable effort to properly characterise the root system architecture under natural conditions (B€ohm1979). Root systems of field-grown plants form extensive networks in the soil, which can hinder their extraction and proper observation (Zhu et al.2011). Excavation techniques, includ-ing soil cores and soil profiles, must be applied to study root systems under such conditions (Prasanna et al.2013). By contrast, root system studies carried out under greenhouse or growth chamber conditions offer a more homogeneous experimental setting due to the ability to better control the environmental variables. Nonetheless, greenhouse-based assays of root phenotyping still remain time-consuming and labour-intensive when a soil substrate is applied for plant growth. Soil-based root phenotyping experiments are extremely limited by the difficulty of observing root growth and development without the disruption of the surrounding soil core (Menon et al. 2007). Moreover, the rooting volume of plants growing in pots of varying sizes significantly influences the calculated root system volume (Poorter et al.2012). Therefore, multiple experimental setups for the in vitro screening of plant root traits have been developed. To facilitate the visualization of root growth, plants can be grown in hydroponic cultures, on surfaces of agar or paper or in clear gel media in transparent containers (Zhu et al.2011). Most of these methods are restricted to relatively young plants, which may not directly correlate with the architecture of the fully developed root system (Zhu et al.2011). The application of in vitro assays in plant phenotyping can also lack the capability of imitating the complex natural conditions and can frequently cause stress itself. Root screening assays that involve gel media tend to expose roots to light and may cause hypoxia (Zhu et al.2011). On the other hand, much progress has recently been made in the investigations of the roots of small plants on agar plates, which can easily be adopted for the purpose of automated large-scale growth screening (Nagel et al.2009; Yazdanbakhsh and Fisahn2009).
10.1.2
Root Phenotyping of Cereal Plants
Cereals have a fibrous root system that is composed of embryonic roots and adventitious (crown) roots that emerge postembryonically (Smith and De Smet
2012). Isolated embryonic roots are formed in the early stage of plant development, which are initially the only roots that allow water uptake from the soil. Embryonic roots penetrate the soil deeply and have numerous lateral roots. During late devel-opment, plants produce a smaller number of thicker and less branched adventitious
roots that grow beneath the soil but that do not penetrate the deeper layers (Coudert et al.2010). A specific spatial and temporal pattern of the root growth of monocots poses a challenge for high- or moderate-throughput root phenotyping. The complex root systems of monocotyledonous plants require special efforts in order to main-tain the equilibrium between the analysis throughput and imaging resolution. As the throughput of a screening method increases, it causes a reduction in the accuracy and precision of the measurements (Cobb et al. 2013). The process of high-throughput phenotyping depends on a combination of specialised techniques for plant growth, imaging and image analysis (Clark et al. 2013). Many screening techniques have been applied for rapid and reproducible measurements under controlled conditions, including aeroponics, hydroponics, wax-petrolatum layer, soil-filled chambers or pipes (Prasanna et al.2013). It is necessary to consider the degree to which a root phenotype will be expressed in the target experimental conditions. Manual techniques remain reliable for small experiments that involve simple measurements with fewer replicates (Clark et al.2013). However, there is a growing interest in exploring new techniques in order to capture and extract phenotypes from a larger number of plants with greater precision and reduced subjectivity (French et al.2009). It is essential to adjust a plant growth system to the purpose of the image capture. The key to maintaining precision in a phenotyping experiment is to employ a stable instrument setup that can effectively ensure imaging quality (Cobb et al.2013). Image acquisition that employs digital cameras or scanners for the purpose of imaging is straightforward for non-soil grown plants. By contrast, plants grown in a soil substrate must either be separated from the soil or imaged using minirhizotron tubes for two-dimensional (2D) image capture (Zhu et al.2011). Several root screening approaches involve the application of three-dimensional (3D) imaging techniques. The most promising technique for noninvasive 3D imaging in soil is X-ray computed tomography (CT) and magnetic resonance imaging (MRI) (Metzner et al. 2015). There are also other applicable approaches that include selective plane illumination microscopy (SPIM) and opti-cal projection omography (OPT) that are adapted for plants grown in transparent media (Downie et al. 2012). Regardless of the method that is used for image acquisition, it is essential to properly analyse the data obtained in a reproducible manner. Large image datasets require the application of novel software solutions in order to process and extract meaningful estimates of phenotypic variation. Most image analysis tools employ predefined processing and analysis methods in semi-automatic and semi-automatic procedures in order to quantify multiple phenotypes from single images or groups of images (Cobb et al.2013). Numerous commercial and open-licence software packages have been developed to solve specific tasks (Lobet et al.2013).
10.1.3
Proposed Root Phenotyping Pipeline
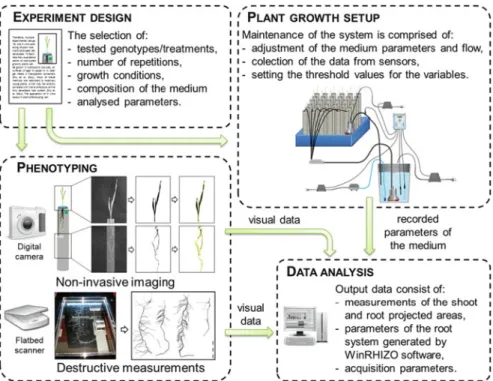
In spite of all of the progress that has been made in the field of plant root phenotyping, there is still a gap between the complex, multifunctional commercial platforms which have been developed for high throughput and precision screening and the simpler root phenotyping protocols which can be adjusted for specific plant species and screening assay. The described protocol offers the possibility to develop the moderate-throughput, reliable and cost-effective method that would facilitate the precise characterisation of the root system architecture in cereals. The system employs an automatic drip irrigation line which transports a medium solution to individual plants. Thus, the designed system offers a possibility to carry out mineral nutrition studies by altering the composition of aqueous medium. The watering pumps which supplement the plants with a medium can be placed in the separate tanks containing differed medium variants. The plant growth system provides randomised conditions maintained in an automated manner. A built-in programmable logic controller (PLC) computer provides a controllable power-line access for the connection of all of the system accessories (water pumps, air pump, heating device) as well as collects data from external sensors (temperature sensor, pH/redox or other ion-selective electrodes). This setup facilitates the monitoring of culture medium parameters (pH, temperature, redox potential) and the generation of different time-lapse graphs of the changes in parameters. Due to the application of the glass beads as a substrate which provides the mechanical impedance for root growth, the parameters such as a total root length and a density of lateral roots have higher values compared to plants grown under conventional hydroponic conditions. The imaging of root systems can be performed in a destructive (with a use of the flatbed scanners coupled with the WinRHIZO software) as well as a non-destructive manner (using a digital camera for the image acquisition). The measurements of the root system which are acquired using the proposed system were demonstrated to be reproducible within the biological repetitions of the tested barley genotypes in each replication of the experiment. The robustness of the system maintenance has been repeatedly tested and optimised (seeNotes 1 and 2, and Table10.3). The novel protocol for the root phenotyping of cereal plants presented here consists of a complete pipeline for maintaining plant growth combined with image acquisition and data analysis methods (Fig.10.1).
10.2
Materials
10.2.1
Design of a Plant Growth System
Note:The description of the functioning of the system refers to the numbering of its components in Figs.10.2a and b.
1. The system uses an automatic drip irrigation line that is controlled remotely by the programmable logic controller (PLC).
2. The PLC adapter coupled with a PLC computer (Fig. 10.2; 13) enables the automated control of all of the system modules: water pumps, air pumps and heating devices. It offers a power-line access for water and air pump trans-formers (Fig.10.2;1and2).
3. Medium flow is maintained by adjusting the afferent (Fig.10.2;3) and efferent pumps (Fig.10.2;11). The PLC adapter allows the independent programming of the afferent and efferent pumps, which can operate in a continuous or discontinuous module with preset time intervals.
4. The afferent pumps are placed in opaque canisters (Fig.10.2;4) with a water level indicator for medium storage. When the canister is filled with the medium, a pH electrode and a thermal sensor are injected to each canister. 5. Aerating pipes (Fig. 10.2; 6) are inserted into the medium canisters for the
proper aeration of the medium solution by the air pumps (Fig.10.2;5). 6. The system is equipped with measuring sensors for the continuous monitoring
of the parameters of the culture medium: temperature, pH, redox state, and concentration of specific ions.
Fig. 10.1 The overview of the pipeline for the preparation of phenotyping experiments. The pipeline consists of the following stages: experiment design, maintaining the growth setup, plant phenotyping and the data acquisition and analysis
Fig. 10.2 Overview of the plant growth system. Schematic layout (a) and photographs (b) of the watering system that consists of a transformer for an afferent pump (1), a transformer for an efferent pump (2), an afferent water pump (3) placed in the canister with the culture medium (4), air pumps (5), an aerating pipe (6), a supply pipe (7), a distributor with 12 outlets (8), distribution pipes (9), acrylic tubes filled with a substrate (10), an efferent pump placed on the bottom of a stackable box (11), drain tubing (12), a tablet connected to a PLC adapter (13), a pipe peg (14), a distribution pipe with a plastic tip (15), an acrylic tube filled with glass beads (16)
7. PLC-controlled experimental conditions can be monitored, and all of the medium flow parameters can be modified by setting the desired threshold values. The solution that is applied allows the water flow efficiency to be adapted for the current capacity of the experiment that is being conducted. 8. Supply pipes (Fig.10.2;7) transfer the medium to water distributors (Fig.10.2;
8) connected to drip lines (Fig.10.2;9). Each drip pipe capped with a plastic tip (Fig.10.2;15) is attached to the pipe pegs (Fig.10.2;14) and inserted into the acrylic tubes which are filled with glass beads (Fig.10.2;16).
9. The transparent tubes are placed into opaque cover tubes to protect the roots from the light. Transparent, 3-mm soda-lime glass beads (Sigma, Cat. No. Z265926-1EA) allow for the noninvasive observation of root system growth. This substrate also facilitates the root system cleaning, which improves the final image quality.
10. The acrylic tubes, which are equipped with a bottom drainage opening to ensure the proper draining of the medium, are placed together in a stackable box. The excess medium is drained off from the bottom of the box into the medium canister by efferent pumps through the drain tubing (Fig.10.2;11).
10.2.2
Root Scanning Setup
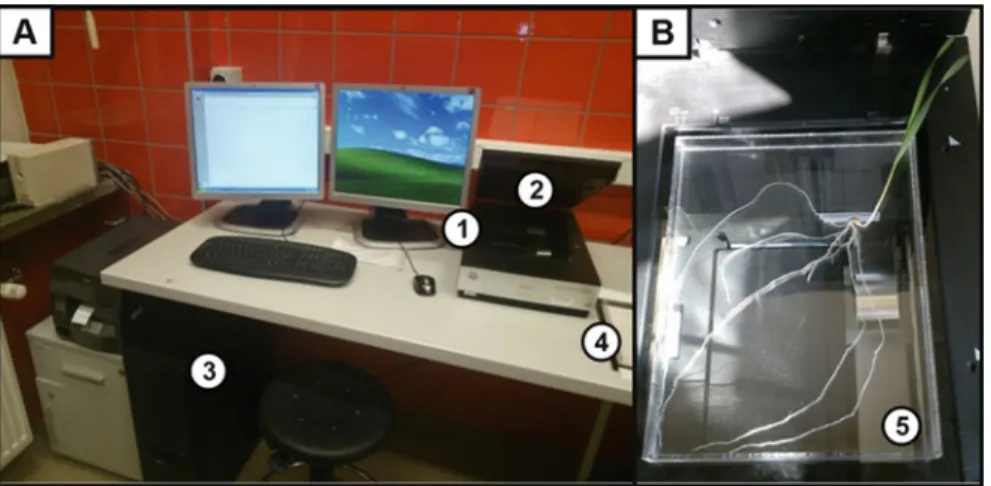
Note:The root scanning setup employs an STD4800 scanner (Regent Instrument) and an Epson Perfection V700 photo scanner equipped with the WinRHIZO System. For additional guidelines, please refer to the operating instructions for the STD4800 scanner and the WinRHIZO technical manuals. The description of the system’s setup uses the numbering of its components in Figs.10.3a and b. 1. The scanner (Fig.10.3;1) should be installed on a vibration-free table to avoid
any image noise. The scanner has an additional transmissive lighting system—a transparency unit (TPU). The reflective white plastic in front of the scanner cover must be removed to scan with the TPU light (Fig.10.3;2).
2. The scanner should be connected to a PC with a USB2 cable (Fig.10.3;3). All of the necessary drivers and analysis software are provided with the system. 3. A positioning system (Fig.10.3;4) is to be used to adapt the scanner for scanning
plant roots. The positioning system is made of semiopaque plastic blocks to accommodate different scan area sizes.
4. Translucent waterproof trays (Fig.10.3;5) that match the positioned scan areas are supplied with the system for scanning immersed objects. An appropriate tray should be placed within the positioning system.
5. When applying the trays, spacers should be installed to raise them to the height of the TPU cover.
10.3
Methods
10.3.1
Preparation of Culture Media
1. Use the following ingredients to prepare the culture medium (the catalogue numbers that are used refer to the Sigma–Aldrich product line):
• Ammonium phosphate monobasic (NH4H2PO4), Cat. No. 216003
• Potassium nitrate (KNO3), Cat. No. P8291
• Calcium nitrate tetrahydrate (Ca(NO)34H2O), Cat. No. 31218
• Magnesium sulphate heptahydrate (MgSO47H2O), Cat. No. 63140
• Boric acid (H3BO3), Cat. No. 202878
• Manganese chloride tetrahydrate (MnCl24H2O), Cat. No. 221279
• Zinc sulphate heptahydrate (ZnSO47H2O), Cat. No. 204986
• Molybdic acid (H2MoO4H2O), Cat. No. 232084
• Copper sulphate pentahydrate (CuSO45H2O), Cat. No. 209198
• Ferric sodium ethylenediaminetetraacetate (NaFeEDTA), Cat. No. E6760 All of the chemical compounds used should be chemically pure for the purpose of analysis (AR signature—analytical reagent).
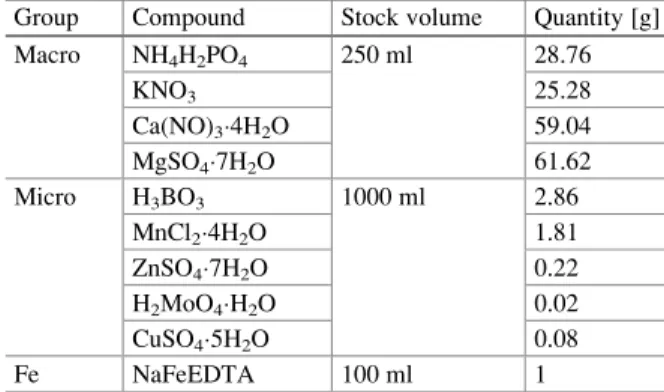
2. Use specified quantities of each compound for the preparation of the medium stocks (macro, micro and Fe) (Table10.1).
3. Dissolve all compounds in deionised water and autoclave the stocks at 121C, 1.1 bar for 45 min.
4. Store all medium stocks at 4C.
Fig. 10.3 Imaging setup for root analysis. The PC (a) is connected to the scanner (b) with a TPU lighting system. The scanner (1) with the cover removed (2) is connected to the PLC computer (3). The WinRHIZO system accessories consist of a scanner positioning system (4) and a translucent waterproof tray (5)
5. Adjust the pH of the medium at 5.9–6.1 using 1 N NaOH (Sigma, Cat. No. 221465).
6. Prepare the medium in advance in an opaque canister with a tap and a water level indicator and store them at 4C.
10.3.2
Controlling the System and Monitoring the Medium
Parameters
Note:The automatic drip irrigation system is controlled by a programmable logic controller (PLC) that provides a convenient power-line access for the connection of all of the system’s peripherals. The PLC adapter is also equipped for the continuous sensing of parameters of the culture medium. For additional guidelines, please refer to the operating instructions for the applied PLC adapter.
1. The afferent pumps, efferent pumps and air pumps should be connected to the power-line adapter. The adapter has six 230 V outputs for connecting the programmable devices. Use submersible water pumps (4) with a maximal operating pressure of 1 bar (14 psi) and a maximal flow of 250 l/h with three outlets. Use air pumps (2) with a minimal oxygen flow of 320 l/h. For additional guidelines on assembling the pumps, please refer to the technical manual from the pumps supplier.
2. The PLC adapter (Fig. 10.4a) can be programmed using in-system program-ming (ISP) and in-application programprogram-ming (IAP). For setting the switch on/off times of the defined outputs, program the PLC adapter directly or use the PLC software for PCs (Fig.10.4b).
3. Define the switch on/off times of the outputs using the software that is pro-vided. Select theTools menuand browse theOutput parameters.
4. Define the length of the switch on time and switch off time interval for the device.
Table 10.1 Hoagland medium composition (Hoagland and Arnon,1950)
Group Compound Stock volume Quantity [g] Macro NH4H2PO4 250 ml 28.76 KNO3 25.28 Ca(NO)34H2O 59.04 MgSO47H2O 61.62 Micro H3BO3 1000 ml 2.86 MnCl24H2O 1.81 ZnSO47H2O 0.22 H2MoO4H2O 0.02 CuSO45H2O 0.08 Fe NaFeEDTA 100 ml 1
5. Connect the PLC adapter with the PLC computer using a USB cable.
6. Import the selected parameters to the PLC device by choosing theTools menu/
Output parameters/Send to device.
7. Connect two pH electrodes (pH range 5–9) to the PLC device.
8. Calibrate the pH electrodes separately using the PLC adapter menu. Press the OK button for 2 s. Press SET to choose the desirable calibrating parameter (pH4, pH9, temperature) for each electrode. Insert a calibrating electrode into appropriate buffer (ph4, pH9). Wait for about 1 min to ensure that you get a stable measurement and press the OK button to save the result. The calibrating process can be terminated by pressing the ESC button.
9. Calibrate the temperature sensor using the same option as described in point 8 using a conventional thermometer measurement as a reference.
10. The measurement data from the pH electrodes and temperature sensors can be exported in the .csv format. To import the data choose theTools menu/ Param-eters settings/Load from device.
10.3.3
Experiment Preparation and Maintenance
1. Autoclave the appropriate amount of soda-lime glass beads, 48 acrylic tubes and any necessary laboratory glassware. The autoclave program should be applied as follows: 121C, 1.1 bar, 45 min.
2. Sterilise grains in a 5 % solution of sodium hypochlorite (Sigma, Cat. No. 71696) for 15 min. Remove the sodium hypochlorite solution and wash grains with sterile water 3 times for 5 min.
Fig. 10.4 Programmable logic controller (PLC) for the watering system control (a) and dedicated software for the continuous acquisition of the parameters of the culture medium (b)
3. Plant the grains in sterile square plastic 120120 mm Petri plates (Gosselin, Cat. No. BP124-05) filled to mid level with sterile moist vermiculite or filter paper. Incubate the grains at 4C for 24 h and then transfer the plates to an incubator at 24–25C for the next 48 h.
4. Fill 48 acrylic tubes with soda-lime glass beads leaving a space of approxi-mately 5 cm at the top.
5. Transplant the germinated seedlings into the acrylic tubes and replenish them with an additional portion of soda-lime glass beads leaving a space of approx-imately 1 cm at the top.
6. Place the distributor pipes that are capped with plastic tips that are attached to the pipe pegs near the edges of the tube and cover the top opening of it with a piece of cotton wool.
7. Fill the medium container with the appropriate amount of the medium. 8. Check all of the tubing connections and plug the water and air pump
trans-formers into the power line that is connected to the PLC computer.
9. Start the pumps and set the water and air pumps programs using the PLC software.
10. Place the system into a growth chamber under controlled conditions: temper-ature 22/20C during the day/night, photoperiod 16/8 h and illumination of 320 μmol m 2 s 1. Supplement the plants with the medium for the entire duration of the experiment (14 days).
11. Replace the medium in the medium canister every 4 days.
10.3.4
Medium Exchange
1. Use an additional submersible water pump with a maximal operating pressure of 1 bar (14 psi) and a maximal flow of 250 l/h.
2. Before beginning the medium exchange, make sure that the drip irrigation system is paused using the PLC adapter.
3. Attach a single supply pipe to one of the three water connections. Close the remaining water connections by screwing on the end caps.
4. Place the other end of the supply pipe that is connected to the water pump onto the water draining system.
5. Submerse the pump inside the medium canister.
6. Connect the medium discharge pump to the transformer and plug it directly into the power supply. Keep the pump turned on until the medium canister is completely emptied.
7. Attach a rubber pipe to the tap of the medium supply canister. Place the end of the pipe into the empty canister and turn the tap on. The medium supply container should be placed above the medium exchange containers for it to work effectively.
8. Leave the tap turned on until the medium canister is refilled. 9. Repeatsteps 5–7for the second medium canister.
10. After exchanging the medium in both canisters, turn on the drip irrigation system again.
10.3.5
Experiment Termination and Root System Cleaning
1. After the experiment is completed, stop the drip irrigation line using the PLC adapter.
2. Carefully disconnect the drip pipes and remove the acrylic tubes from the cover tubes.
3. Remove the piece of cotton wool that is covering the tube opening.
4. Carefully remove the plant after moistening the substrate and pouring the water through bottom drainage opening with a syringe (100 ml) or a beaker.
5. Rinse the plant root system with tap water above the sieve to remove the remaining glass beads. The extracted seedlings should be kept wet. Keep the plants in tap water in properly marked 50 ml conical centrifuge tubes until the roots are scanned using the WinRHIZO system.
6. The time period preceding the root system analysis should be kept to a minimum.
10.3.6
Root System Analysis Using WinRHIZO System
Note:For additional extensive guidelines, please refer to the WinRHIZO technical manual.
1. Before the beginning the analysis, make sure that the STD4800 scanner is connected to the PC with a USB2 cable and that all of the necessary drivers and analysis software are installed.
2. Cut the roots of a single plant using a sharp pair of scissors in order to separate all of the embryonic roots.
3. Place the roots (1–2 embryonic roots at a time) on a waterproof tray (Regent Instruments). The roots should be entirely immersed in water. If necessary refill the tray with tap water.
4. Position the roots in order to avoid any overlapping lateral roots and ensure that they are distributed randomly.
5. Before starting the WinRHIZO software, the personal protection key should be connected to the USB port.
6. Start the WinRHIZO software and select the EPSON Perfection V700/V750 TWAIN as the source.
7. After opening the WinRHIZO program, select the image acquisition parame-ters by entering the menu Image Acquisition Parameters. Choose the option
8. Perform the analysis by pressing the Acquisition iconin order to digitise the roots and wait a few seconds for the scan to complete (40–60 s). A progress bar will be displayed during the scanning process.
9. Highlight a specific area on the image that is displayed in theImage Areafor the measurement of the selected part of the image.
10. Enter a sample name within theSample identification window.
11. Create a data export file or open an existing directory. All of the measurements will be recorded (in .txt extension) within the selected directory until the software is closed.
10.3.7
Root Image Analysis
Note:For additional extensive guidelines please refer to the WinRHIZO technical manual.
1. Initiate the analysis module (after the scanner is disconnected) of WinRHIZO software.
2. Begin an image analysis of the existing root scan by selecting the appropriate file directory and pressing theAnalysis icon.
3. Enter the sample information data in theSample identification window that is displayed. The data repository that was created will record all of the data of the analyses that are conducted.
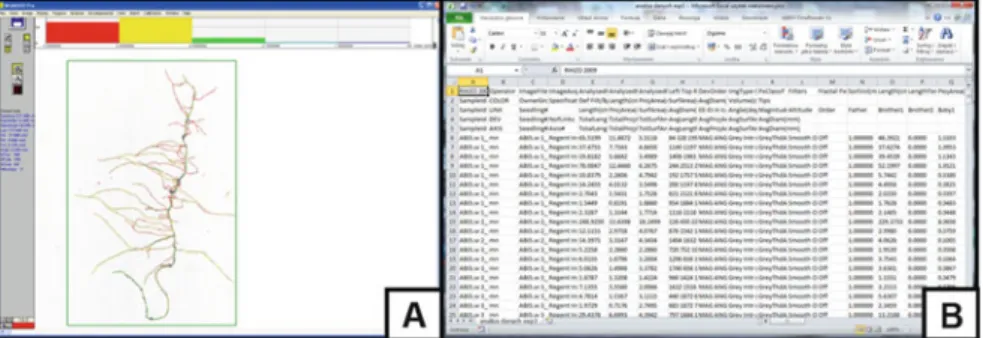
4. Modify (if necessary) the root diameter classes using theGraphic areamenu above the displayed image (Fig.10.5a).
5. Click the horizontal axis to change the classification type in terms of the width of the classes.
6. Save the measurement output data file in a .txt file (Fig.10.5b) and import it into MS Excel or an equivalent program for further data analysis. The parameters that are generated as a result of the scanning process include: total length of the root
Fig. 10.5 Data analysis of root images using the WinRHIZO system. Image Area of the scanned root displayed in WinRHIZO software (a) and an MS Excel spreadsheet (b) after importing the .txt file with the measurement data
system [cm], root system surface [cm2], root system volume [cm3], root diameter [mm] and the number of tips. All measurements which can be conducted using the WinRHIZO software and non-destructive techniques for root and shoot imaging in time series are summarised in Table10.2.
10.4
Notes
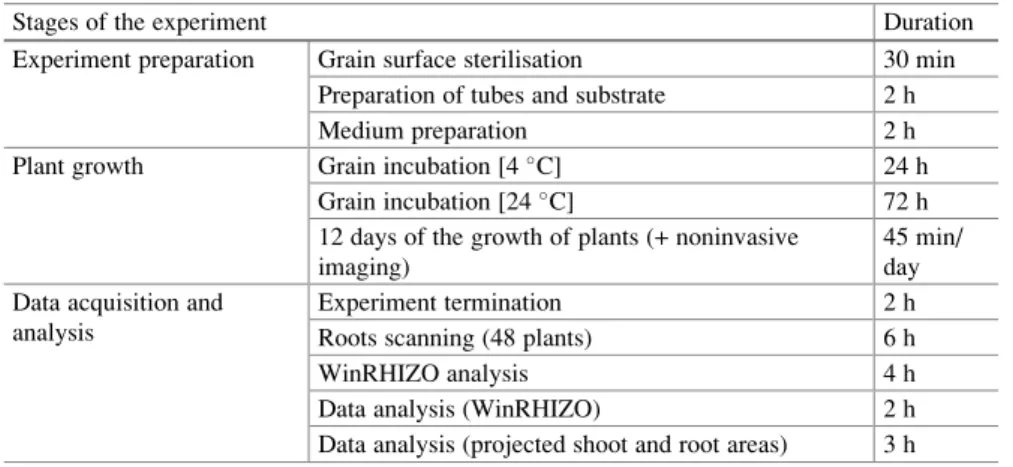
1. The subsequent stages of the preparation of an experiment indicating required time are presented in Table 10.3 (the robustness of the system relates to the experiment carried on 48 plants).
Table 10.2 List of the parameters that can be measured using the system
Organ Measurements Units Destructive Shoot Projected shoot area cm2 No
cm2 No
Shoot height cm No
Root Root system depth cm No
Projected root area cm2 No Total length of the root system
WinRHIZO
cm Yes Projected root surface cm2 Yes Average root diameter mm Yes Root surface area cm2 Yes
Root volume cm3 Yes
Number of root tips – Yes
Number of root forks – Yes
Table 10.3 Stages of the experiment in terms of their time-consuming
Stages of the experiment Duration
Experiment preparation Grain surface sterilisation 30 min Preparation of tubes and substrate 2 h Medium preparation 2 h Plant growth Grain incubation [4C] 24 h
Grain incubation [24C] 72 h 12 days of the growth of plants (+ noninvasive
imaging)
45 min/ day Data acquisition and
analysis
Experiment termination 2 h Roots scanning (48 plants) 6 h WinRHIZO analysis 4 h Data analysis (WinRHIZO) 2 h Data analysis (projected shoot and root areas) 3 h
2. WinRHIZO software can generate two types of files—Images and Data. The commands for each of these can be found in the Image and Data menus, respectively. Image files can be saved in the .tiff format, which can be read by most image-based software packages. Analysis data are saved in the ASCII text format and have the .txt extension.
Acknowledgments Funding for this work was provided by the Food and Agriculture Organiza-tion of the United NaOrganiza-tions and the InternaOrganiza-tional Atomic Energy Agency through their Joint FAO/IAEA Programme of Nuclear Techniques in Food and Agriculture through Research Con-tract No. 15419 of IAEA Coordinated Research Project D24012 and the Polish Ministry of Science and Higher Education (Grant No. 2080/IAEA/2011/0 and 2557/FAO/IAEA/2012/0).
Open Access This chapter is distributed under the terms of the Creative Commons Attribution-Noncommercial 2.5 License (http://creativecommons.org/licenses/by-nc/2.5/) which permits any noncommercial use, distribution, and reproduction in any medium, provided the original author (s) and source are credited.
The images or other third party material in this chapter are included in the work’s Creative Commons license, unless indicated otherwise in the credit line; if such material is not included in the work’s Creative Commons license and the respective action is not permitted by statutory regulation, users will need to obtain permission from the license holder to duplicate, adapt or reproduce the material.
References
B€ohm W (1979) Methods of studying root systems. Springer, Berlin, pp. 2–19
Clark RT, Famoso AN, Zhao K, Shaff JE, Craft EJ, Bustamante CD, McCouch SR, Aneshansley DJ, Kochian LV (2013) High-throughput 2D root system phenotyping platform facilitates genetic analysis of root growth and development. Plant Cell Environ 36(2):454–466 Cobb JN, DeClerck G, Greenberg A, Clark R, McCouch S (2013) Next-generation phenotyping:
requirements and strategies for enhancing our understanding of genotype–phenotype relation-ships and its relevance to crop improvement. Theor Appl Genet 126(4):867–887
Coudert Y, Pe´rin C, Courtois B, Khong NG, Gantet P (2010) Genetic control of root development in rice, the model cereal. Trends Plant Sci 15(4):219–226
Downie H, Holden N, Otten W, Spiers AJ, Valentine TA, Dupuy LX (2012) Transparent soil for imaging the rhizosphere. PLoS One 7(9):e44276. doi:10.1371/journal.pone.0044276
French A, Ubeda-Toma´s S, Holman TJ, Bennett MJ, Pridmore T (2009) High-throughput quan-tification of root growth using a novel image-analysis tool. Plant Physiol 150(4):1784–1795 Hoagland DR, Arnon DI (1950) The water-culture method for growing plants without soil. Circ
Calif Agric Exp Station 347:1–32
Lobet G, Draye X, Pe´rilleux C (2013) An online database for plant image analysis software tools. Plant Methods 9:38. doi:10.1186/1746-4811-9-38
Menon M, Robinson B, Oswald SE, Kaestner A, Abbaspour KC, Lehmann E, Schulin R (2007) Visualization of root growth in heterogeneously contaminated soil using neutron radiography. Eur J Soil Sci 58(3):802–810
Metzner R, Eggert A, van Dusschoten D, Pflugfelder D, Gerth S, Schurr U, Uhlmann N, Jahnke S (2015) Direct comparison of MRI and X-ray CT technologies for 3D imaging of root systems in soil: potential and challenges for root trait quantification. Plant Methods 11(1):17
Nagel KA, Kastenholz B, Jahnke S, Van Dusschoten D, Aach T, M€uhlich M, Daniel Truhn D, Scharr H, Terjung S, Walter S, Schurr U (2009) Temperature responses of roots: impact on growth, root system architecture and implications for phenotyping. Funct Plant Biol 36 (11):947–959
Poorter H, Fiorani F, Stitt M, Schurr U, Finck A, Gibon Y, Usadel B, Munns R, Atkin OK (2012) The art of growing plants for experimental purposes: a practical guide for the plant biologist. Funct Plant Biol 39(11):821–838
Prasanna BM, Araus JL, Crossa J, Cairns JE, Palacios N, Das B, Magorokosho C (2013) High-throughput and precision phenotyping for cereal breeding programs. In: Gupta PK, Varshney RK (eds) Cereal Genomics II. Springer, Netherlands, pp. 341–374
Smith S, De Smet I (2012) Root system architecture: insights from Arabidopsis and cereal crops. Philos Trans R Soc B: Biol Sci 367(1595):1441–1452
Yazdanbakhsh N, Fisahn J (2009) High throughput phenotyping of root growth dynamics, lateral root formation, root architecture and root hair development enabled by PlaRoM. Funct Plant Biol 36(11):938–946
Zhu J, Ingram PA, Benfey PN, Elich T (2011) From lab to field, new approaches to phenotyping root system architecture. Curr Opin Plant Biol 14:310–317