Government of Malawi
Malawi AIDS Response Progress Report
2015
ii
CHAPTER I: STATUS AT A GLANCE ... 1
1.1. INTRODUCTION ... 1
1.2. STATUS OF THE EPIDEMIC ... 2
1.3. THE POLICY AND PROGRAMMATIC RESPONSE ... 2
1.4. INCLUSIVENESS OF THE STAKEHOLDERS IN THE REPORT WRITING PROCESS ... 5
1.5. OVERVIEW OF GARPR AND HEALTH SECTOR HIVINDICATORS ... 5
CHAPTER II: OVERVIEW OF THE AIDS EPIDEMIC ... 21
2.1. HIVPREVALENCE IN THE GENERAL POPULATION ... 21
2.2. HIV PREVALENCE IN HIGH RISK GROUPS ... 22
2.3. HIV PREVALENCE IN MEN WHO HAVE SEX WITH MEN ... 23
2.4. ESTIMATES OF THE BURDEN OF HIV IN MALAWI... 24
CHAPTER III: NATIONAL RESPONSE TO THE AIDS EPIDEMIC... 25
3.1. INTRODUCTION ... 25
3.2. PREVENTION ... 25
3.3. TREATMENT, CARE, AND SUPPORT ... 37
3.4. GENDER-BASED VIOLENCE ... 47
3.5. FINANCIAL RESOURCES FOR THE NATIONAL RESPONSE ... 50
CHAPTER IV: BEST PRACTICES ... 55
4.1. THE DELIVERY OF OPTION B+ ... 55
4.2. THE ART PROGRAMME ... 55
4.3. AVAILABILITY OF BIOMEDICAL DATA ... 55
4.4. TASK SHIFTING ... 56
4.5. EXISTENCE OF AN EFFECTIVE NATIONAL COORDINATING MECHANISM FOR HIV AND AIDS ... 56
CHAPTER V: MAJOR CHALLENGES AND REMEDIAL ACTIONS ... 58
5.1. PROGRESS MADE ON THE KEY CHALLENGES REPORTED IN THE 2013PROGRESS REPORT ... 58
5.2. MAJOR CHALLENGES EXPERIENCED IN 2014 AND REMEDIAL ACTIONS PLANNED ... 58
CHAPTER VI: SUPPORT FROM THE COUNTRY’S DEVELOPMENT PARTNERS ... 61
6.1. KEY SUPPORT FROM DEVELOPMENT PARTNERS ... 61
6.2. ACTIONS NEEDED BY DEVELOPMENT PARTNERS TO ENSURE ACHIEVEMENT OF TARGETS... 61
CHAPTER VII: MONITORING AND EVALUATION ENVIRONMENT... 64
7.1. AN OVERVIEW OF THE CURRENT MONITORING AND EVALUATION (M&E) SYSTEM ... 64
7.2. CHALLENGES FACED IN THE IMPLEMENTATION OF A COMPREHENSIVE M&E SYSTEM ... 65
7.3. REMEDIAL ACTIONS PLANNED TO ADDRESS THE M&E CHALLENGES BEING EXPERIENCED... 66
7.4. THE NEED FOR M&E TECHNICAL ASSISTANCE AND CAPACITY-BUILDING ... 66
ANNEX 1: CONSULTATION/PREPARATION PROCESS FOR THE COUNTRY REPORT ... 67
iii
Malawi National AIDS Commission (NAC) wishes to acknowledge the contribution of various Government Line Ministries, departments and agencies, Civil Society, including Non- Governmental Organizations, Community Based Organizations, Faith Based Organizations, and the Private Sector for participation in the consultative and review process.
The Commission is also grateful to the National GARPR Task Force comprising of representatives from various institutions. In addition, the Commission appreciates the very useful information that was provided by the development partners and other stakeholders.
Finally, NAC appreciates the contribution of the Joint United Nations Programme on HIV and AIDS (UNAIDS) family for providing the financial and technical assistance needed for developing this report.
iv
AIDS Acquired Immuno-Deficiency Syndrome ANC Antenatal Clinic
ART Antiretroviral Therapy
BBSS Biological and Behavioural Surveillance Survey BCC Behaviour Change and Communication
BCI Behaviour Change Interventions BLM Banja La Mtsogolo Malawi Camfed Campaign for female education CBCC Community-Based Childcare Centres CBO Community Based Organization
CDC Centre for Disease Control and Prevention CEDEP Centre for Development of the People CHAI Clinton Health Access Initiative
CHAM Christian Health Association of Malawi CHBC Community and Home Based Care
CMED Central Monitoring and Evaluation Division CMST Central Medical Stores Trust
COWLA Coalition of Women Living with AIDS CSO Civil Service Organization
DfFID Department for International Development DNA Deoxyribonucleic Acid
DNHA Department of Nutrition HIV and AIDS EID Early Infant Diagnosis
EMTCT Elimination of HIV Mother-to-Child Transmission
EU European Union
FSW Female Sex Worker
v
GFATM Global Fund to Fight AIDS Tuberculosis and Malawi GoM Government of Malawi
HADG HIV and AIDS Donor Group HIV Human Immunodeficiency Virus HLM High Level Meeting
HMIS Health Management Information System HSAs Health Surveillance Assistants
HTC HIV Testing and Counseling IAWP Integrated Annual Workplan
IEC Information Education and Communication INH Isoniazid
IPT Isoniazid Preventive Therapy IRT Independent Review Team
I-TECH International Training & Education Center for Health LAHARS Local Authority HIV and AIDS Reporting System LEA Legal Environment Assessment
LSE Life Skills Education M&E Monitoring and Evaluation
MACOHA Malawi Council for the Handicapped
MANASO Malawi Network of AIDS Service Organizations MANET Malawi Network of People Living with HIV MBCA Malawi Business Coalition Against AIDS MBTS Malawi Blood Transfusion Service MCP Multiple and Concurrent Partnership MDG Millennium Development Goals
MDHS Malawi Demographic and Health Survey MGDS Malawi Growth and Development Strategy MGFCC Malawi Global Fund Coordinating Committee
vi MICS Multiple Indicator Cluster Survey
MoEST Ministry of Education Science and Technology
MoFEP Ministry of Finance, Economic Planning and Development MoGCD&SW Ministry of Gender, Children, Disability and Social Welfare
MoH Ministry of Health MoT Modes of Transmission MPF Malawi Partnership Forum MPS Malawi Police Services MSM Men having Sex with Men MTCT Mother to Child Transmission NAC National AIDS Commission
NAPHAM National Association of People Living with HIV and AIDS in Malawi NASA National AIDS Spending Assessment
NCPI National Commitment and Policy Instrument NFM National Funding Matrix
NPA National Plan of Action NSO National Statistical Office
NSP National HIV and AIDS Strategic Plan OPC Office of the President and Cabinet ORT Other Recurrent Transactions OSC One Stop Centre
OVC Orphans and other Vulnerable Children PCR Polymerase Chain Reaction
PEPFAR President’s Emergency Plan for AIDS Relief PHIA Population-based HIV Indicator Assessment PITC Provider Initiated Testing and Counselling PLHIV People Living with HIV
vii RBM Reserve Bank of Malawi
SCO Civil Society Organization
SCTP Social Cash Transfer Programme SHA System for Health Accounts SRH Sexual and Reproductive Health
SRHR Sexual and Reproductive Health Rights STI Sexually Transmitted Infection
TB Tuberculosis
TOT Training of Trainers
TV Television
TWG Technical Working Group
UDHR Universal Declaration on Human Rights UN United Nations
UNAIDS United Nations Joint Program on HIV and AIDS UNFPA United Nations Population Fund
UNICEF United Nations Children’s Fund
USAID United States Agency for International Development USG United States Government
VMMC Voluntary Medical Male Circumcision VSU Victim Support Unit
WHO World Health Organization YFHS Youth Friendly Health Services YONECO Youth Net and Counseling
1.1. Introduction
The HIV epidemic in Malawi has evolved, since the first case was diagnosed in 1985, to become one of the major causes of mortality and has placed tremendous demands on the health system and the economy. The epidemic has affected all sections of society – children, youths, adults, women and men. The country’s response to this epidemic has also evolved over the years from a health sector led response to a multi-sectoral one coordinated by one national authority, one strategic framework and one monitoring and evaluation framework. The response to the epidemic has been improving in tandem with increase in availability of reliable and comprehensive data, which has enabled the country to sharpen its focus on the key HIV transmission areas and populations in order to reduce new infections.
In June 2011, Malawi’s President joined other Heads of State and Government to review progress achieved in realizing the 2001 Declaration of Commitment on HIV and AIDS and the 2006 Political Declaration on HIV and AIDS. This High Level Meeting approved the UNAIDS Strategy ‐ Getting to Zero 2011‐2015. The leaders expressed concern regarding the inability of majority of low‐ and middle‐income countries to meet universal access to HIV treatment targets despite the major achievement of expansion in providing access to anti-retroviral treatment. Concern was also expressed that the number of new HIV infections was outpacing the number of people starting HIV treatment by a factor of two to one.
Among others, the leaders committed themselves to redouble efforts to achieve universal access to HIV prevention, treatment, care and support as a critical step towards ending the AIDS epidemic, with a view to achieving Millennium Development Goal 6, and in particular to halt and begin to reverse the spread of HIV by 2015.
This report presents the trends and status of key indicators of the HIV epidemic and the programmatic response in Malawi. This is not an evaluation of the HIV epidemic and response, but rather, a presentation of the most recent data that users can interpret and apply for various purposes.
2
1.2. Status of the epidemic
Since the Malawi Demographic and Health Survey (MDHS) in 2010, no recent nationally representative survey has been conducted in Malawi to estimate HIV prevalence. However, Malawi is planning an MDHS in 2015 as well as a Population-based HIV Indicator Assessment (PHIA) survey which is expected to estimate the prevalence of HIV. Nevertheless, based on previous survey data, Malawi has a generalized HIV epidemic. HIV prevalence among persons aged 15 to 49 years has been declining steadily from 16.4% in 1999 to 11.8% in 2004 and then 10.6% in 2010. In a previous survey1, HIV prevalence was
noted to be higher in specific occupational groups such as female sex workers, truck drivers, estate workers, police officers, teachers and female border traders compared with the general population.
Additionally, the most recent epidemiological modelling suggests a national average HIV incidence rate of 0.48 (CI 0.41-.46) per 100 person-years amongst people aged 15 – 492 in
2012, a decline of 35% from 0.74 in 2009. Malawi’s rapid and successful Antiretroviral Therapy (ARV) scale-up from 2004 to 2014 has critically influenced the trajectory of the HIV epidemic, reducing mortality, morbidity, and transmission. In the one decade since starting the national treatment program:
1 out of every 20 Malawi adults are now on ART 275,000 deaths have been averted
1.4 million life-years have been gained, primarily among young adults in their peak productive life period.
1.3. The policy and programmatic response
The Malawi Growth and Development Strategy (MGDS 2011-2016) provides the overall framework for socio-economic development agenda in Malawi. HIV is one of the key priority areas within the wider theme of social development. The MGDS also identified key strategic interventions which should be implemented in order to manage the HIV epidemic. In addition, the National HIV and AIDS Policy (2012), launched in July 2013, offers specific policy guidance to the national HIV and AIDS response.
In 2014, Malawi launched the development of the 2015-2020 National HIV and AIDS Strategic Plan (NSP) to supersede the 2011-2016 NSP. The new NSP aims to translate the National HIV and AIDS Policy into action and provide a new framework for the
1 National Statistical Office. (2006). Biological and Behavioural Surveillance Survey. Zomba: National
Statistical Office.
3
The 2015-2020 NSP emphasizes on the following major programmatic areas;
1. Intensifying the identification of previously undiagnosed HIV infected children and adults by refocusing the provision of high quality Provider Initiated HIV Testing and Counseling (PITC) services in high-yield settings and sub-populations at high risk of HIV infection,
2. Expanding access to Antiretroviral Therapy (ART) by continuing to roll out ART services to peripheral health facilities and increasing the number of HIV positive children and adults eligible for ART, in line with the 2013 WHO ART Guidelines4,
3. Maintaining high levels of adherence to ART regimens and retention treated HIV-positive individuals in ART programs through intensified public education and engagement and the use of community-based support groups.
The NSP recognizes that human resource shortages in Malawi impede optimal delivery of quality health sector-based HIV and AIDS interventions and undertakes to address this challenge by introducing HIV Diagnostic Assistants, as a new cadre of health workers who will complement skilled health workers in the provision of HIV and AIDS services.
The new HIV Prevention Strategy (2015-2020), aligned to the new NSP, aims at reducing HIV infections in line with the UNAIDS 90-90-90 targets. The new strategy specifically recognizes the need to target specific HIV preventive interventions to key populations such as Men who have Sex with Men (MSM), Female Sex Workers (FSW), couples and young women aged 10-24 years. The strategy provides a framework for overcoming challenges experienced in implementing traditional HIV transmission reduction interventions such as condom use, treatment of sexually-transmitted infections (STIs) and VMMC and promotes the use of a human rights and gender-based approaches in implementing HIV preventive interventions. It also recognizes the importance of high ART coverage in HIV prevention and includes specific interventions to support PLHIVs by promoting treatment adherence, addressing stigma and discrimination and providing social protection.
The development of the NSP and HIV Prevention Strategy was conducted in a transparent and all-inclusive manner. The recommended strategies and interventions were informed by research evidence, Malawi’s HIV and AIDS epidemiology and specific country context such as the public health system and the wider socioeconomic, political and cultural environment. To increase efficiency in HIV prevention, treatment, and care, the strategies adopted the investment framework which aims at maximizing the benefits of HIV
3 90% of PLHIV will know their status, 90% of people diagnosed will be on ART and 90% of people on ART
will be virally suppressed
4 Consolidated Guidelines on the Use of Antiretroviral Drugs for Treating and Preventing HIV Infection:
4
activities. The country used these strategies as reference points during the preparation of the Joint HIV/TB concept note which was submitted to the Global Fund in early 2015. Besides the HIV-specific policies and strategies, Malawi has several pieces of legislations which directly and indirectly impact the prevention and management of HIV and AIDS. These include: The Constitution of Republic of Malawi, The Penal Code, The Public Health Act, The Child Care, Justice and Protection Act, The Marriage Act, The Prevention of Domestic Violence Act, The Deceased Estate (Wills and Inheritance) Act, The Gender Equality Act, The Disability Act, The Occupational Safety, Health and Welfare Act, The Employment Act and The Labour Relations Act. In 2008, the Malawi Law Commission started the process of developing the HIV and AIDS Bill which aimed at consolidating HIV-related provisions spread across various pieces of legislation and strengthening the legal framework for implementing HIV and AIDS interventions. In 2014, stakeholders continued to review provisions of this bill so as to ensure that it meets the expectations of all constituencies and adheres to human rights standards. Thereafter, the Ministry of Justice and Constitutional Affairs finalized the drafting of Bill which is expected to be presented to the GoM cabinet in 2015 for review and approval before further submission to parliament for enactment.
Malawi is also a signatory to a number of international conventions and declarations. These include the 2000 UN Millennium Declaration, the 1948 Universal Declaration on Human Rights (UDHR), the 2001 UN Declaration of Commitment on HIV and AIDS, and the 2011 Political Declaration on HIV and AIDS. These international conventions and declarations have continued to provide an important guiding framework for national laws, policies, plans and regulations relating to HIV and AIDS.
Consistent with the ‘three ones’ principle, the NAC has the responsibility of coordinating the national response against the HIV and AIDS epidemic. The NAC coordinates the development of an Integrated Annual Workplan (IAWP) which outlines activities to be implemented by different partners and their corresponding budgets. These implementing partners include government ministries, NGOs, CSOs and the private sector working at national and sub-national levels. Nevertheless, it is apparent that a significant number of HIV interventions are implemented by partners not listed in the IAWP which present challenges in accounting for the investments in the HIV and AIDS response and assessing their impacts.
5
The National AIDS Commission (NAC), an agency of the Government of Malawi (GoM) responsible for coordinating the national response against the HIV and AIDS epidemic, led the process of compiling the 2015 Global AIDS Response Progress Report (GARPR) for Malawi. Two independent Malawian consultants collated, reviewed and analyzed relevant HIV-related policies, strategies, data and reports to compile 2014 HIV and AIDS indicators for Malawi and to assess the status of the HIV and AIDS response in 2014. A multisectoral Task Force, comprising representatives from UNAIDS, NAC, GoM and civil society organizations (CSOs), was formed to oversee the process of compiling this report and to provide guidance to the consultants. At the beginning of the assessment, the Task Force identified key stakeholders and constituencies in the HIV and AIDS national response who were listed as potential key informants to be interviewed. The stakeholders included representatives from the following constituencies: government, NAC, human rights organizations, development partners, UN agencies, CSOs including organizations for People Living with HIV (PLHIVs), the private sector and implementing partners. A complete list of stakeholders who were interviewed as part of this process is provided in Annex 1. The interviews focused on stakeholders’ qualitative assessment of the successes registered and challenges encountered in the implementation of HIV and AIDS interventions in 2014. These interviews also sought to identify and collate any recent HIV and AIDS data which were not yet available to the NAC. A draft report was prepared based on these interviews as well as the review of HIV and AIDS-related policies, strategies, guidelines, reports and other documents. The draft report was reviewed and discussed during a stakeholders meeting which was held on 8th April 2015 in Lilongwe. Annex 2 provides a list stakeholders
who attended this meeting. Following the meeting, the report was revised, taking into account stakeholders inputs and recommendation. A final copy was circulated to stakeholders for final approval. The next section provides an overview of the GARPR and health sector HIV indicators.
1.5. Overview of GARPR and Health Sector HIV Indicators
Malawi continues to track the progress made to achieve the ten targets agreed in the 2011 Political Declaration on HIV and AIDS. Table 1, below, shows the trend of indicators linked to these targets. It is important to note that 2014 data were unavailable for some indicators since there was no recent nationally representative survey or sentinel surveillance study. However, recent preliminary results from the Malawi MDG Endline Survey (2014) provided data for most impact indicators. However, it should be noted that this survey included fewer men (6,842) than women (24,230). Thus, the indicators for men will likely have a wider 95% confidence interval and hence less precise than those for women.
(Note: Health Sector HIV Indicators are highlighted in orange)
TARGETS INDICATORS 2010 UA*
Target 2010 5 2011 2012 2013 20146 Target 1: Reduce sexual transmission of HIV by 50% by 2014 General population 1.1: Percentage of young women and men aged 15-24 who correctly identify ways of preventing the sexual transmission of HIV and who reject major misconceptions about HIV transmission
Males: 75% Females: 75% Males: 44.7% Females: 41.8%
N/A N/A N/A Males: 51.1%
Females: 44.2%
1.2: Percentage of young women and men aged 15-24 who have had sexual intercourse before the age of 15.
N/A Males: 22.1%
Females: 14.3%
N/A N/A N/A Males: 18.2%
Females: 14.7%
1.3: Percentage of adults aged 15-49 who have had sexual intercourse with more than one partner in the past 12 months
N/A Males: 9.2%
Women: 0.7%
N/A N/A N/A Males: 10.7%
Women: 0.9%
1.4: Percentage of adults aged 15-49 who had more than one sexual partner in the past 12 months who report the use of a condom during their last intercourse
Males: 60% Women: 40% Men: 24.6% Women: 27.3%
N/A N/A N/A Men: 35.4%
Women: 35.4%
1.5: Percentage of men and women aged 15-49 who received an HIV test in the past 12 months and know their results Males: 75% Females: 75% Males: 31.3% Females: N/A
N/A N/A N/A Males: 40.0%
Females: 43.3%
1.6: Percentage of young people aged 15-24 who are living with HIV7
Males: N/A Females: N/A Males: 1.9% Females: 5.2%
N/A N/A N/A Males: 2.5%
Females: 3.6%
5 For 2010, the source of information is the 2010 MDHS, unless otherwise specified.
7
Sex workers 1.7: Percentage of sex
workers reached with HIV prevention programs
N/A N/A N/A N/A N/A 14.0%8
1.8: Percentage of sex workers reporting the use of a condom with their most recent client9.
N/A N/A N/A N/A N/A 85%10
1.9: Percentage of sex workers who have received an HIV test in the past 12 months and know their results
N/A N/A 29.5%11 N/A N/A 94.4%12
1.10: Percentage of sex workers who are living with HIV
N/A N/A 23.1%13 N/A N/A 24.9%14
7 The 2014 figures are based on UNAIDS estimates and not results from a population-based survey.
8 Organization providing services to sex workers reported that 7770 out of an estimated 55,000 sex workers received various forms of HIV preventive
services.
9 Family Planning Association in Malawi. (2011). Counting the uncatchables: a report of the situation analysis of the magnitude, behavioural patterns,
contributing factors, current interventions and impact of sex work in HIV prevention in Malawi. Lilongwe: Family Planning Association of Malawi and
UNFPA. NOTE: The study by FPAM did not look at use of a condom with their most recent partner but whether they have ever used condoms or not. The study showed that all the sex workers interviewed had ever used condoms but that in some cases they did not use condoms for varied reasons.
10 National Statistical Office, Malawi Biological and Behavioural Surveillance Survey 2014, Preliminary results
11 Family Planning Association in Malawi. (2011). Counting the uncatchables: a report of the situation analysis of the magnitude, behavioural patterns,
contributing factors, current interventions and impact of sex work in HIV prevention in Malawi. Lilongwe: Family Planning Association of Malawi and
UNFPA. NOTE: This “prevalence” is based on individual reports by sex workers and not on biomarkers.
12 National Statistical Office, Malawi Biological and Behavioural Surveillance Survey (BBSS) 2014, Preliminary results. Note that the question in BBSS
was whether they have ever been tested for HIV.
13 Family Planning Association in Malawi. (2011). Counting the uncatchables: a report of the situation analysis of the magnitude, behavioural patterns,
contributing factors, current interventions and impact of sex work in HIV prevention in Malawi. Lilongwe: Family Planning Association of Malawi and
UNFPA. Note: The study population in this study was markedly different from the population of sex workers enrolled in the Biological and Behavioral
Surveillance Survey (BBSS_. Thus, HIV prevalence from this study should not be compared with results from the 2014 BBSS.
8
Men who have sex
with men 1.11: Percentage of men who have sex with men reached
with HIV prevention programs
N/A N/A N/A N/A N/A
1.8-27.8%15
1.12: Percentage of men reporting the use of a condom the last time they had anal sex with a male partner
N/A N/A N/A N/A N/A 60.9-77%16
1.13: Percentage of men who have sex with men that have received an HIV test in the past 12 months and know their results
N/A N/A N/A N/A N/A 60-65%17
1.14: Percentage of men who have sex with men who are living with HIV
N/A N/A 21.0%18 N/A N/A 5.4-24.9%19
HTC, STI and VMMC
Health Sector
Indicators
1.16.1. Number of women and men aged 15 and older who received HIV testing and counseling in the last 12
N/A N/A N/A N/A 1,702,627 1,895,05820
15 AL Wirtz, G Trapence, V Gama, D Kamba, R Chalera, L Klein, R Kumwenda, T Chikoko, M Mangochi, S Baral. (2014). Final report to UN Joint Team on
HIV&AIDS in Malawi through UNDP: HIV Prevalence and Sociobehavioral Characteristics among Men Who Have Sex with Across Seven Sites in Malawi.
Johns Hopkins University and the Center for Development of People. Note: The question was whether they received information to prevent HIV with men
16 AL Wirtz, G Trapence, V Gama, D Kamba, R Chalera, L Klein, R Kumwenda, T Chikoko, M Mangochi, S Baral. (2014). Final report to UN Joint Team on
HIV&AIDS in Malawi through UNDP: HIV Prevalence and Sociobehavioral Characteristics among Men Who Have Sex with Across Seven Sites in Malawi.
Johns Hopkins University and the Center for Development of People. Note: The question was on condom use in last sexual act with a casual male partner.
17 Study participants were asked whether they were ever tested
18 Umar, E., G. Trapence, W., Chibwezo, D., Nyadani, H., Doyle, C. Beyrer and S. Baral. (2007). HIV prevalence and sexual behavior among men having sex
with men in Malawi. Lilongwe and Blantyre: CEDEP and CoM. This study did not look at indicators 1.11-1.13.
19 AL Wirtz, G Trapence, V Gama, D Kamba, R Chalera, L Klein, R Kumwenda, T Chikoko, M Mangochi, S Baral. (2014). Final report to UN Joint Team on
HIV&AIDS in Malawi through UNDP: HIV Prevalence and Sociobehavioral Characteristics among Men Who Have Sex with Across Seven Sites in Malawi.
Johns Hopkins University and the Center for Development of People. Note: HIV prevalence is provided as a range since there was a wide variation on HIV prevalence in the 7 districts where the study was conducted.
20 Integrated HIV Program Reports, Ministry of Health, Government of Malawi. Note: data collated from quarterly reports January to December 2014.
9
months and know their results
1.16-1a. Percentage of health facilities dispensing HIV rapid test kits that experienced a stockout in the last 12 months
N/A N/A N/A N/A N/A 2.8%21
1.17.1. STIs: Percentage of women accessing antenatal care (ANC) services who were tested for syphilis
N/A N/A N/A N/A 10% 7%
1.17.2. STIs: percentage of antenatal care attendees who were positive for syphilis
N/A N/A N/A N/A 6%22 4%
1.17.3. STIs: percentage of antenatal care attendees positive for syphilis who received treatment
N/A N/A N/A N/A N/A N/A
1.17.4. STIs: percentage of sex workers (SWs) with active syphilis
N/A N/A N/A N/A N/A N/A
21 Integrated HIV Program Reports (October to December 2014), Ministry of Health, Government of Malawi. Note: Data from this quarter of 2014 were
preliminary and could change after verification.
22 This prevalence is likely to be biased because only 10% of the antenatal attendees were tested. It may be that health workers only tested those who
10
1.17.5. STIs: percentage of men who have sex with men with active syphilis
N/A N/A N/A N/A N/A 1.4-8.7%23
1.17.6. STIs: number of adults reported with syphilis (primary/secondary and latent/unknown) in the past 12 months
N/A N/A N/A N/A N/A N/A
1.17.7. STIs: number of reported congenital syphilis cases (live births and stillbirth) in the past 12 months
N/A N/A N/A N/A N/A N/A
1.17.8. STIs: number of men reported with gonorrhoea in the past 12 months
N/A N/A N/A N/A N/A N/A
1.17.9. STI s: number of men reported with urethral discharge in the past 12 months
N/A N/A N/A N/A N/A N/A
1.17.10. STIs: number of adults reported with genital ulcer disease in the past 12 months
N/A N/A N/A N/A N/A N/A
23 See AL Wirtz, G Trapence, V Gama, D Kamba, R Chalera, L Klein, R Kumwenda, T Chikoko, M Mangochi, S Baral. (2014). Final report to UN Joint Team
on HIV&AIDS in Malawi through UNDP: HIV Prevalence and Sociobehavioral Characteristics among Men Who Have Sex with Across Seven Sites in Malawi.
Johns Hopkins University and the Center for Development of People. Note: HIV prevalence is provided as a range since there was a wide variation on HIV prevalence in the 7 districts where the study was conducted.
11
1.18. Percentage of pregnant women with a positive syphilis serology whose sexual contacts were identified and treated for syphilis
N/A N/A N/A N/A N/A N/A
1.22 Percentage of men
15-49 that are circumcised N/A 21.5%
24 N/A N/A N/A 27.5%
1.23. Number of male circumcisions performed according to national standards during the last 12 months
N/A N/A N/A 11,000 77,615 80,41925
Target 2:
Reduce transmission of HIV among people who inject drugs by 50 per cent by 201526.
2.1: Number of syringes distributed per person who injects drugs per year by needle and syringe programmes
N/A N/A N/A N/A N/A N/A
2.2: Percentage of people who inject drugs who report the use of condoms at last sexual intercourse.
N/A N/A N/A N/A N/A N/A
2.3: Percentage of people who inject drugs who reported using sterile injecting equipment the last time they injected
N/A N/A N/A N/A N/A N/A
24 This data is from the 2010 Malawi Demographic and Health Survey. Note: Respondents were asked whether they were circumcised or not but their
responses were not verified.
25 Data are from organizations which deliver VMMC programs namely Christian Health Association of Malawi (CHAM), Malawi Police Services, Banja La
Mtsogolo, Population Services International and I-TECH. Note: Data from the Ministry of Health were not available.
12
2.4: Percentage of people who inject drugs that have received an HIV test in the past 12 months and know their results
N/A N/A N/A N/A N/A N/A
2.5: Percentage of people who inject drugs who are living with HIV
N/A N/A N/A N/A N/A N/A
2.6. Number of people on opioid substitution therapy (OST)
N/A N/A N/A N/A N/A N/A
2.7. Number of NSP and OST sites:
- Number of needle and syringe programme (NSP) sites
N/A N/A N/A N/A N/A N/A
2.7. Number of NSP and OST sites:
- Number of opioid substitution therapy (OSP) sites
N/A N/A N/A N/A N/A N/A
Target 3: Eliminate mother to child transmission of HIV by 2015 and substantially reduce 3.1: Percentage of HIV positive pregnant women who receive antiretroviral to reduce the risk of mother to child transmission
65% 44% 44% 67% 73%28 72%
13
AIDS- related deaths27
3.1a Percentage of women living with HIV who are provided with antiretroviral medicines for
themselves or their infants during the breastfeeding period
N/A N/A N/A N/A N/A 87-97%29
3.2: Percentage of infants born to HIV positive women receiving a virological test for HIV within 2 months of birth
N/A N/A N/A 10% 30% 37%
3.3: Mother to child transmission of HIV (Modelled)
N/A - Will use
SPECTRUM 3.4. Percentage of pregnant
women who know their HIV status (tested for HIV and received their results - during pregnancy, during labour and delivery, and during the post-partum period (<72 hours), including those with previously known HIV status)
N/A N/A N/A N/A 83% 79%30
3.5. Percentage of pregnant women attending ANC whose male partner was tested for HIV in the last 12 months
N/A N/A N/A N/A N/A
27 2014 Data source, unless specified otherwise: Integrated HIV Program Reports, Ministry of Health, Government of Malawi. Note: data collated from
quarterly reports January to December 2014. Data from last quarter of 2014 (October to December 2014) were preliminary and could change after verification.
29 Government of Malawi, Ministry of Health, Integrated HIV Programme Report: 2014, Q1, Q2 and Q3 reports
14
3.6. Percentage of HIV-infected pregnant women assessed for ART eligibility through either clinical staging or CD4 testing31
N/A N/A N/A N/A N/A
3.7. Percentage of infants born to HIV-infected women provided with antiretroviral (ARV) prophylaxis to reduce the risk of early mother-to-child transmission in the first 6 weeks (i.e. early
postpartum transmission
around 6 weeks of age) 32
N/A N/A N/A 92% 93%
3.9. Percentage of infants born to HIV-infected women started on cotrimoxazole prophylaxis within two months of birth33
N/A N/A N/A 86% 85%
3.10. Distribution of feeding practices (exclusive breastfeeding, replacement feeding, mixed feeding/other)
for infants born to HIV-infected women at DPT3
N/A N/A N/A N/A N/A
31 Not relevant in the context of Option B+
32 The denominator is “HIV exposed infants discharged from the maternity”. The numerator is all HIV exposed infants who were prescribed with
nevirapine prophylaxis. Data Source: Integrated HIV Program Reports, Ministry of Health, Government of Malawi. Note: data collated from quarterly reports January to December 2014. Data from last quarter of 2014 (October to December 2014) were preliminary and could change after verification
33 The denominator is “the number of HIV exposed infants who are 2 months old”. The numerator is “all children less than 2 months who were
prescribed with cotrimoxazole. Data Source: Integrated HIV Program Reports, Ministry of Health, Government of Malawi. Note: data collated from quarterly reports January to December 2014. Data from last quarter of 2014 (October to December 2014) were preliminary and could change after verification
15
visit
3.11. Number of pregnant women attending ANC at least once during the reporting period34
N/A N/A N/A N/A 627,827 616,783
Target 4:
Have 15 million people living with
HIV on
antiretroviral treatment by 201535
4.1: Percentage of eligible adults and children currently receiving antiretroviral therapy36
85% 63% 67% 65% 83% 67%37
4.1 –Antiretroviral therapy: Number of eligible adults and children who newly initiated antiretroviral therapy (ART) during the reporting period (2014)
N/A N/A N/A N/A 102, 568 110,324
4.2a: Percentage of adults and children with HIV known to be on treatment 12months after initiation of antiretroviral therapy
N/A 81% 78% 80% 78% Adults: 77%
Children: 76%
34 This indicator was estimated from the number of women who booked at antenatal clinics. Data Source: Integrated HIV Program Reports, Ministry of
Health, Government of Malawi. Note: data collated from quarterly reports January to December 2014. Data from last quarter of 2014 (October to December 2014) were preliminary and could change after verification
35 2014 Data source, unless specified otherwise: Integrated HIV Program Reports, Ministry of Health, Government of Malawi. Note: data collated from
quarterly reports January to December 2014. Data from last quarter of 2014 (October to December 2014) were preliminary and could change after verification.
36 Data Source: Integrated HIV Program Reports, Ministry of Health, Government of Malawi. Note: data collated from quarterly reports January to
December 2014. Data from last quarter of 2014 (October to December 2014) were preliminary and could change after verification. It is estimated that 798,000 HIV+ people needed ART by the end of 2014. This figure is higher than 681,000 estimated in 2013
37 Coverage decreased in 2014 since the denominator (number of HIV-positive people eligible for ART) increased resulting from the change in ART
16
4.2b. Percentage of adults and children with HIV still alive and known to be on antiretroviral therapy 24 months after initiating treatment among patients initiating antiretroviral therapy during 2014
N/A N/A N/A 76% 73%38
4.2c. Percentage of adults and children with HIV still alive and known to be on antiretroviral therapy 60 months after initiating treatment among patients initiating antiretroviral therapy during 2014
N/A N/A N/A 59% 59%39
4.3.a. Number of health facilities that offer antiretroviral therapy (ART)
N/A N/A N/A N/A 689 706
4.3.b Health facilities: Number of health facilities that offer paediatric antiretroviral therapy (ART)
N/A N/A N/A N/A N/A 694
4.4. Percentage of health facilities dispensing ARVs that experienced a stock-out of at least one required ARV in the last 12 months.
N/A N/A N/A N/A N/A N/A
38 Data Source: Integrated HIV Program Reports (July to September 2014), Ministry of Health, Government of Malawi. 39 Data Source: Integrated HIV Program Reports (July to September 2014), Ministry of Health, Government of Malawi.
17
4.6.a Total number of people enrolled in HIV care at the end of the reporting period
N/A N/A N/A N/A 659,844
4.6.b Number of adults and children newly enrolled in HIV care during the reporting period (2014)
N/A N/A N/A 102,568 110,32440
4.7a. percentage of people on ART tested for viral load (VL) who have an undetectable viral load in reporting period (2014)
90% N/A N/A N/A N/A 85-86%41
4.7 b. Percentage of people on ART tested for viral load (VL) with VL level below ≤ 1,000 copies after 12 months of therapy (2014)
90% N/A N/A N/A N/A N/A
Target 5:
Reduce tuberculosis deaths in people living with HIV by 50% by 201542
5.1: Percentage of estimated HIV-positive incident TB cases that received treatment for both TB and HIV
50% 45% 54% 60% 81% 90%
5.2 Percentage of adults and children living with HIV newly enrolled in care who are
N/A N/A N/A N/A 1.6% 1.5%43
40 Includes only those on ART
41 Only 18% of eligible patients tested at the scheduled times: 6 and 24 after ART initiation and and then every 24 months. Data were available for Q1
and Q2 of 2014 , only.
42 2014 Data source, unless specified otherwise: Integrated HIV Program Reports, Ministry of Health, Government of Malawi. Note: data collated from
quarterly reports January to December 2014. Data from last quarter of 2014 (October to December 2014) were preliminary and could change after verification.
18
detected having active TB disease (new)
5.3 Percentage of adults and children newly enrolled in HIV care starting isoniazid preventive therapy (IPT)
100% N/A N/A N/A 56%44 80%
5.4 Percentage of adults and children enrolled in HIV care who had TB status assessed and recorded during their last visit45
100% N/A N/A N/A 98% 96%
2010/2011 (US$) 2011/2012 (US$) 201346
Target 6:
Reach a significant level of annual global expenditure (US$22-24 billion) in low and middle income countries
6.1: Domestic and international AIDS spending by categories47
-1. Prevention programs: 45,891,860
2. Treatment and care: 29,376,989
3. OVC: 5,861,433
4. Program management and administration: 42,764,990 5. Human resources: 4,890,721 6. Social protection and social services (excluding OVC): 7,338,811
7. Enabling environment: 11,650,572
8. HIV and AIDS Related Research: 4,196,858
-1. Prevention programs: 43,418,118
2. Treatment and care: 47,210,628 3. OVC: 5,435,149 4. Program management and administration: 34,891,301 5. Human resources: 4,052,479
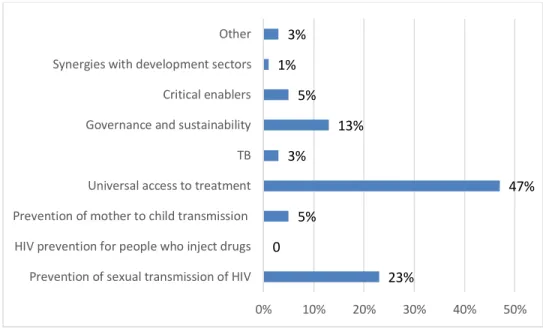
6. Social protection and social services (excluding OVC): 2,907,632 N/A 1. Prevention of sexual transmission of HIV: 42,389.685.02 2. Prevention of mother to child transmission: 9,215,148.92 3. Universal access to treatment: 86,622,399.83 4. Tuberculosis: 5,529,089.35
44 Note that this number is based on a small cohort of HIV positive individuals (<50,000) who are accessing pre-ART care.
45 Note that TB status is assessed by asking TB screening questions to individuals attending HIV care. Those who have symptoms and signs suggestive of
TB are investigated further.
46 2013 data on expenditure are not available.
47 According to the NASA for the period 2010/2012 more than 90% of the funding for the national response comes from donors. Details of funding by
19
TOTAL: 151,972,234 7. Enabling environment: 3,259,433
8. HIV and AIDS Related Research: 4,347,695 TOTAL: 145,522,435 5. Governance and sustainability: 23,959,387.19 6. Critical enablers: 1,843,029.78 7. Synergies with development sectors: 9,215,148.92 8. Other: 5,529,089.35 Total Fund: 184,302,978.36
6.1: Domestic and international AIDS spending by financing sources 1. Public funds: 2,666,009 2. Private funds: 415,211 3. Bilateral contributions: 65,687,625 4. Multilateral contributions: 61,369,453
5. International not for profit organisations and foundations: 18,696,708
6. International for profit organisations and foundations: 69,626
7. International funds (n.e.c): 3,067,602 TOTAL: 151,972,234 1. Public funds: 11,827,301 2. Private funds: 119,323 3. Bilateral contributions: 67,819,102 4. Multilateral contributions: 56,686,727 5. International not for profit organisations and foundations: 7,122,522 6. International for profit organisations and foundations: 417,469 7. International funds (n.e.c): 1,529,991 TOTAL: 145,522,435 1. Public funds: 26,355,325.9 1 2. Private funds: 3,870,362.53 3. International funds: 154,077,289. 91 Target 7: Eliminate gender inequalities and gender-based abuse and violence and increase the capacity of women and girls to protect themselves from HIV.
Proportion of ever-married or partnered women aged 15-49 who
experienced physical or sexual violence from a male intimate partner in
the past 12 months
20 Target 8:
Eliminate stigma and discrimination against people living with and affected by HIV
8.1 Discriminatory attitudes towards people living with HIV48
N/A Males: 35.7%
Females: 19.7%
N/A N/A N/A N/A
Target 10:
Strengthen HIV integration
10.1: Current school attendance among orphans and non-orphans aged 10– 14
N/A Males: 0.95
Females: 0.97 Total: 0.96
N/A N/A N/A 0.96
10.2: Proportion of the poorest households who received external economic support in the last 3 months
N/A 2.6 N/A N/A N/A N/A
48 This is a new indicator. The figure indicated for 2010 is based on the Malawi Demographic Survey which looked at “Percentage of respondents
2.1. HIV Prevalence in the general population
As mentioned earlier, in 2014, there were no recent data on HIV prevalence in Malawi. The country is planning to conduct the Population-based HIV Indicators Assessment Survey and the MDHS in 2015. However data from previous MDHS and sentinel surveillance surveys indicate that HIV prevalence in Malawi has been declining steadily from 16.4% in 1999 to 10.6% in 2010. The observed reduction in HIV prevalence occurring in the context of increasing ART coverage and improved survival of PLHIVs on ART suggest a declining trend of HIV incidence.
The 2010 Malawi Demographic and Health Survey (MDHS), the most recent national HIV survey, found a higher HIV prevalence in females aged 15-49 years (12.9%) than in their male counterparts (8.1%)49. The survey also found variation in HIV prevalence according
to age, sex, residence (rural/urban), geographical location and other characteristics. As shown in Figure 1 below, HIV prevalence and density was high in the urban districts of Lilongwe, Blantyre and Zomba and also in the Southern Region of Malawi. HIV prevalence was also higher in urban than in rural areas with marked differences observed in the northern and central regions of Malawi.
22
2.2. HIV prevalence in high risk groups
In 2014, Malawi conducted a nationwide survey50 which estimated HIV prevalence and
risky behaviors among specific social and occupational groups which are recognized to be at higher risk of HIV than the general population. These groups include FSWs, female border traders, long-distance truck drivers, police officers, estate workers, teachers and fishermen. Figure 2 below, shows the HIV prevalence in these groups in 2014 compared with results from a similar study in 2006. Overall, HIV prevalence in each of these groups remained higher than the estimated prevalence in the general population, with the exception of male vendors. Nevertheless, HIV prevalence appears to have declined markedly in FSWs, male primary and secondary teachers, male and female police officers and fishermen. There was also a decreasing trend in male estate workers and female border traders. Also, there were no marked changes in HIV prevalence in female primary and secondary school teachers, male vendors and female estate workers. Notably, there was a marked increase in HIV prevalence among truck drivers. There was also a marked gender difference in HIV prevalence among teachers, police officers, vendors and estate workers, with females having a higher prevalence than their male counterparts. While the increasing trend of HIV prevalence and higher prevalence in females do not necessary
50 National Statistical Office. 2014. Malawi Biological and Behavioural Surveillance Survey: preliminary results.
23
findings underscore the need for further exploring whether these groups are being reached with effective HIV prevention strategies.
Figure 2: Trends in HIV prevalence among high risk occupational groups 2006-2014
2.3. HIV prevalence in Men who have Sex with Men
In 2013-2014, a study was conducted in selected districts in the three regions of Malawi to estimate HIV prevalence, risky sexual behaviours and access to HIV services among MSM. The study found a considerably geographical variation in HIV prevalence among MSMs ranging from 5.4% to 24.9% (Figure 3), with urban and semi-urban areas in Central and Southern Regions recording higher HIV prevalence than the corresponding areas in the Northern Region. This geographical pattern was generally reflective of HIV prevalence observed in the general population. Using indirect methods, the study crudely estimated that 3% to 4% of men in urban Lilongwe and Blantyre could be MSM. Compared with results from a 2009 study51 which found HIV prevalence of 21% among MSM, the current
results suggest a decline in HIV prevalence in MSM in the cities of Lilongwe and Blantyre. Nevertheless, MSMs remained potentially at high risk of contracting HIV since, in the recent study, 80% erroneously reported that anal sexual intercourse carries a lower risk of HIV transmission than vaginal sexual intercourse and only 23% reported receiving targeted HIV prevention information.
51 Baral S., et al. “HIV prevalence, risks for HIV infection, and human rights among men who have sex with
men (MSM) in Malawi, Namibia, and Botswana” Plos One, Vol 4 (3), e4997, 2009.
0.0% 10.0% 20.0% 30.0% 40.0% 50.0% 60.0% 70.0% 80.0% H IV P rev a len ce Occupational Group BBSS 2006 BBSS 2014
24
(2013-2014)
2.4. Estimates of the burden of HIV in Malawi
The most recent estimates on the absolute burden of HIV in Malawi are based on epidemiological modeling using the UNAIDS SPECTRUM software. It is estimated that 1,100,000 Malawians were living with HIV in 2014 and that 34,000 new infections occurred in 2014, including 7,400 amongst children aged less than 14 years52. This
represents a marked decline from ~66,000 estimated in 2012. The annual AIDS-related deaths in 2014 were estimated at 48,000, representing at least a 50% reduction from an estimated 99, 000 deaths reported in 2004. This reduction has mostly been attributed to increasing ART coverage in Malawi and the recent policy changes towards early initiation of ART in PLHIVs.
The 2013 Modes of Transmission (MoT) study estimated that people in stable heterosexual relationships (married/co-habiting partners) account for 67% of all new HIV infections in Malawi53 while casual heterosexual relationships account for 12%. Nevertheless, the study
estimated high incidence rates among MSM, FSW and among the clients and partners of FSW54, signifying that these groups may represent hotspots for high HIV transmission
within a generalized epidemic.
52Joint United Nations Program on HIV/AIDS (UNAIDS) Malawi, May 2014 HIV estimates.
53 Futures Institute, UNAIDS and NAC, Malawi Prevention Response and Modes of Transmission Analysis,
2013.
54 Joint United Nations Program on HIV/AIDS (UNAIDS) Malawi and National AIDS Commission Malawi.
Modes of Transmission Analysis and HIV prevention Response. Distribution of new infections in Malawi 2013 and Recommendations for prevention strategies. 2014.
15% 20% 14% 21% 25% 5% 22% 0% 5% 10% 15% 20% 25% 30%
Blantyre Chikhwawa Lilongwe Mangochi Mulanje Mzimba Nkhata Bay
H IV P reva le n ce District
25
Chapter III: National response to the AIDS
epidemic
3.1. Introduction
This section assesses the progress that Malawi has made in the implementation of key interventions under the thematic areas of HIV prevention; treatment, care and support; and impact mitigation. Several sources of data sources were reviewed in conducting this assessment including a report from Independent Review Team (IRT) engaged by NAC in November 2014 to assess annual progress made in the national HIV and AIDS response. Progress on and impact of biomedical interventions was mostly assessed using the results from the MoH Integrated HIV and AIDS Program reports which are produced quarterly. Preliminary results from the nation-wide 2014 MDG Endline Survey and the BBSS were used to assess the population impact of various biomedical and non-biomedical interventions on proxy indicators of HIV transmission (such as risky sexual behaviors) and negative social consequences of HIV (such as stigma and discrimination). In addition, program output data were obtained from various project and program reports compiled by the NAC. However, because the fiscal year in Malawi runs from 1st July to 30th June, some of
the program data were only available for the last two quarters of 2013 and first two quarters of 2014. Responses from stakeholders interviewed by the consultants were used to assess the validity of key findings from various reports and also to qualitatively assess the implementation of various programs and their impact.
3.2. Prevention
The HIV Prevention Strategy (2011-2016) provided the overall framework and guidance for all prevention interventions in 2014. Additional strategies and guidelines supported the implementation of specific preventive interventions such as condom use, VMMC, HTC, EMTCT and Behavioral Change Communication (BCC). As stated above, in 2014, Malawi reviewed the 2011-16 HIV Prevention strategy and developed a new 2015-2020 HIV Prevention Strategy. The new strategy focuses on delivering tailor-made HIV prevention intervention to specific high risk groups and incorporates ART as one of the prevention strategies.
26
Key non-biomedical interventions implemented in 2014 included community sensitization and mobilization for HIV prevention through various IEC approaches and behavioural change activities which included life skills education for in-school and out of school youths, promotion of mutual faithfulness and use of male and female condoms. In addition, various activities sought to address cross-cutting human rights violations that promote HIV transmission such as gender inequality and gender-based violence, stigma and discrimination and harmful cultural practices. These interventions were coordinated by various stakeholders including government ministries, NGOs and CBOs. Programme implementers attempted to link demand creation with service provision.
3.2.1.1. Print and audio IEC materials
In 2013/2014, only 769,933 IEC materials of out a target of 1,500,000 materials were produced and distributed. This represents an achievement of only 51.3% of the target. In the previous year (2012/2013), 900,000 out of a target of 1,044,284 were produced, representing an achievement of 86.2%. The IEC materials produced in 2013/2014 focussed on themes such as: sex and sexuality; HTC; ART/PMTCT; harmful cultural practices; condom use; HIV discordancy; VMMC; and multiple and concurrent sexual partnership (MCP). Some of these materials especially those on PMTCT, VMMC, HIV and AIDS, and Sexual and Reproductive Health Rights (SRHR) were also printed in braille by the Malawi Council for the Handicapped (MACOHA), in order to ensure access to IEC materials on HIV and AIDS for persons with visual impairment..
3.2.1.2. Communication through radio and television
During the 2013/2014 fiscal year, a total of 220.5 hours of radio time was used to air programmes, slots and jingles on HIV and AIDS, representing a 73.4% achievement of the planned target of 300hrs and underperformance compared with the preceding year. In an effort to increase the target audience, various national and community radio stations were involved in disseminating information on HIV and AIDS in many languages. The radio messages covered a wide range of HIV and AIDS related themes including reduction of MCP, stigma and discrimination, while some specifically focussed on the youth issues. Television (TV) playtime on HIV and AIDS-related messages complemented radio messages, utilizing 61.3hrs of the targeted 100hrs in 2013/2014. Thus, TV playtime underperformed compared to the target set for the year and the preceding year. It has been argued that the reported number of hours spent on broadcasting of HIV and AIDS messages on the radio is actually underestimated because a previous study assessing the coverage of
27
and AIDS programs covered more than 4,000 hours annually55.
3.2.1.3. Other HIV and AIDS Communication Modes
To increase coverage of HIV prevention messages, a total of 316 interactive outreach audio-visual shows against a target of 1,200 sessions were conducted in communities, schools and places of entertainment/hotspots. These interactive sessions targeted the general and most-at-risk populations. This indicates that only 26% of the targeted interactive outreach audio visual shows were achieved. However, 4,389 of the planned 3, 500 interactive sessions; and public talks and expert talks were conducted in schools, communities and workplaces. This represents an achievement of 125% which was higher than the 99% accomplishment in the 2012/13 fiscal year. To increase the effectiveness of these interactive sessions, targeted audiences were linked to HIV preventive service provision such as condom distribution, HTC and referral to reproductive health services.
In the 2013/2014 fiscal year, efforts were made to reach out to key populations at risk of HIV infection. A total of 2816 people were trained as peer interpersonal HIV and AIDS educators, surpassing the planned target by 41%. Additionally, 4,831 MSM were successfully mobilized in 7 of the 28 districts in Malawi to participate in a research project estimating the prevalence of HIV and assessing the needs of MSMs, in terms of HIV prevention and treatment. This was a major achievement considering that homosexual practices remain illegal in Malawi.
To address SRHR violations, several NGOs conducted community awareness campaigns on HIV and AIDS through theatre performances targeting police officers, FSWs, sexually exploited young girls and primary school teachers. The aim was to promote condom uptake, build confidence of FSWs to negotiate condom use and promote awareness of rights of FSWs among law enforcers and the community. Through this initiative, about 47 girls were sent back to school, while others went into vocational training. In addition, during stakeholder interviews, representatives from law enforcers and NGOs reported decreased incidents of illegal arrests and sexual exploitation of FSWs by police officers.
55 Munthali, A.C., P. Mvula, J. Milner and P. Kishindo. (2011). A situation analysis of non-biomedical
28
Behaviour change interventions for young people were implemented through various initiatives, including Life Skills Education (LSE) for in-school and out-of-school young people; and the provision of Youth-Friendly Health Services (YFHS) aimed at increasing youths’ access to sexual and reproductive health services. Before 2010, LSE for in-school youth was being offered irregularly. In 2014, all students in primary and secondary schools in 2014 were exposed to LSE. This follows an earlier decision by government to make the LSE subject mandatory and examinable for all pupils in primary and secondary school. In 2013/2014, only 53,622 out of the set target of 150,000 out-of school youths were taught LSE representing only 36% of the targeted out-of-school youths. This indicates a major setback from a total of 134,735 out-of-school youths exposed to LSE in 2012/2013 and 264,968 out-of-school youths exposed in 2011/12. Training sessions on LSE and interpersonal/interactive communication were provided to only 4,350 out-of-school youth club leaders, members/club patrons out of a target of 150,000. Stakeholder interviews revealed that funding challenges to NGOs and CBOs adversely affected the implementation and supervision of out-of-school LSE programmes. Nevertheless, the low programme output figures may be under-estimates as many implementing partners not funded by NAC fail to submit programme output reports to the NAC56. However, these finding underscore
the need to refocus HIV prevention activities in this groups of youths who are not easily and consistently accessible.
3.2.1.5. The delivery of Youth-friendly Health Services
The MoH and stakeholders have been implementing YFHS since 2010. Progress in the implementation of these services has been slow: a 2013/14 evaluation of the delivery of YFHS57 found that less than one-third of community survey respondents had heard about
YFHS and only 13% reported to have ever accessed YFHS. The majority of young people who reported accessed YFHS did so for the first time in the 12 months prior to the survey, suggesting that the YFHS program has gained more prominence over the last year or two. More than 60% of those who reported accessing YFHS went to government health facilities for those services. Among young people interviewed, misconceptions about who should benefit from YFHS were evident, with more than half stating that YFHS are only for married youth.
56 ITAD. (2012). The independent review of Malawi national response to HIV and AIDS for financial year
2011-2012. Lilongwe: NAC
57 E2A Project and CSR. (2014). Evaluation of youth friendly health services in Malawi. Eashington: E2A
29
In 2013/14, only 12.4% of young people from an estimated target 4,000,000 accessed various health services. Nevertheless, by the end of the fiscal year, a total of 82,221 youths were tested for HIV and received results in YFHS facilities, representing 103% achievement of the annual target of 80,000. A total of 1,025,719 (34% achievement) condoms were distributed to youths in the YFHS facilities in order to prevent infection of HIV, other STIs and unwanted pregnancies.
While some progress has been made in the provision of YFHS, the 2013/14 evaluation indicates persistent challenges. These include lack of knowledge about the programme among young people themselves, their parents and community leaders, lack of privacy and confidentiality in the YFHS facilities, the requirement by some health providers that young people accessing YFHS should be tested for HIV before being offered other health services (which discourages youth from accessing such services), inadequate YFHS outreach services and weak parental and community support for young people seeking Sexual and Reproductive Health (SRH) services58. Interviewed stakeholders also confirmed poor
motivation of health worker to deliver YFHS as they mostly did not consider provision of this service part of their routine responsibilities. A long term solution to this problem could be the inclusion of YFHS in the pre-service curriculum for clinicians and nurses.
3.2.1.6. Condom Programming
In 2013/2014, stakeholders in the HIV and AIDS response planned to distribute 67 million condoms. Out of these, 57 million were to be free of charge while 10 million were to be socially marketed. By the end of the fiscal year in June 2014, only 60% (40,478,216) of the total target number of condoms were distributed. Out of these 24,108,849 condoms were free and distributed through the MoH and CBOs. Only 996,970 of the total free condoms distributed were female condoms. A total of 16,369,367 socially marketed condoms were distributed mainly through BLM and PSI, of which 38,568 were female condoms. Thus, despite missing the target for free condoms, the target for socially marketed condoms was surpassed by 64%. Between January and December 2014, PSI alone distributed 15 million condoms and this was the highest number of condoms the organization has ever distributed since it started operating in Malawi. The total number of free male condoms distributed in 2013/2014 was at least twice the number distributed in 2012/13 (20,957,870). The number of socially marketed condoms in 2013/2014 was nearly 75% higher than in 2012/13 (9,358,022). Despite these achievements, shortages of condoms were frequently reported in the 2013/2014 fiscal year, especially in rural areas. This was
58 E2A Project and CSR. (2014). Evaluation of youth friendly health services in Malawi. Eashington: E2A
30
Stores (CMS) in the distribution of condoms to peripheral outlets. The 2014 IRT report suggested that the actual national requirements for condoms was 90,547,22059 which is
higher than 67 million condoms that Malawi had planned to distribute in 2013/14.
Stakeholders reported that the demand and supply of female condoms remained unsatisfactory, consistent with findings from a Female Condom Evaluation study conducted in 2013. Among low risk females, barriers included the shortage of the condoms, poor knowledge and perceived difficulties in putting on the condoms, negative social connotations on females using the condoms (being associated with promiscuous behavior), and a myriad of negative myths and misconceptions. Among FSWs, the major barriers appear to be poor preference of female condoms by male clients due to concerns by clients that FSWs do not change the condoms between successive clients. Many respondents concluded that the female condom will unlikely be a major intervention of choice for preventing HIV in females.
3.2.2. Assessment of the impact of non-biomedical interventions 3.2.2.1. General Population
Although there were no recent HIV prevalence and incidence data in the general population, comparisons of data from the MDHS 2010 and 2014 MDG Endline Survey found mixed results in several proxy indicators for sexual transmission of HIV in the general population. On the positive side, the proportion of young people (15-24 years old) having comprehensive knowledge of HIV slightly increased, among males (44.7% to 55.1%) but remain largely unchanged females (41.8% to 44.2%). However, the 2014 proportions were far below the 75% Universal Access targets. On the negative side, the proportion of young people having sexual debut before 15 years remained stagnant in females (14.3% to 14.7%) and decreased slightly in males (22.1% to 18.2%). It is hoped the recent enactment of the Marriage Law which has increased the minimum age of marriage from 15 to 18 may indirectly assist in reducing early sexual debut. However, this law had not yet assented by the President at the time of writing this report.
The proportion people having sexual intercourse with a non-marital or non-cohabiting partner remained largely unchanged or slightly increased from 2010 to 2014, both in males (9.2% to 10.7%) and females (0.7% to 0.9%). Nevertheless, the proportion of people using condoms when having sexual intercourse with a non-marital or non-cohabiting partner increased in both males (24.6% to 35.4%) and females (27.3% to 35.4%). However, the
59 ITAD. (2014). The independent review of Malawi national response to HIV and AIDS for financial year