PSRT
Proceedings of
th
14
Polish Teletraffic Symposium
Proceedings of
14
th
Polish Teletraffic Symposium
Zakopane, 20-21 September 2007
EDITOR Tadeusz Czachórski
PUBLISHED BY
Institute of Theoretical and Applied Informatics of the Polish Academy of Sciences
Bałtycka 5, 44-100 Gliwice, POLAND www.iitis.gliwice.pl
TECHNICAL PROGRAM COMMITTEE Andrzej Bartoszewicz, Lodz University of Technology Wojciech Burakowski, Warsaw University of Technology
Tadeusz Czachórski, Institute of Theoretical and Applied Informatics of PAN, Gliwice Andrzej Duda, Laboratoire d’Informatique de Grenoble
Zbigniew Dziong, Université de Quebec Janusz Filipiak, Comarch, Cracow
Adam Grzech, Wroclaw University of Technology
Andrzej Jajszczyk, AGH University of Science and Technology, Cracow Wojciech Kabaciński, Poznan University of Technology
Sylwester Kaczmarek, Gdansk University of Technology Andrzej Kasprzak, Wroclaw University of Technology Jerzy Konorski, Gdansk University of Technology Józef Lubacz, Warsaw University of Technology Wojciech Molisz, Warsaw University of Technology
Andrzej R. Pach, AGH University of Science and Technology, Cracow Zdzisław Papir, AGH University of Science and Technology, Cracow Krzysztof Pawlikowski, University of Canterbury
Michał Pióro, Warsaw University of Technology Maciej Stasiak, Poznan University of Technology
Stefan Węgrzyn, Institute of Theoretical and Applied Informatics of PAN, Gliwice Jozef Woźniak, Gdansk University of Technology
ORGANIZING COMMITTEE Chair: Krzysztof Grochla [email protected],
Phone: +48 32 231 73 19 ext 218; Fax: +48 32 231 70 26 Joanna Domańska
Sławomir Nowak
Cover designed by Krzysztof Grochla ISBN: 978-83-926054-0-9
CONTENTS
KEYNOTE TALK
Wojciech Burakowski: On providing QoS in the Internet ... 7
QOS
Wojciech Burakowski; Piotr Stasiewicz: Measurements for on-line QoS monitorring of Real Time Class of Service in IP networks... 9 Janusz Korniak, Paweł Różycki: Performance examination of the segment recovery in GMPLS ... 21 Sylwester Kaczmarek, Paweł Kostecki: Quality of service in optical burst switched networks ... 31
SWITCHING
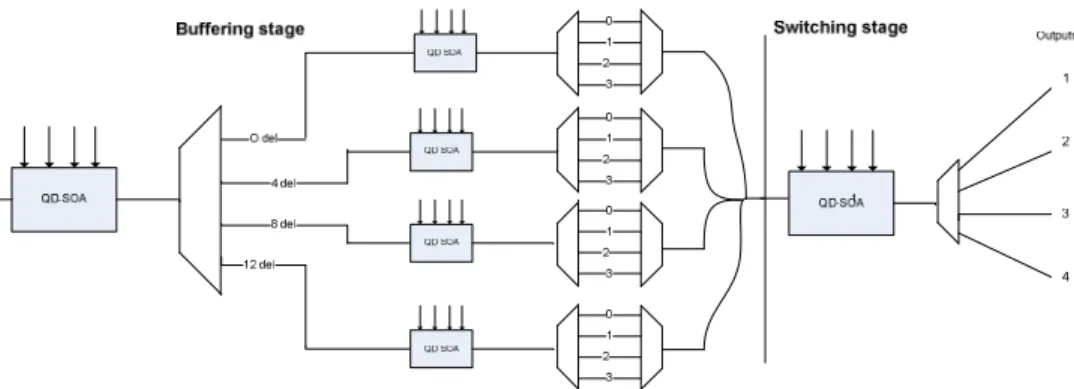
Wojciech Kabaciński, Sławomir Węclewski: New switch architectures with optical buffering using QD-SOA devices... 43 Wojciech Kabacinski, Tomasz Wichary: Wide-sense Non-blocking Multirate and Multicast Multi-log2(N; m; p) Switching Networks ... 53 Mariusz Głąbowski: Point-to-Point Blocking Probability Calculation in Multi-service Switching Networks with BPP Traffic ... 65 Mariusz Głąbowski, Adam Kaliszan, Maciej Stasiak: Iterative Algorithm for Blocking Probability Calculation in Erlang-Engset-Pascal Multi-rate Systems... 77 Janusz Kleban, Sławomir Węclewski: IM-OM matching packet dispatching scheme for MSM Clos-network switches ... 89
CELLULAR AND WIRELESS NETWORKS
Maciej Stasiak, Arkadiusz Wiśniewski, Piotr Zwierzykowski: Uplink and Downlink Blocking Probability Calculation for Cellular Systems with WCDMA Radio Interface and Finite Source Population ... 99 Jerzy Martyna: An Algorithm for Computing the Blocking Probabilities in Cellular Mobile Communication Networks ... 111 Jerzy Martyna: Modeling the Lifetime of Hierarchical Wireless Ad Hoc and Sensor Networks... 121 Jarosław Śliwiński, Wojciech Burakowski, Andrzej Bęben: Handling of heterogeneous CBR streams in wireless LANs by the Self-synchronised Packet Transfer mechanism... 131
TRAFFIC ENGINEERING AND ROUTING
Ivanna Droniuk, Roman Koshulinsky: Cross-platform solution for infocommunication networks simulation and management. Version for pocket PCs and smartphones... 141 Michał Morawski: Traffic engineering for industrial networks ... 151 Michał Zagożdżon: Mathematical models for combined OSPF/MPLS routing optimization in IP networks ... 165 Przemysław Ignaciuk, Andrzej Bartoszewicz: Flow control in connection oriented communication networks with unisochronic feedback and non-persistent sources... 177 Mirosław Kantor, Piotr Chołda, Jan Derkacz, Andrzej Jajszczyk, Angel O. Ferreiro:
Techno-economic Challenges in Interconnection between Network Operators... 189 Robert Janowski: The impact of scheduler on the maximum admissible load to a class of service ... 201 Tadeusz Czachórski, Krzysztof Grochla, Ferhan Pekergin: Fluid-flow Approximation Model of TCP-NCR in wired-wireless networks... 213 Paweł Świątek: On the Multistage Packet Processing... 225 Mariusz Mycek, Artur Tomaszewski: An Application of Lagrangean Decompo-sition to Optimization of Inter-Domain Routing in IP/MPLS Networks... 235 Mateusz Dzida: Efficient path generation in resilient single backup routing optimization... 247
TOOLS AND MODELS
Sylwester Kaczmarek, Krzysztof Nowak: Comparison of centralized and decentralized preemption in MPLS networks ... 259 Dariusz Gasior: Application of uncertain variables to rate allocation in the computer networks with imprecise parameters ... 269 Arkadiusz Biernack:iVoIP traffic modelling in a multimedia gateway... 281 Slawomir Nowak, MateuszNowak: Parallel simulation of networks with packet loss ... 293 Marek Fiuk: Modeling and Simulation of HTTP Protocol in Networked Control Systems ... 301 Krzysztof Grochla, Tadeusz Czachórski, Anna Busic, Jean-Michel Fourneau:
PREFACE
The proceedings of the 14th Polish Teletraffic Symposium, held in Zakopane, 20-21 September 2007 contain 28 contributions refereed and selected by its Technical Programme Committee.
The symposium has been organised since 1994 on a rotational basis by the following Polish universities and institutes:
• Poznań University of Technology, Poznań; • Gdańsk University of Technology, Gdańsk; • University of Mining and Metallurgy, Cracow; • Warsaw University of Technology, Warsaw; • Wrocław University of Technology, Wrocław;
• Institute of Theoretical and Applied Informatics, Polish Academy of Sciences, Gliwice. PTS 2007 was organized by IITiS PAN. Recently, each second year, PTS becomes Polish-German Teletraffic Symposium with participation of Dresden University of Technology, Dresden
The aim of the Symposium is to provide a regular, annual forum for a discussion on the design, implementation and perfection of contemporary telecommunications and computer communications systems. Its areas of interest include
• Teletraffic Theory, Modelling and Optimisation
• Performance Evaluation and Modelling of Communication Protocols • Traffic Measurements
• Traffic Issues for Mobile Systems • Mobility Models
• Traffic Issues for Internet
• Traffic Issues for High Speed, Packet-Switched Networks • Traffic Models for Optical Networks
• Performance Analysis Methods and Simulation • Intelligent Routing Protocols
• Broadcast and Multicast Traffic Control and Management • QoS Issues
The Symposium is addressed mainly to the teletraffic and network design community, both in Academia and Industry.
For the Technical program committee of PTS 2007 TADEUSZ CZACHÓRSKI EDITOR OF THE PROCEEDINGS
Polish Teletraffic Symposium 2007
ISBN 978-83-926054-0-9
KEYNOTE TALK
On providing QoS in the Internet
WOJCIECH BURAKOWSKI a HALINA TARASIUK bInstitute of Telecommunications Warsaw University of Technology
a
The Internet in today does not satisfy users, service providers and infrastructure operators. In Europe, except research networks as GEANT or some NRENs (National and Research National Networks), the best effort service is still only one network service offered to the users. The lack of offering QoS (Quality of Service) capabilities of the network becomes one of critical barriers in using more rigorous applications than e.g. web services. One can also mention about other barriers in the Internet as e.g. security, supporting mobility or reliability. The drawbacks of the Internet are well recognized but, at least for now, there are not satisfactory solutions for solving the above mentioned problems. Nowadays, there is discussion around Europe (around the whole world) about Future Internet and one can find interesting points expressed in documents of EIFFEL or FIRE initiatives. Furthermore, inside FP7 Framework and ICT (Information and Communication Technologies) area the problem of Future Internet is emphasized.
This paper presents tested approaches as proposed for assuring QoS in the Internet, including such issues as end-to-end QoS, QoS architectures, multi-domain aspects, signaling etc. In particular, we focus on the solutions tested inside FP5 and FP6 projects as AQUILA and EuQoS. While AQUILA solution follows the DiffServ Architecture proposed for single domain, the EuQoS approach can be regarded as implementation of the IMS/TISPAN architecture proposed for Next Generation Networks including multi-domain aspects.
Polish Teletraffic Symposium 2007 ISBN 978-83-926054-0-9
pp. 9 - 20
Measurements for on-line QoS monitoring of Real Time Class of
Service in IP networks
PIOTR STASIEWICZ a WOJCIECH BURAKOWSKI b Institute of Telecommunications
Warsaw University of Technology a
Abstract: The paper shows how to perform on-line QoS (Quality of Service) monitoring of Real Time Class of Service (RT CoS) in IP QoS networks. The RT CoS is aimed at handling streaming traffic that is generated by applications as VoIP, VTC etc. For this class of service we assume that the volume of submitted traffic is limited by appropriate CAC (Connection Admission Control). In the described method we monitor the QoS under maintaining the maximum allowed the worst-case traffic conditions as controlled by CAC. Since such conditions occur only sometimes (only when the maximum allowed volume of payload traffic is submitted), in our approach we keep these conditions by introducing additional traffic to the network. The volume of this traffic is the difference between the maximum allowed traffic and the payload one. The paper describes the details of the method including implementation issues and numerical results (simulation and experimental) showing its performances.
Keywords: QoS, measurements, monitoring, Real Time CoS 1. Introduction
A pressure for introducing QoS (Quality of Service) into the Internet is coming from the service providers who want to get a profit from new real-time services as VoIP, VTC, tele-medicine, etc. However, to meet these expectations many technical problems still need to be solved, mainly related to network traffic control and Internet signaling. Anyway, one can expect that the market solution for QoS Internet will appear soon. Nowadays, a number of EU IST projects announce promising solutions that are currently tested in some prototype networks, as GEANT [3], EuQoS [1], DAIDALOS [2], MUSE [4], OPERA [5] etc. In this paper we focus on the problem of on-line QoS monitoring offered by the network that is important for both the operators and the users. The operators of QoS network require knowledge about the state of the offered by them QoS level while the users expect the confirmation from the network operator about the received QoS. We assume that for providing QoS into the Internet, we implement the Class of Services concept, as in EuQoS system described e.g. in [6].
In this paper we present a method for on-line monitoring of QoS level offered by a Class of Service (CoS) in IP-based network that supports real-time applications like VoIP, VTC, named Real Time CoS (RT CoS). The method is aimed for providing knowledge to the network operator about the QoS offered by discussed CoS. More particularly, it should allow us for measuring the values of parameters as IPTD (IP Packet Transfer Delay), IPLR (IP Packet Loss Ratio) and IPDV (IP Delay Variation) that characterize the QoS level [8].
Furthermore, the values of the mentioned parameters should be measured under, so called, the “worst-case” traffic conditions and it means that traffic conditions should be maintained as adequate for the case, when amount of admitted traffic gets the upper limit. To keep during the measurements the worst case traffic conditions is very important since the QoS offered by the CoS, characterized in terms of IPTD, IPDV and IPLR values, is specified under assuming these traffic conditions. For instance, if we measure QoS when only a few connections is running we may expect better quality than assumed by the CoS but these measurements say nothing about the QoS offered by this CoS. The rest of the paper is structured as follows. In section 2 we present the method for on-line monitoring. Then, in section 3 we briefly describe the main objectives for RT CoS that is discussed as an example for on-line monitoring. Next, in section 4 we include exemplary numerical results showing effectiveness of the approach. Finally, section 5 summarizes the paper.
2. Method for on-line monitoring of QoS offered by Class of Service
Let us recall that Class of Service is the term used for the first time by ATM people for defining specific treatment of ATM cells generated by given types of applications. For ATM, we called them as ATM Native Services, and in this spirit have been defined the services as CBR, rt-VBR, nrt-VBR, ABR, UBR and GFR. In the ATM switches, for each of the mentioned services we dedicate the separate queues with specific packet scheduling disciplines as PQ (Priority Queue) or WFQ (Weighted Fair Queuing). The forced approach for the Internet with QoS is to follow the same direction. As a consequence, the IETF has proposed a number of Classes of Services [7]. Among them, the RT CoS is specified.
For RT CoS we dedicate in each link an amount of bandwidth, say C. The issue is to limit the volume of traffic submitted to this CoS by using appropriate Admission Control (AC) rules. In this way, we can control the values of parameters characterizing the packet transfer that is described by the values of the parameters as IPTD, IPDV and IPLR. So, the monitoring of the CoS is to measure, possibly on-line, the values of the mentioned parameters. For this purpose, we need to submit to this CoS additional traffic, named measurement traffic (MT), just for providing the measurements. On the other hand, we need to maintain the volume of traffic handled by the CoS on the same level independently of the volume of the payload traffic. This requirement comes from a need for keeping the CoS on the maximum load allowed by the AC rules. Anyway, it needs to introduce again to the network additional traffic, named background traffic (BT), now related with the payload traffic (PT). Of course, we should keep that BT+PT = constant.
The scheme for providing on-line monitoring in the case of inter-domain link is depicted on Fig.1. We assume that the Borders Routers (BR) provide QoS mechanisms at the packet level, i.e. PHB (Per Hop Behavior) mechanisms as classifiers, schedulers etc. Consequently, in general case, a number of CoSs can be implemented, among them the discussed RT CoS. For RT-CoS we dedicate separate buffer and we believe that this class is handled in isolation of the other CoSs, if any. Therefore, we put our attention on this CoS only and we do not consider the presence of other traffic. The plan for deploying the traffic generators and traffic receivers in the case of monitoring RT CoS on inter-domain link is also shown in Fig.1. The MT traffic is generated by the MTG (Measurement Traffic Generator) and is received by the MTR (Measurement Traffic Receiver). The MTG traffic is submitted to an input port of BR and this traffic is received by the MTR connected to the port of the BR terminating RT CoS. Similarly, the BT traffic is handled. Remark, that for
11
MT and BT we will use the same ports in BRs. On the other hand, we do nothing with PT traffic.
Fig.1 The measurement scheme for “on line monitoring” 3. Real Time Class of Service
In this section we briefly outline the main characteristics for RT CoS. As we mentioned above, the RT CoS is designed for transferring the streaming traffic emitted by such applications as VoIP and VTC. More details about the AC rules for the RT CoS class one can find e.g. in [9]. The traffic submitted to the RT CoS is handled independently on the other traffic and, for this purpose in the routers we dedicate for it a separate queue. The size of the queue is short since we need to keep low values of IPTD (say 100 ms) and IPDV (say 50 ms). For maintaining low value of IPLR (say 10-3) we assume special AC algorithm for limiting volume of submitted traffic. Furthermore, the RT CoS traffic is handled with high priority. The AC algorithm for this CoS assumes that particular connections produce CBR (Constant Bit Rate) traffic that is policed at the network entry point.
Time [s] 100 200 300 400 500 600 700 800 900 1000 1100 1200 Number of calls 60 70 80 90 105 112 120 120 125 90 75 60 Payload [kbit/s] 3840 4480 5120 5760 6720 7168 7680 7680 8000 5760 4800 3840 Measurement traffic [kbit/s] 200 200 200 200 200 200 200 200 200 200 200 200 Background traffic [kbit/s] 0 0 0 0 0 0 0 1575 1255 3495 4455 5415 IPLR 0,0001 0,0001 0,0001 0,0001 0,0001 0,0001 0,0001 0,0078 0,0075 0,0078 0,0083 0,0083
Fig.2 Schedule of the simulation in scenario #1; monitored link capacity: 10Mbit/s, length of the buffer in access node: 10packets
4. Numerical results
In this section we present results of two simulation experiments that show effectiveness of our on-line monitoring method of RT CoS. The objective of the tests was to validate assumptions of the measurement method. The architecture of simulated system was described in detail in section 2. In first scenario method was used to detect
degradation of QoS level what was caused by wrong configuration of admission control mechanism. Second scenario shows how the method can be used to detect problem caused by users who abuse declared traffic contract and generate greater volume of traffic than they supposed to.
IPLR 0,0001 0,001 0,01 0,1 1 0 200 400 600 800 1000 1200 Czas [s] IP L R IPLR IPLR limit 10^-3 IPLR limit 10^-2 IPTD 0 0,001 0,002 0,003 0,004 0,005 0,006 0,007 0,008 0,009 0 200 400 600 800 1000 1200 Czas [s] IP T D [ s ] IPTDmin IPTDmax IPTDavg a) b) IPDV 0 0,0002 0,0004 0,0006 0,0008 0,001 0,0012 0,0014 0,0016 0,0018 0,002 0 200 400 600 800 1000 1200 Czas [s] IP D V [ s ] IPDV c)
Fig.3 Scenario #1 – results; monitored link capacity: 10Mbit/s, length of the buffer in access node: 10packets; a) IPLR, b) IPTD, c) IPDV
4.1 Scenario #1
In this scenario we were simulating wrong configuration of the admission control algorithm for the Real Time CoS in access router. This class of service, as we mentioned before, requires very low values of IPLR (less then 10-3). To keep low values of IPLR and IPDV buffer length was set to 5 and 10 packet respectively. Configuration was corrupted and AC limit was set to ensure loss ratio less then 10-2 (10 times higher than assumed).
Size of the payload and background traffic packets was 200 bytes. Single source generates packets at equal intervals, every 25ms. In simulation CBR sources were replaced with one Poisson source that was sending packets with corresponding bit rate. Measurement packets were sent every 4ms and were 100 bytes long (total bit rate 200kbit/s).
During the simulation number of active calls was increasing. Till the background traffic was off and payload was low, QoS level was granted. However since background traffic generator has started and resources were filled up to wrong AC limit, QoS degradation was observed and IPLR rapidly increased. Pre-defined schedule of the simulation is shown on Fig.2 and results are presented on Fig.3.
4.2 Scenario #2
In this scenario we were using on-line monitoring method to detect degradation of QoS in case when end-users abuse declared traffic contracts. Such behavior in situation when amount of admitted traffic gets the upper limit and link utilization approaches allowed maximum may cause degradation of QoS level from the point of view of other
13
users. Simulation model was equal to this used in previous paragraph. Due to low delay restrictions, buffer length was set to 5 or 10 packets respectively.
In first part of scenario number of running calls was lower then maximal admissible. However total payload traffic was higher then declared one and since background traffic appeared in network, threshold for IPLR was overflowed. Number of active calls was constant during the test and summary declared load was equal to ¾ of available resources. In first phase generated payload traffic was higher then declared by 20%, in second by 10% and in last one – third by 5%. Fig.4 and Fig.5 present schedule of scenario #2 and measured results. One must notice that real reason of the QoS level degradation in this case can not be detect by our method. Equal symptoms could occur in situation when CAC mechanism is wrong configured. However crossing the threshold value in the worst-case traffic conditions should be sufficient signal for administrator to check configuration of CAC or policing mechanism.
Phase I Time [s] 50 100 150 200 250 300 350 400 Number of calls 100 100 100 100 100 100 100 100 Declared payload [kb/s] 6400 6400 6400 6400 6400 6400 6400 6400 Generated payload [kb/s] 7255 7255 7255 7255 7255 7255 7255 7255 Measurement traffic[kb/s] 200 200 200 200 200 200 200 200 Background traffic[kbis] 0 0 0 0 2150 2150 2150 2150 IPLR 0,0001 0,0001 0,0001 0,0001 0,0001 0,0118 0,0121 0,0127 Phase II III Time [s] 450 500 550 600 650 700 750 800 Number of calls 100 100 100 100 100 100 100 100 Declared payload [kb/s] 6400 6400 6400 6400 6400 6400 6400 6400 Generated payload [kb/s] 7040 7040 7040 7040 6720 6720 6720 6720 Measurement traffic [kb/s] 200 200 200 200 200 200 200 200 Background traffic[kb/s] 2150 2150 2150 2150 2150 2150 2150 2150 IPLR 0,0093 0,0052 0,0048 0,0047 0,0032 0,0019 0,0023 0,0024
Fig.4 Scenario #2, monitored link capacity: 10Mbit/s, length of the buffer in access node: 10packets
4.3 Conclusions
Presented results show clearly that our method could be used for detecting errors in configuration of elements in network infrastructure responsible for providing QoS. It could be performed both as on-line monitoring process when probing packets are sent parallel to payload traffic and as testing process run after for example router reconfiguration when all volume of traffic is generated artificially by Traffic Generators to check new settings.
Second scenario proved also that our method is also useful for detecting QoS degradation in situation when users abuse their traffic contracts. Even small amount of unprovisioned traffic in case when link utilization gets the allowed maximum could cause QoS threshold level overflow. However wrong configuration of CAC or Policer can produce similar symptoms and can not be identified in such way but it is sufficient signal to find the reason of the QoS violation.
IPLR 0,00001 0,0001 0,001 0,01 0,1 1 0 100 200 300 400 500 600 700 800 Czas [s] IP L R IPLR
IPLR limit IPTD
0 0,002 0,004 0,006 0,008 0,01 0 100 200 300 400 500 600 700 800 Czas [s] IP T D [ s ] IPTDmin IPTDmax IPTDavg a) b) IPDV 0 0,0005 0,001 0,0015 0,002 0,0025 0 100 200 300 400 500 600 700 800 Czas [s] IP D V [ s ] IPDV c)
Fig.5 Scenario #2 – results; monitored link speed: 10Mbit/s, length of the buffer in access node: 10packets; a) IPLR, b) IPTD, c) IPDV
5. Implementation details
In this section we briefly describe implementation details of on-line monitoring method. According to assumptions implementation was integrated with EuQoS framework. It consists of three separate components: Management Console (MC), Traffic Generating Controller (TGC) – module that is integral part in Resource Allocator (RA), developed in EuQoS Project, and a couple Traffic Generator (TG) and Traffic Receiver (TR). Communication between modules is based on remote procedure call standard, and based on this mechanism XML-RPC protocol [10][11], that is safe and easy way to exchange small amount of data between distributed applications. Architecture is presented on Fig.6.
15
Assumptions that were considered during analysis and design process were as follow: • fully integration with EuQoS system,
• every module must enable save interfaces for communication, • communication is realized via XML-RPC protocol,
• modules should run on Windows or Linux platforms,
• measurements must not cause QoS level degradation from point of view of other users,
• test results should be presented on-line, and stored in database,
• MGEN tool may be used as measurement and background traffic generator. Below we briefly describe each component and monitoring process.
5.1 Management Console – MC
It is main component that controls measurements, collects and stores results. This Java application works also as graphical user interface. Configuration and results are stored in PostgreSQL data base [12]. Communication between MC and other components is based on XML-RPC protocol.
Configuration of the network and monitoring process is divided into four logical levels as on Fig.below. The highest level is MC that communicates with TGCs located in RAs (level 2). As we know one RA can be related with many physical links. Links can be grouped by users into so called relations that correspond to logical paths between network nodes. Those relations are placed in our order on third position under RAs. Relation can consist of links that belong to different domains, but also can contain only one link. Physical links are located directly under relations and are related with TGs and TRs which are connected to the source and destination node of each monitored link. One TG can generate traffic in many links and CoSs and one TR can receive packets from many links and CoSs.
MC can be used in both centralized and decentralized measurement management model. In centralized architecture
main component is responsible for measurements in entire network and integrates communication between all probing agents. As an example we can mention measurement system developed by Reseaux IP Eurepean Network Coordination Center – RIPE NCC
[13][14][15]. In decentralized model management components are distributed in autonomous domains that together build the network.
5.2 Traffic Generation Controller – TGC
The component is an integral entity of the Resource Allocator. It operates as a command dispatcher between Management Console, Traffic Generators and Receivers. It also controls process of generating background traffic in every CoS supported on given link. Because of the second function it requires actual information about available resources and needs to be triggered during processes that are related with resource release, allocation or reallocation. Every such event must be immediately propagated to adequate TGs to decrease or increase generated load. Additional traffic must not reduce
transmission quality observed by end users and traffic condition should be maintained as in the worst case traffic scenario for sufficient long period to keep measurement accuracy.
Original objects in RA that are responsible for CAC algorithms were extended with new function that returns a list object of all available for given link CoSs and available resources in each one from the point of view of CAC algorithm. RA sends returned by procedure values to the corresponding TGs where generated traffic volume must be changed.
5.3 Traffic Generator – TG
TG is an application developed in Python programming language. It generates background and monitoring traffic according to commands received from TGC. TG is fully controlled by TGC installed in RA, that sends information about monitored link, CoS and bit rate of the additional traffic.
Application implements interfaces to communicate with Multi-Generator MGEN, which is used to generate background traffic. Python enables comforTab.and easy way to run operating system commands that are used to start/stop MGEN and to system processes list, that is useful for proper management of MGEN instances. TG reads configuration from files that contains information about links and supported on them CoSs. The way of generating background traffic in given links and CoS is also specified in configuration. TG starts XML-RPC server that listens on commands sent by TGC. On the other hand TG periodically invokes “keep-alive” procedure on TGC to monitor signalization link. In case of error or exception during invoking that procedure, all traffic generators are to be disabled to avoid probability of link overload. While the program is running configuration of links, CoSs and MGEN instances is kept in the tree data structure, in which links are local roots and CoSs with assigned to them MGEN instances are leafs.
5.4 Traffic Receiver – TR
TR is an application developed in Java programming language. It receives both measurement and background traffic. While background packets are simply discarded, probing packets are analyzed. QoS parameters are being computed on the basis of those calculations.
Since TR must perform a lot of incoming data, its logic is based on ring buffer algorithm. All received probes are stored in list structures that are changed every equal period of time according to configuration and measurement window. This time period is also defined as results refresh time. Separate thread uses probes stored in lists to calculate QoS parameters. After this statistics are sent to Management Console via TGC, list is being cleaned and prepared for use in next loop.
5.5 Monitoring process
Monitoring process starts after administrator selects relations or single links in GUI and presses start button. Relation is then divided into single links and these are grouped by superior RAs. Next MC sends to each selected RA command to start monitoring of listed links. TGC module that is located in RA receives order, gets from CAC module information about available resources in given links and forwards command to adequate TGs and TRs. TG checks if given link is not already monitored. If so it only stores this information, otherwise it prepares configuration script for MGEN and runs new instance.
17
In TR configuration is extended with information about new source of monitoring and background packets. Then process that computes QoS parameters sends back results to TGC and it forwards them to MC where they are presented and stored in data base.
6. Experimental results
In this section we present the results of several practical experiments performed with our on-line monitoring method. The goal of the tests was to validate the design and implementation of our system. Two of them were repetitions of scenarios considered during the simulations, described in section 4. Testbed used in experiments was part of EuQoS experimental network. During the tests results and configuration commands were sent via other links than monitored ones and did not influence on monitoring process.
6.1 Scenario #1
This scenario was considered to show that on-line monitoring method does not cause degradation of QoS level from the point of view of the users in case when all network elements and mechanisms are properly configured and other users do not abuse their traffic contracts. During the test number of active calls was changing. Every event of connection release or admission triggered reconfiguration of Traffic Generator. Fig.7-a depicts amount of generated payload traffic and background traffic that sum to constant value of AC limit. Whereas Fig.7-b shows measured level of IPLR that despite of varying volume of payload and background traffic is under threshold all the time.
Generated Traffic 0 1000 2000 3000 4000 5000 6000 0 100 200 300 400 500 600 Tim e [s ] G e n e ra te d t ra ff ic [ k b it /s ] Payload Measurement traf fic Background traf f ic IPLR 0,0001 0,001 0,01 0 100 200 300 400 500 600 Tim e [s ] IP L R IPLR IPLR limit a) b) IPTD 0 0,001 0,002 0,003 0,004 0,005 0,006 0,007 0,008 0 100 200 300 400 500 600 Time [s] IP T D [ s ] IPTDmin IPTDmax IPTDavg IPDV 0 0,0001 0,0002 0,0003 0,0004 0,0005 0,0006 0,0007 0,0008 0,0009 0,001 0 100 200 300 400 500 600 Time [s] IP D V [ s ] IPDV c) d)
Fig.7 Scenario #1 – results; monitored link capacity: 10Mbit/s, length of the buffer in access node: 10packets; a) Generated traffic, b) IPLR, c) IPTD, d)IPDV
That results show, that on-line monitoring does not have any negative influence on QoS level noticed from the point of view of the users. Fig.7-a shows that summary volume of payload and background traffic is constant apart from the call-level events,
such as call admission or release and measurement period is long enough for accurate calculations.
6.2 Scenario #2
Next test was the second approach to the scenario already tested during simulations. In this scenario configuration of the CAC mechanism was corrupted and number of admitted calls was higher then assumed limit.
Time [s] 100 200 300 400 500 600 700 800 900 1000 1100 1200 Number of calls 60 70 80 90 105 112 120 120 125 90 75 60 Payload [kb/s] 3840 4480 5120 5760 6720 7168 7680 7680 8000 5760 4800 3840 Measurement traffic [kb/s] 200 200 200 200 200 200 200 200 200 200 200 200 Background traffic [kb/s] 0 0 0 0 0 0 0 1575 1255 3495 4455 5415 IPLR 0,0001 0,0001 0,0001 0,0001 0,0002 0,0005 0,0004 0,0020 0,0078 0,0089 0,0083 0,0092
Fig.8 Scenario #2; monitored link speed: 10Mbit/s; length of the buffer in access node: 10packets IPLR 0,0001 0,0010 0,0100 0,1000 1,0000 0 200 400 600 800 1000 1200 Czas [s] IP L R iplr
IPLR limit 10^-3 IPTD
0 0,00005 0,0001 0,00015 0,0002 0,00025 0 200 400 600 800 1000 1200 Czas [s] IP T D [ s ] IPTDmin IPTDmax IPTDavg a) b) IPDV 0 0,00002 0,00004 0,00006 0,00008 0,0001 0,00012 0 200 400 600 800 1000 1200 Czas [s] IP D V [ s ] IPDV c)
Fig.9 Scenario #2 – results; monitored link speed: 10Mbit/s; length of the buffer in access node: 10packets; a) IPLR, b) IPTD, c) IPDV
Presented results show, that wrong configuration of CAC mechanism would not be noticed as long as volume of traffic generated by users was below threshold of guaranty of appropriate QoS level. In reality notification about QoS degradation would be send in situation when many users were connected. Our method for on-line monitoring detected QoS violation after one measurement period in situation when number of active flows was low.
6.3 Scenario #3
Following scenario was also already analyzed in section 4 during the simulations. This test was considered to present usability of method for on-line monitoring of Real Time CoS for detection of QoS level degradation in situation when users abuse their traffic
19
contracts. That is possible when policing mechanism does not work properly and users generate greater load than they formerly declared. Bigger amount of traffic than declared in case when network utilization gets the allowed maximum can cause capacity and efficiency problems.
Test scenario was divided into three parts. There were only payload (greater than declared) and monitoring traffic in first phase. Volume of the extra traffic was about 4% of the available resources. In the second phase background traffic generator was activated. Generated load was the difference between available resources (got from CAC algorithm) and declared payload. During third part volume of extra payload decreased to about 2% of the available resources.
Phase I II III Time [s] 50 100 150 200 250 300 350 400 450 500 550 600 Number of calls 100 100 100 100 100 100 100 100 100 100 100 100 Declared payload [kb/s] 6400 6400 6400 6400 6400 6400 6400 6400 6400 6400 6400 6400 Generated payload [kb/s] 6720 6720 6720 6720 6720 6720 6720 6720 6560 6560 6560 6560 Measurement traffic [kb/s] 200 200 200 200 200 200 200 200 200 200 200 200 Background traffic [kb/s] 0 0 0 0 1960 1960 1960 1960 1960 1960 1960 1960 IPLR 0,0001 0,0003 0,0002 0,0001 0,0016 0,0022 0,0027 0,0029 0,0022 0,0019 0,0017 0,0018
Fig.10 Scenario #3, monitored link speed: 10Mbit/s; length of the buffer in access node: 10packets IPLR 0,0001 0,001 0,01 0,1 1 0 100 200 300 400 500 600 Czas [s] IP L R IPLR IPLR limit 10^-3 IPTD 0 0,00005 0,0001 0,00015 0,0002 0,00025 0 100 200 300 400 500 600 Czas [s] IP T D [ s ] IPTDmin IPTDmax IPTDavg a) b) IPDV 0 0,00002 0,00004 0,00006 0,00008 0,0001 0,00012 0 100 200 300 400 500 600 Czas [s] IP D V [ s ] IPDV c)
Fig.11 Scenario #3 – results; monitored link speed: 10Mbit/s; length of the buffer in access node: 10packets; a) IPLR, b) IPTD, c) IPDV
Presented results prove that our on-line monitoring method is suiTab.for fast detection of QoS level degradation that can follow from additional volume of load generated by users contrary to declared traffic contract. It probably would not be noticed when load was medium, but could be critical problem when links were fully utilized. Measurement in our method are performed on-line that guarantees short lag between incident in the
network and adequate information in results. In described example problem was observed after one measurement period since background traffic generator was started.
7. Summary
In the paper we presented how to perform on-line QoS monitoring of Real Time Class of Service in IP QoS networks. We assume that monitoring of the offered QoS level should be performed in worst-case traffic conditions allowed by the applied admission control algorithm. To maintain maximum allowed volume of traffic we introduce additional traffic to the network. The volume of this background traffic is a difference between maximum allowed traffic determined by CAC mechanism and payload.
Assumptions of the method were firstly verified during simulations than implemented and deployed in the testbed environment. We described details of the implementations issues and several simulation and practical experiments, which confirm the ability of our monitoring method for on-line monitoring of offered QoS of Real Time CoS.
References
[1] The IST-EuQoS project, “End-to-end Quality of Service support over heterogeneous
networks”, www.ist-euqos.org
[2] The IST-DAIDALOS project, “Designing Advanced network Interfaces for the Delivery and
Administration of Location independent, Optimised personal Services”, www.ist-daidalos.org
[3] The GEANT project, www.geant.net
[4] The IST-MUSE project, “Multi Service Access Everywhere”, www.ist-muse.org
[5] The IST-OPERA project, “Open PLC European Research Alliance”, www.ist-opera.org
[6] W. Burakowski, M. Dąbrowski, M. Potts, EuQoS classes of Service, First European Workshop
of End-to-End QoS in the Internet, Paris, June 2005
[7] J. Babiarz, K. Chan, F. Baker, “Configuration guidelines for DiffServ service classes”, IETF
draft-ietf-tsvwg-diffserv-service-classes-00, work in progress, February 2005
[8] ITU-T Recommendation Y.1541, “Network performance objectives for IP-based services”,
may 2002
[9] H. Tarasiuk, R. Janowski, W. Burakowski, “Admissible traffic load of real time class of service
for inter-domain peers”, In Proc. of Joint International Conference on Autonomic and Autonomous Systems and International Conference on Networking and Services, ICAS/ICNS 2005, published by IEEE Computer Society, 23-28 October 2005, Papeete, Tahiti, French Polynesia
[10] Xmlrpc web page, http://www.xmlrpc.com/spec
[11] Xmlrpc – Apache web page, http://ws.apache.org/xmlrpc/
[12] PostgreSQL web page, http://www.postgresql.org
[13] Reseaux IP European Network Coordination Center, http://www.ripe.net/
[14] F. Georgatos, F. Gruber, D. Karrenberg, M. Santcroos, A. Susanj, H. Uijterwaal, R. Wilhelm,
“Providing Active Measurements as a Regular Service for ISP’s”, Passive and Active Measurements Workshop, PAM 2002
[15] C.J. Bovy, H.T. Mertodimedjo, G. Hooghiemstra, H. Uijterwaal, P. Van Mieghem, “Analysis
of End-to-end Delay Measurements in Internet”, Passive and Active Measurements Workshop, PAM 2002
Polish Teletraffic Symposium 2007 ISBN 978-83-926054-0-9
pp. 21–29
Performance examination of the segment recovery in GMPLS
JANUSZKORNIAK PAWELROZYCKI
University of Information Technology and Management in Rzeszow
[email protected], [email protected]
Abstract: The GMPLS segment recovery method described in the new RFC recommendation promises rapid switch-over data traffic in the case of data plane failure. Authors present the NS-2 based simulations of segment recovery and shows first performance test with different topologies.
Keywords:: GMPLS, segment recovery, simulation
1. Introduction
The Generalized Multiprotocol Label Switching (GMPLS) [1] is considered as the next generation high-speed backbone network technology. In order to accommodate growing In-ternet traffic optical crossconnects (OCXs) must be implemented to reduce IP switching. The Automatically Switched Optical Networks (ASON) [2] and the GMPLS are key technology which satisfy the growing requirements. While these two concepts are developed separately in ITU-T and IETF the GMPLS can be considered as the implementation of the control plane for ASON.
The principles of the GMPLS network are:
• generalization of the label switching idea known from MPLS technique to all types of multiplexing,
• separation of functional planes:
– data plane – includes all switching techniques supported by GMPLS such as WDM, TDM, packet switching etc.;
– common control plane– IP network, called also signaling network, responsible for exchanging signaling and routing messages;
– management plane– centralized or distributed supervise system that allows, for example, to employ provider’s policy.
22
The signaling network of the GMPLS may be realized in general in the following man-ners:
• in-band– when signaling network is a part of data plane and signaling channels are implemented as logical channels separated from the supported transport technology (e.g. VC/VP within ATM or DCC within SDH/SONET);
• out-of-band– when signaling network id physically separated from the data plane. The out-of-band signaling is important for implementing ASON technology. This ap-proach allows avoiding the opto-electronic processing because data and control plane are physically separated. However such architecture can behave differently during in-band sig-naling. For example failure in data and control plane have to be maintained separately.
The out-of-band signaling allows to use different topologies for data and control planes. In this case two nodes directly connected in the data plane may be not connected in the control plane or, similarly, two nodes directly connected in the control plane may be not neighbors in the data plane. Such architecture of the GMPLS is called asymmetrical. If, however, the topologies of both planes are the same, the architecture is called symmetrical.
Many works are devoted the GMPLS reliability and especially the control plane relia-bility [3],[4]. The papers [5], [6] and [7] prepared by authors consider the some aspects of failure detection and notification, also for different types of architecture, in the GMPLS con-trol plane when end-to-end protection of data plane is applied. The similar considerations for segment recovery mechanisms are presented in the next sections.
2. Segment recovery
The paper [8] defines the several types of protection for the GMPLS network including end-to-end protection and segment-based protection. In the end-to-end protection, described in details in the [9], the ingress and egress nodes for both working (called also protected) and backup (called protecting) LSP (Label Switched Path) are the same. This type of data plane protection can not satisfy the fast protection requirements when LSP is long. The propagation and processing delay can cause packet lost and higher delay. To solve this problem the concept of fast reroute [10] is introduced. For the GMPLS technology similar concepts is introduced in [11]. The node that initiates a recovery path is calledbranch nodeand the node that terminates such path is calledmerge node. The idea of the segment recovery is based on the protection of the segment LSP by other LSP called protection LSP. Note that each segment recovery LSP is established as an independent LSP and may be also protected using any protection method. The recovery LSP is established by the branch node. The path of recovery LSP may be defined by the ingress node of protected LSP or may be calculated by branch node himself. In the first case the path of given recovery LSP is carried by SERO (Secondary Explicit Route Object) object within thePathmessage. Note that the singlePath message may includes multiple SERO objects, one for each defined segment recovery path. In the second case the path of segment recovery is calculated at each node along establishing
23
working LSP. The method of path calculation depends on content of SESSION_ATTRIBUTE object carried byPathmessage.
While the idea is simple and allows dividing LSP into multiple segments to satisfy fast protection switching, the signaling of the control plane becomes much more complicated. Signaling of segment recovery must coexist with the out-of-band signaling and support asym-metrical topology. Note that for given LSP one or more segment recovery LSP may be cre-ated and these paths may overlaps each other or may be nested within other segment recovery LSP.
This is important to note that the termsegment recoveryused in this section is the gen-eralization of such mechanisms as segment protection and segment restoration. Described mechanism allows to use all well-known protection and restoration approaches such as 1+1 protection, 1:1 protection, LSP rerouting and shared-mesh restoration.
This new signaling requirements (segment recovery), out-of-band signaling and the asymmetrical topology can be a source of unpredicted behavior. In the next sections per-formance of GMPLS with segment recovery and mentioned assumptions is considered and verified by simulation.
3. Performance consideration The reliability of GMPLS depends on many factors like: • the data plane topology,
• the control plane topology, • the recovery path method,
• the reliability of the control plane, • the interaction between planes.
The first two items can be discussed in the context of planes symmetry or asymmetry. This problem was discussed in [5] for end-to-end protection method. The simulation presented in that wok shows dependency between topology asymmetry and reliability of GMPLS network. In the case of segment protection this influence is tested based on simulation shown in the next section.
The main aim of the segment recovery is to provide fast switch-over of data plane traffic and to satisfy low delay requirements. Therefore, only some recovery path methods can be used in this case. The recovery methods can be classified to computed on demand and pre-computed. The first method does not guarantee fast switching requirements. The second one can be classified to established on demand and pre-established. Only pre-established method can be used in segment recovery as a protection method which satisfy mentioned require-ments. This method of path recovery is used in the simulations presented in the following sections.
24
Fig. 1. The network topology used for tool validation
The reliability of the control plane is especially important in the case of separated func-tional planes and asymmetrical architecture. This problem was discussed in [5] for end-to-end protection method. It was shown that several enhancements in failure detection, noti-fication and protection of the control plane significantly improve the overall reliability of GMPLS. For the segment recovery method similar signaling processing occurs and, there-fore, proposed improvements should be verified.
The interaction between planes also can be factor of overall GMPLS reliability. For example high level of failures in data plane can be a source of high signaling load. Signaling packets can be processed with delay and negatively affects protection of data plane.
The next part of this paper focuses on the topology influence on the overall reliability when segment recovery is applied.
4. Performance examination of the segment recovery in GMPLS
The performance examination of the segment recovery in the GMPLS can be performed by simulation. This approach allows for quantity measurement of technology performance. The NS-2 [12] - network simulator has been used to conduct our research.
4.1. Simulation tool - verification and validation
The NS-2 is not a GMPLS simulator however it is possible to extend this environment to support simulation of this technology [13]. The base of our simulator is the MPLS tool included in NS-2 and the RSVP-TE implementation provided by [14]. In order to adopt this simulator to our task the following expansions have been prepared:
• physical separation of control and data planes, • supporting for asymmetrical architecture, • end-to-end data plane protection methods, • various recovery strategies
The architecture of implemented extensions are described in [15]. The newly added func-tionality is the segment recovery method. This funcfunc-tionality must be tested and verified.
25
Therefore, several simple simulation has been prepared. Simple network used for validation of segment protection method is depicted on figure 1.
The tests performed for verification includes: • establishment of segment protection LSP • segment recovery (switch over)
• control plane signaling after failure • release of reservation for protection LSP
Figure 2 illustrates several steps of testing process. The first step is the LSP establishment. In this step the protected LSP is created by sendingPathmessage from ingress to egress. This message contain SEROobject including planed protection LSP. The protection LSP estab-lishment is initiated onbranchnode not beforeResvmessage comes back from egress node. Thus branch node send the Pathmessage to Mergepoint end expect return Resv massage send byMerge. Established protection LSP is independent one with specialAssociation ob-ject which is used to assign with protected LSP. Processing of protected and protection LSP establishment is designed according RFC recommendation [11].
The key step of verification is the test of protection by segment recovery. ThePathErr message processing was modified according to RFC recommendation to support switch-over to protection LSP. Therefore, after a failure in the data plane thePathErris send upstream. Typically, this message is processed up to the ingress but in the segment recovery is processed to the firstbranch point which can support protection of failed segment. After the protec-tion LSP is established Forward Informaprotec-tion Base (FIB) contains necessary informaprotec-tion for switching data from protected LSP on all nodes exceptBranchepoint. When thePathErris received onBranchenode the FIB is modified and data is switched-over immediately.
The last step of test is the release process. The PathTear messages are processed in protected LSP but also must by pushed to protection LSP. Also when protected LSP fails and protection is in usePathTearmust be forwarded from protection to protected LSP.
4.2. Model of GMPLS network and performance test
The topology used for performance test is depicted on figure 3. Both the control and data plane are symmetrical. The source of data flow (UDP stream) are nodes 0, 6, 12 and 18. The destination is chosen from the same set of nodes. Thus there are four pair of source and destination. The pair of source and destination, start time and duration of flow is chosen randomly. Moreover, random number on randomly chosen links are planed to fail on data plane. The Label Switched Paths pre-established and pre-allocated based on routing infor-mation (OSPF-TE). In order to measure the performance of service number of lost packet is monitored.
Several simulations are started with different protection method and with symmetrical and asymmetrical topology. The first simulation is used as a baseline. In this simulation data plane is not protected. Table 1 shows the results of this simulation.
26
Fig. 2. Verification of simulation module for segment recovery.
27
The second simulation uses segment recovery technique and symmetrical topology. Ta-ble 2 presents the simulation results.
The next simulation with segment recovery and asymmetrical topology takes the same results in spite of disabled 6 links in control plane. The last two simulation uses the end-to-end protection with symmetrical and asymmetrical topology. The number of lost packets is very high (350 to 1000).
Table 1. Simulation without protection Simulation time 10s
Number of LSP 10
Number of packed send 4681 Number of failures 5 Number of packet lost 1106
Table 2. Simulation with segment recovery Simulation time 10s
Number of LSP 10
Number of packed send 4681 Number of failures 5 Number of packet lost 4
4.3. Analysis of the results
In the second and the third simulation the number of lost packets is very low as suspected. The recovery LSP are short and overlaps. Therefore primary LSP is protected in spite of failure in one recovery LSP. The asymmetry of the functional planes has no great impact to the performance. Again, due to short recovery paths. In the last two simulations the number of lost packets reaches almost 1000. This is the result of failure in protection LSP. The protection LSP are long and, therefore, end-to-end protection is susceptible for failures. The number of link failure in data plane is five within 10 seconds. It almost completely destroys protection of primary LSPs.
5. Conclusions
The simulation results confirm the efficiency of the segment recovery technique. Espe-cially when the size of protected segment is not too big. Switching to recovery LSP is almost immediate. In our simulation only one packet is lost per failure. Moreover overlapping re-covery LSP protected certain LSP is very effective. If one rere-covery LSP is failed other can
28
still support recovery for failed link or node. The end-to-end protection is much less efficient if used without any method for backup LSP reestablishment. The disadvantage of recovery LSP is high level of bandwidth reservation. Especially when recovery LSP are overlapping. However the size of the segment can be adjusted to satisfy low delay requirement and cost of resources reservation.
The influence of the asymmetry on the overall performance is insignificant when protec-tion LSP is short and increase when protecprotec-tion LSP becomes longer.
The in-depth analysis of efficiency of the segment recovery mechanisms require much more well prepared simulations. The future work will be, therefore, focused on detailed study of influence of described mechanism on such parameters as MTTR (Mean Time To Restore) and intensity of the control plane messages taking into consideration different topologies and architectures of the functional planes.
References
[1] E.Mannie (Ed.) et al.: Generalized Multi-Protocol Label Switching (GMPLS) Archi-tecture,RFC 3945October 2004.
[2] ITU-T Rec. G.8080/Y1304: Architecture for the Automatically Switched Optical Net-work (ASON), Nov. 2001 (rev. Jan. 2003).
[3] G. Li, J. Yates, D. Wang, C. Kalmanek: Control plane design for reliable optical net-works,IEEE Communication Magazine, pp. 90-96, February 2002.
[4] A. Jajszczyk, P. Rozycki: Recovery of the Control Plane after Failures in ASON/GMPLS Networks,IEEE Network, vol.20 No.1, Jan/Feb 2006.
[5] P. Rozycki, J. Korniak, A. Jajszczyk: Failure Detection and Notification in GMPLS Control Plane,IEEE ICC 2007, "Workshop on GMPLS Performance Evaluation: Con-trol Plane Resilience", 24 June 2007, Glasgow.
[6] J. Korniak, P. Rozycki “Signaling improvements for GMPLS control plane”, Tools of the Information Technology 2007, Rzeszow, (accepted)
[7] P. Rozycki, J. Korniak “End-to-end protection strategies in the GMPLS networks”, Tools of the Information Technology 2007, Rzeszow, (accepted)
[8] E. Mannie, D. Papadimitriou (Ed.) et al.: Recovery (Protection and Restoration) Termi-nology for Generalized Multi-Protocol Label Switching (GMPLS),RFC4427, March 2006
[9] J.P. Lang, Y. Rekhter, D. Papadimitriou, (Ed.) et al.: RSVP-TE Extensions in Sup-port of End-to-End Generalized Multi-Protocol Label Switching (GMPLS) Recovery, RFC4872, May 2007
[10] P. Pan, G. Swallow, A. Atlas: Fast Reroute Extensions to RSVP-TE for LSP Tunnels, RFC 4090May, 2005.
29
[11] L. Berger, I. Bryskin, D. Papadimitriou, A. Farrel: GMPLS Segment Recovery, RFC 4873May 2007.
[12] VINT project at LBL, Xerox PARC, USB and UCS/ISI The Network Simulator ns-2 http://www.isi.edu/nsnam/ns/
[13] J. Korniak, P. Rozycki, “GMPLS – simulation tools”,Proceedings of the 1st Conference “Tools of Information Technology”, Rzeszow, Poland, 2006
[14] C. Callegari, F.Vitucci, RSVP-TE patch for MNS/ns-2 http:// netgroup-serv.iet.unipi.it/rsvp-te_ns/
[15] J. Korniak, P. Rozycki, Modelowanie sieci GMPLS w srodowisku NS-2, XIV Konfer-encja Sieci komputerowe, Zakopane 2007, ISBN 978-83-206-1649-1 - In Polish
Polish Teletraffic Symposium 2007 ISBN 978-83-926054-0-9
pp. 31 - 42
Quality of service in optical burst switched networks
SYLWESTER KACZMAREK a PAWEŁ KOSTECKI Faculty ETI, Department STI
Gdańsk University of Technology
a
Abstract: In the paper analytical models of two service differentiation schemes for optical burst switched network: extended offset time based and PPS (Preemptive Priority Scheme) are revised. Also accordance of analytical models for those schemes is studied when complete class isolation is assumed. Furthermore authors introduce an analytical model which describes an effective degree of isolation when burst switched network employs both schemes and JET signaling. The comparison of analytical and simulation results are also included.
Keywords: OBS, QoS, offset time, PPS, JET signaling, analytical and simulation model
1. Introduction
Optical burst switching is considered as a promising solution for all-optical next generation network. An important issue in optical burst switched networks is service differentiation. So far many proposals have been published within this subject. The most significant service differentiation schemes are based on extended offset time [1], preemptive priorities PPS [6] and PPBS [3] or intentional burst dropping (proportional QoS [4]).
In extended offset time based scheme lower burst loss probability for a certain class can be achieved by extending its offset time. If the offset time difference between class i and class j is large enough, then class i is completely isolated from class j, which means that class i burst cannot be blocked by class j burst. The analytical model for extended offset time scheme is presented in [1][2] and it describes burst loss probability in a single node.
In PPS it is assumed that higher priority burst can preempt lower priority burst with a certain probability when lower priority burst is blocking higher priority burst. Analytical model that describes burst loss probability in a single node is presented in [6].
Service differentiation by extending offset time comes off natural properties of signaling for distributed control architecture in optical burst switched network. Therefore if a PPS scheme is used along with JET signaling [7] both mentioned service differentiation scheme could be applied.
When both schemes are applied the effective degree of class isolation depends on offset time difference and preemption probability. Different values of offset time
difference and preemption probability can result in the same value of effective degree of isolation. Therefore the same value of loss probability can be achieved for different values of those parameters. Analytical model for calculating effective degree of isolation will be introduced and validated by simulation.
When both schemes assume complete class isolation then analytical models, even though they are different, should give the same loss probabilities. This also will be verified mathematically and by simulation.
The paper is organized as follows. In section 2 analytical models for extended offset time scheme and PPS are reminded and also a model for combination of those two schemes is introduced. Also in this section the simulation model is described. The results of research are presented and discussed in section 3 and the paper is ended with the conclusions.
2. Analytical and simulation models 2.1. Extended offset time
Analytical model for extended offset time based scheme [2] assumes complete class isolation, full wavelength conversion, non-blocking switch and N wavelengths in outgoing link.
If there are K class of traffic (0…K-1, where 0 means the highest priority) and class i (i = 0, 1, …, K – 1) is completely isolated from any other lower priority class then burst loss probability for class i can be calculated from:
i i i j j i i j j i
B
B
B
λ
λ
λ
0, 1 1 0 , 0 0 − − = =
−
=
∑
∑
, (1)where
λ
i is class i burst arrival rate and B0,i is burst loss probability averaged over class 0 through class i. Averaged burst loss probability B0,i can be obtained from Erlang-B formula:∑
==
i j j N iE
A
B
0 , 1 , 0(
)
, (2)where Aj is the offered load for class j.
The degree of isolation Ri,j was also introduced in [1]. It is defined as a probability that class j burst cannot block class i burst. Its value can be calculated from following equation: ) ( 1 , j j off i off j i P t t L R = − − > , (3)
where toffi is the offset time for class i and Lj is class j burst duration.
Presented analytical model is only accurate if Ri,j = 1 as it assumes complete class isolation.
33
2.2. Preemptive Priority Scheme
Analytical model for PPS service differentiation scheme [6] assumes only two class of traffic (namely 0 and 1, where 0 means highest priority), full wavelength conversion, non-blocking switch and N wavelengths in outgoing link. It is based on multi-dimensional Markov chain. In PPS class 0 burst can preempt class 1 burst with probability p0,1 when class 1 burst is blocking class 0 burst. Burst loss probability for class 0 can be calculated from:
∑
<+ = − + = N m N n m n m N p P P B0 ,0 (1 0,1) , , (4)where Pm,n is the probability of state in which service system is serving m bursts of class 0 and n bursts of class 1. Burst loss probability for class 1 can be obtained from:
∑
∑
= + >+ = + = N n m n N n m n m n m p P P B 0 , 1 , 0 1 0 , 1λ
λ
. (5)The probabilities Pm,n are calculated from system steady state equations. Steady state equations can be obtained from system state transition diagrams shown in Fig. 1.
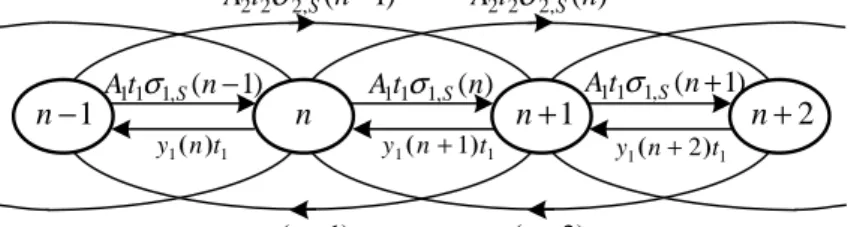
Fig. 1. State transition diagrams for certain cases; S(m,n) stands for state in which system is serving m class 0 bursts and n class 1 bursts; a) S(0,0); b) S(N,0); c) S(0,N); d) S(m,n), where: 0 <
m + n < N; e) S(m,n), where: m + n = N, m < N, n < N.
+ + − = + + − = < < = + + + + + + + − = < + < + + + + + + + + + + − = + + + − = − − − − − + − + + − − 1 1 , 0 1 0 1 , 0 , 0 0 1 , 0 1 , 1 0 0 , 1 0 0 , 1 1 , 0 , 1 0 1 , 0 1 , 1 0 1 0 1 , 0 , 1 1 , 0 , 1 1 1 , 0 , 1 1 0 1 0 , 1 , 0 1 0 , 1 0 1 0 0 , 0 ) ( 0 0 , , , ) ( 0 0 , ) 1 ( ) 1 ( ) ( 0 ) ( 0 λ µ λ λ λ µ λ λ λ µ µ λ µ µ λ λ λ µ λ λ µ µ λ λ N N N N N n m n m n m n m n m n m n m n m n m P N p P p P P N P N n N m N n m P P p P n m p P N n m n P m P P P n m P P P P (6)
Analytical model for PPS doesn’t take into account that segmentation of low priority bursts can occur and therefore class 1 loss probability might be lower. Segmentation is only possible when offset time for class 0 is shorten then class 1 burst duration and it happens when both class 0 burst and it’s header arrive when class 1 burst is being serviced (Fig. 2).
Fig. 2. Burst segmentation in PPS.
2.3. Combination of both models
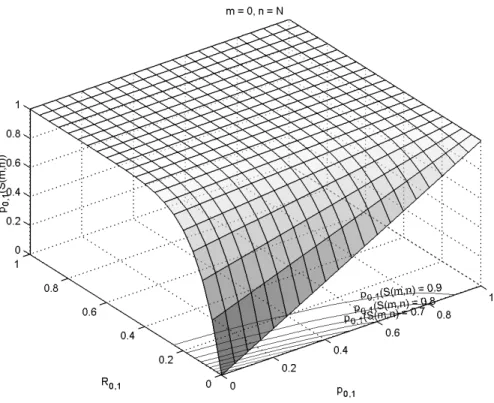
If both schemes are applied and only two class of service are assumed then the degree of isolation results from R0,1 and p0,1.
Lets assume situation when class 0 burst arrives in state S(N-n,n) in which N-n class 0 bursts and n (n > 0) class 1 bursts are being serviced and the N is the number of wavelengths in outgoing link.
Newly incoming class 0 burst in state S(N-n,n) can be served without preempting any of n class 1 bursts if the offset time difference is large enough that class 0 burst won’t see at least one class 1 reservation. For a single wavelength probability that class 0 burst won’t see class 1 reservation is equal to R0,1. If there are n class 1 reservations and bursts are served independently then that probability is equal to 1-(1-R0,1)n.
On the other hand preemption will occur if newly incoming class 0 burst sees all reservations made for class 1 bursts. Therefore preemption in state S(N-n,n) occurs with probability p0,1(1-R0,1)n.
Probability that newly incoming class 0 burst in state S(N-n,n) is successfully served can be written as follows: