Technology (IJRASET)
Irrigation Operating Policies Using Genetic
Algorithm- Ukai Reservoir as a Case Study
Seema Shiyekar1, Amey Katdare2, Nanadkumar Patil3
1
Assistant Professor, Civil Engineering Department, SGI, Atigre, Maharashta, India.
2
Assistant Professor, Civil Engineering Department, SGI, Atigre, Maharashta, India.
3
Professor, Civil Engineering Department, SGI, Atigre, Maharashta, India.
Abstract— In reservoir operation, appropriate methodology for deriving reservoir operating rules should be selected and operating rules should then be formulated. In the present study, Genetic Algorithm (GA) has been used to optimize the operation of existing multipurpose reservoir in India, and also to derive reservoir operating rules for optimal reservoir operations. The fitness function used is minimization of irrigation deficit i.e minimize sum of squared deviation of releases from demands of irrigation. The decision variables are monthly releases from the reservoir for irrigation and initial storages in reservoir at beginning of the month. The constraints considered for this optimization are reservoir capacity and bounds for decision variables. Results show that, even during the low flow condition, the present GA model if applied to the Ukai reservoir in Gujarat State, India, can satisfy downstream irrigation demand. Hence based on the present case study it can be concluded that GA model has the capability to perform efficiently, if applied in real world operation of the reservoir.
Keywords— Genetic algorithm, Optimization, Ukai, reservoir, irrigation
I. INTRODUCTION
Technology (IJRASET)
deriving the optimal operating policy and compared its performance with that of stochastic dynamic programming (SDP) for a multipurpose reservoir. The objective function of both GA and SDP was to minimize the squared deviation of irrigation release. Sensitivity analysis was carried out for mutation and cross over. They found that GA model releases nearer to the required demand and concluded that GA is advantageous over SDP in deriving the optimal operating polices. Janga Reddy and Nagesh Kumar(2005) developed Multi-objective Evolutionary Algorithm to derive a set of optimal operation policies for a multipurpose reservoir system and concluded that the results obtained using the proposed evolutionary algorithm was able to offer many better alternative policies for the reservoir operation, giving flexibility to choose the best out of them. Jotiprakash et.al (2006) developed a GA model for deriving the optimal operating policy for a multi-purpose reservoir. In the present paper, a GA model has been used for optimum reservoir operation. The objective of this study is to minimize the squared deviation of monthly irrigation demand deficit. The decision variables used are the release for irrigation demand from the reservoir through Ukai left bank canal and Ukai right bank canal. The constraints used for this optimization are mass balance equation, reservoir capacity, and the bounds for decision variables.
II. STUDYAREA
An easy way to comply with IJRASET paper formatting requirements is to use this document as a template and simply type your text into it. The reservoir chosen for the application of the GA model is the Ukai reservoir in Tapi river basin. Gujarat has around 21 large dams, among 541 Indian Dams. Ukai Dam near Surat is one of the major projects including Sardar Sarovar Dam. Ukai reservoir is the multipurpose reservoir situated in the Ukai village of Surat district on Tapti River, is the largest reservoir in Gujarat. It is also known as Vallabh Sagar. It is located between longitudes 73°32'25"-78°36'30"E and latitudes 20°5'0"-22°52'30"N. Ukai dam was constructed in 1971, the dam is meant for irrigation, power generation and flood control. The site is located 94 km from Surat. Figure 1 shows ukai reservoir system and table I shows salient features of Ukai reservoir system.
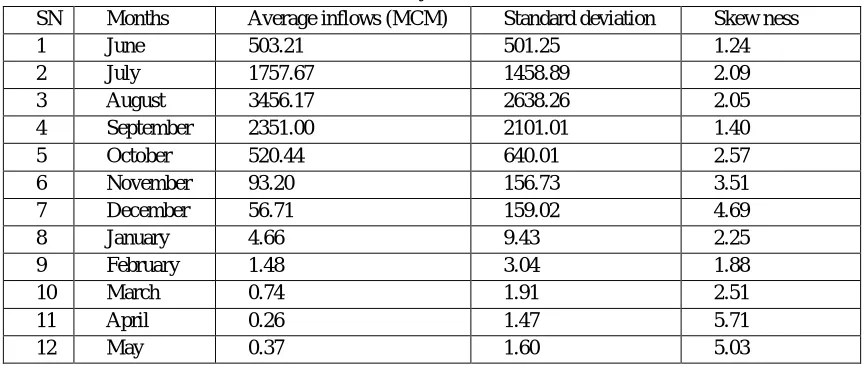
[image:3.612.213.432.368.488.2]The data available is for 36 years from 1975 to 2010. Figure 2 shows the plot of years against reservoir inflow in MCM and the trend line drawn show a constant reduction in annual inflow, demanding better water planning. Table II shows historical data.
Fig.1Annual reservoir inflows
Table I Statistical analysis of historical Inflow data
SN Months Average inflows (MCM) Standard deviation Skew ness
1 June 503.21 501.25 1.24
2 July 1757.67 1458.89 2.09
3 August 3456.17 2638.26 2.05
4 September 2351.00 2101.01 1.40
5 October 520.44 640.01 2.57
6 November 93.20 156.73 3.51
7 December 56.71 159.02 4.69
8 January 4.66 9.43 2.25
9 February 1.48 3.04 1.88
10 March 0.74 1.91 2.51
11 April 0.26 1.47 5.71
12 May 0.37 1.60 5.03
0.00 500.00 1000.00 1500.00 2000.00 2500.00
1970197519801985199019952000200520102015
in
fl
o
w
i
n
r
e
s
e
rv
o
ir
i
n
M
C
M
Year
Annual reservoir inflows
[image:3.612.90.522.531.714.2]Technology (IJRASET)
III. MODELDEVELOPMENT
In the present study, the fitness function of the GA model is minimization of irrigation deficit i.e Minimize sum of squared deviation of releases from demands of irrigation
Minimize
2 2
12 12
, , , ,
1 1
l t i t r t r t
t t
SQDV
D
R
D
R
(1)
Where, SQDV is the sum of squared deviations of irrigation releases from demands, Dl , t
And D Rb ,t are the irrigation demands for the left bank and right bank canal command areas respectively in period t in Mm3; R l , t
and R r , t are the releases in to the left and right bank canals respectively in period t in Mm3.
This model is subjected to following constraints:
a. Storage continuity
1
(
1, 2, 3,)
t t t t t t t t
S
S
I
R
R
R
E
O
for all t = 1,2,………,12 (2)
Where
S
t= active reservoir storage at the beginning of period t in Mm3
I
t= inflow to the reservoir during period t in Mm3t
E
= the evaporation losses during period t in Mm3 ( a non-linear function of initial and final storages of period t)
O
t= overflow from reservoir in Mm3b. Storage limits
min f max
S
S
S
for all t = 1,2,………..,12 (3)
Where
S
min andS
max are the minimum and maximum active storages of the reservoir.c. Canal capacity limits
, 1,max
l t
R
C
R
l t,
C
1,max, for all t = 1,2,………..,12 (4)
Where
C
1,max is the maximum canal carrying capacity of the Ukai left bank canal.d. Irrigation demands
min,t l t, max,t
Dl
R
Dl
for all t = 1,2,………..,12 (5)
Dr
min,t
R
r t,
Dr
max,t for all t = 1,2,………..,12 (6)Where
Dl
min,t andDl
max,t are minimum and maximum irrigation demands for left canal respectively,Dr
min,t andDr
max,t areminimum and maximum irrigation demands for Karkapar right canal and Karkapar left bank canal respectively in time t.
e. Overflow constraint
1
7414.29
t t
O
S
for all t = 1,2,………..,12 (7)
Where
s
t1= storage at the end of the month Mm3. 7414.29 is gross storage of reservoir.
f. Steady state storage constraint
S13 = S1 (8)
This constraint is required to bring the steady state condition for the reservoir storage, i.e., storage at the end of a year is equal to the initial storage at the beginning of that year.
IV. MODELAPPLICATIONANDDISCUSSION
Technology (IJRASET)
[image:5.612.163.452.142.384.2]performance predictions. To find optimum population size in present study different population size has been considered. Population size is increased up to certain population size. Second important parameter affecting GA performance is the probability of cross over. Its effect on the system performance is studied by varying the probability of crossover from 0.6 to 0.9 with an increment of 0.01 and adopting the obtained optimal population of 100. Figure 3 shows variation of objective function with crossover probability.
Fig.2 Probability of crossover Vs Objective function
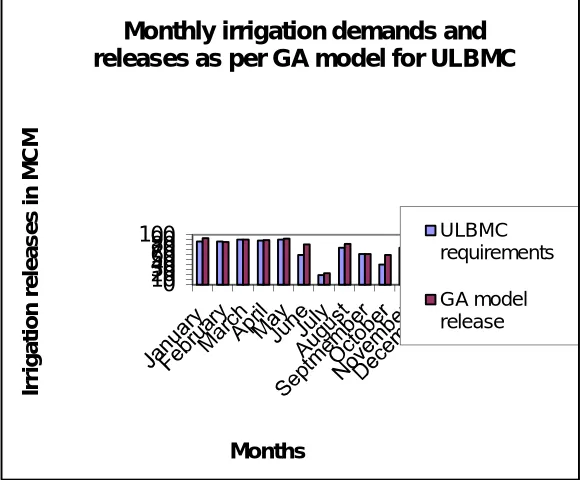
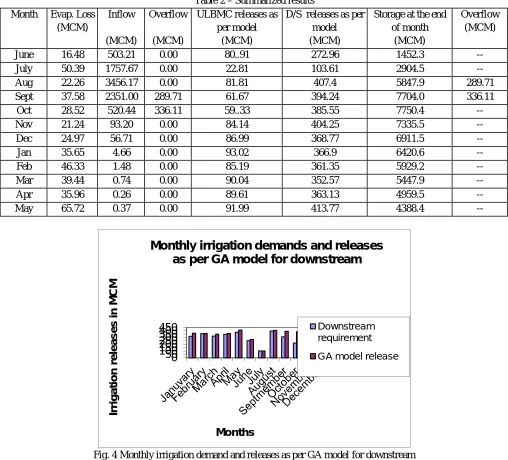
A comparative plot of actual demand and GA model release for an average inflow shown in Fig.6 shows that the demand is almost satisfied with the releases obtained through GA model for Ukai left bank canal and Ukai downstream. To derive rule curve the results obtained are plotted in Fig. 4 and Fig 5.The parameters used in applying GA to reservoir operation model were those selected after a thorough sensitivity analysis by varying each of the parameters. A population size of 100 and crossover probability of 0.8 are chosen to run the model.
2 4 6 8 10 12 14 16 18 20
0.4 0.6 0.8 1
O
b
je
c
ti
v
e
fu
n
c
ti
o
n
Probability of crossover
Probability of crossover VS Objective function
0 10 20 30 40 50 60 70 80 90 100
Ir
ri
g
ati
o
n
r
el
eases
in
M
C
M
Months
Monthly irrigation demands and
releases as per GA model for ULBMC
ULBMC requirements
[image:5.612.161.455.473.713.2]Technology (IJRASET)
Table 2 – Summarized results
Month Evap. Loss
(MCM)
Inflow
(MCM)
Overflow
(MCM)
ULBMC releases as per model
(MCM)
D/S releases as per model (MCM)
Storage at the end of month
(MCM)
Overflow (MCM)
June 16.48 503.21 0.00 80..91 272.96 1452.3 --
July 50.39 1757.67 0.00 22.81 103.61 2904.5 --
Aug 22.26 3456.17 0.00 81.81 407.4 5847.9 289.71
Sept 37.58 2351.00 289.71 61.67 394.24 7704.0 336.11
Oct 28.52 520.44 336.11 59..33 385.55 7750.4 --
Nov 21.24 93.20 0.00 84.14 404.25 7335.5 --
Dec 24.97 56.71 0.00 86.99 368.77 6911.5 --
Jan 35.65 4.66 0.00 93.02 366.9 6420.6 --
Feb 46.33 1.48 0.00 85.19 361.35 5929.2 --
Mar 39.44 0.74 0.00 90.04 352.57 5447.9 --
Apr 35.96 0.26 0.00 89.61 363.13 4959.5 --
[image:6.612.52.560.82.542.2]May 65.72 0.37 0.00 91.99 413.77 4388.4 --
Fig. 4 Monthly irrigation demand and releases as per GA model for downstream
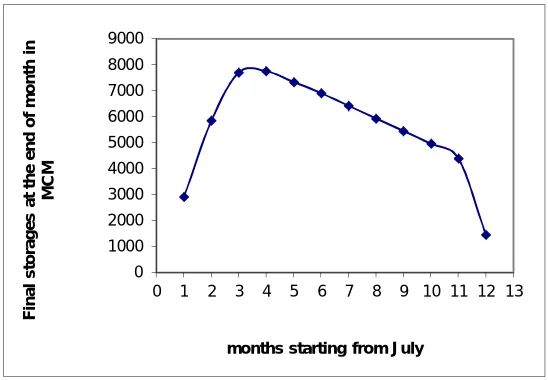
[image:6.612.177.438.586.709.2]The operating rule curve obtained for Ukai Reservoir is shown in Fig. 7. This rule curves show the final storage to be maintained in the reservoir in each month starting from July under inflows.
Fig 5. Monthly irrigation releases at different Inflows
0 50 100 150 200 250 300 350 400 450 Ir ri g a ti o n r e le a s e s i n M C M Months
Monthly irrigation demands and releases
as per GA model for downstream
Downstream requirement
GA model release
0.00 100.00 200.00 300.00 400.00 500.00 600.00
1 2 3 4 5 6 7 8 9 10 11 12
Ir ri g a ti o n r e le a s e s i n M C M
Technology (IJRASET)
[image:7.612.169.443.114.304.2]It is observed that storage is maximum at the start of October i.e. when monsoon has reaches its peak and consequently reduces to minimum in June to receive the next monsoon inflow, reduce flood damages and reduce water losses from the system. In the table II summarized results are shown.
Fig 6. Monthly reservoir storages at different Inflows
V. CONCLUSIONS
The GA approach is applied to Ukai reservoir system to derive operating policies for the multipurpose reservoir systems with single objective. The sensitivity analysis of GA model applied to this particular reservoir suggests optimal size of population to be used 100 and probability of crossover of 0.80, to find optimal releases for Ukai reservoir. The model resulted in an irrigation releases nearly equal to irrigation demand. Minimum storages are observed in start of monsoon i.e. at the end of water year and maximum storage is observed when the monsoon reaches to its peak. These types of rule curves are expected to be useful in real life implementation of reservoir operation.
REFERENCES
[1] Ahmed Juran Ali., Arup Kumar Sarma (2005), “Genetic algorithm for optimal operation policy of a multipurpose reservoir”, Water resources management, vol-19, pp 145-161.
[2] Goldberg, D.E. (1989), “Genetic algorithms in search optimization and machine learning”, Addison-Wesley, Reading, Mass.
[3] Janga Reddy M.and Nagesh Kumar D. (2005), “Multiobjective differential evolution with application to reservoir system optimization”, Journal of Computing in Civil Engineering, pp-861-878.
[4] Jotiprakash, V and Ganeshsan shanthi (2006), “Single reservoir operating policies using genetic algorithm”. J. of Water Resources Management (2006) vol.20: 917–929
[5] Labadie JohnW. (2004), “Optimal operation of multireservoir systems: state-of-the- art review", Journal of water resources planning and management, March/April, 2004, pp 93-110.Oliveira, R. and Louckas, D (1997), “Operating rules for multireservoir systems”, Water resources research J., vol. 33(4), pp.839-852.
[6] Sharif and Wardlaw (2000), “Multireservoir system optimization using genetic algorithms-Case study”, J. computation in civil engineering 14(4).pp-255-263. [7] Wardlaw and Sharif (1999), “Evaluation of genetic algorithms for optimal reservoir system operation”, J. water resource planning management., vol. 125(1), pp
25-33
[8] Yeh, W., (1985), “Reservoir management and operations models: A state-of-the-art review”, Water Resources Research J., vol. 21(12), pp.1797-1818. 0
1000 2000 3000 4000 5000 6000 7000 8000 9000
0 1 2 3 4 5 6 7 8 9 10 11 12 13
F
in
a
l
s
to
ra
g
e
s
a
t
th
e
e
n
d
o
f
m
o
n
th
i
n
M
C
M