Analyzing Gene Expressions in Saccharomyces
Cerevisiae using Hierarchical Clustering of DNA
Microarray Data
Rajbir Singh
Associate Prof. & Head Department of IT
LLRIET, Moga
Neha Garg
Students of M.Tech Department of CSE
LLRIET, Moga
Dheeraj Pal Kaur
Assistant Prof. (ECE) Department of ECE
LLRIET, Moga
ABSTRACT
Bioinformatics is a data intensive field of research and development. DNA microarray used to better understand form of saccharomyces cerevisiae disease such as cancer. Microarray allows us to diagnose and treat patients more successfully. Statistical method devoted to detection in DNA from microarray data, the inherent challenges in data quality associated with most filter techniques remains a challenging problem in microarray association studies. Applying methods of simulation studies and a genome-wide association microarray study in saccharomyces cerevisiae, that find current approach significantly improve DNA microarray cell reduces the yeast value rates and false positive genes variation. Clustering is the one of the main techniques for data mining. Microarray is the evolutionary history for a set of evolutionary related genes expression data. There are number of different distance based methods of which two are dealt with here: Euclidean method and Manhattan method.. A method for construction of distance based gens expression using clustering is proposed and implemented on different saccharomyces cerevisiae samples. Evolutionary distances between two or more genes are calculated using p-distance method. Multiple samples are applied on different datasets. Hierarchical clustering and k-mean clustering are constructed for different datasets from available data using both the distance based methods. Then, final cluster is constructed using these closely related filter dataset.
General Terms
Thresholding, Bioinformatics, Gene’s expression, Microarray, Data mining, Series analysis.
Keywords
Saccharomyces cerevisiae samples, Euclidean and Manhattan method, Hierarchical clustering and K-mean clustering, Profile levels, Principal component.
1.
INTRODUCTION
Deoxyribonucleic acid or DNA encodes the Genetic information of living organisms. DNA keeps information in the form of the base nucleotide sequence, which is a string of four letters namely adenine (A), thymine (T), guanine (G), and cytosine(C).Compared with the traditional approach to genomic research, which has focused on the local examination and collection of data on single genes, microarray technologies have now made it possible to monitor the expression levels for tens of thousands of genes in parallel. Filter technique use data set is quite large and a lot of the information corresponds to genes that do not show any interesting changes during the experiment. To make it easier
to find the interesting genes, the first thing to do is to reduce the size of the data set by removing genes with expression profiles that do not show anything interest. Saccharomyces cerevisiae is a species of yeast. Saccharomyces cerevisiae outside of a genes are affect the variation of gene expression with the traditional approach to genomic research, which is focused on the local examination and collection of data on single genes, microarray technologies have now made it possible to monitor the expression levels for genes in parallel. Microarrays are being touted as the great tool for diagnosis of disease ([1], [2], [3], [7]). Clusters of objects are formed so that objects within a cluster have high similarity in comparisons to one another but are very dissimilar to in other clusters. The purpose of gene-based clustering is to group together co-expressed genes which indicate linkage function and co-regulation data is to be clustered usingEuclidean distance and Manhattan distanceas distance metric ([5],([6]).
2.
METHODOLOGY
The main distance-based cluster-building methods are hierarchical clustering with profile and k-mean clustering with profile. Both rely on a different set of assumptions, and their success or failure in retrieving the correct clustering depends on how well any particular data set meets such assumptions.
2.1
Hierarchical Clustering with Profile
A set of N items to be clustered, and an N*N distance (or similarity) matrix, the basic process of hierarchical clustering is this:
1. Start by assigning each item to a cluster, so that if you have N items, you now have N clusters, each containing just one item. Let the distances (similarities) between the clusters the same as the distances (similarities) between the items they contain.
2. Find the closest (most similar) pair of clusters and merge them into a single cluster, so that now you have one cluster less.
3. Compute distances (similarities) between the new cluster and each of the old clusters.
4. Repeat steps 2 and 3 until all items are clustered into a single cluster of size N.
5. The profiles of the genes in these clusters have been plotted together using a simple loop.
2.2
K-mean Clustering with Profile
clusters) fixed a priori. The main idea is to define k centroids, one for each cluster. These centroids should be placed in a cunning way because of different location causes different result. So, the better choice is to place them as much as possible far away from each other. The next step isto take each point belonging to a given data set and associate it to the nearest. The algorithm is composed of the following steps:
1. Place K points into the space represented by the objects that are being clustered. These points represent initial group centroids.
2. Assign each object to the group that has the closest centroid.
3. When all objects have been assigned, recalculate the positions of the K centroids.
4. The profiles of the genes in these clusters have been plotted together using a simple loop.
Repeat Steps 2 and 3 until the centroids no longer move. This produces a separation of the objects into groups from which the metric to be minimized are calculated ([5], [6]).
2.3
Principal Component Analysis
A useful technique PCA which is used to reduce the dimensionality of large data sets, such as those from microarray analysis. PCA is used to find signals in noisy data. A scatter plot of the scores of the first two principal components shows that there are two distinct regions. This is not unexpected, because the filtering process removed many of the genes with low variance or low information. These genes would have appeared in the middle of the scatter plot. Scatter creates a grouped scatter plot where points from each group have a different color or marker.
3.
DEVELOPMENT OF ALGORITHM
The methodology for the proposed work involves the use of distance based methods for cluster construction and analysis data microarray. MATLAB software tools are used. Out of different Data Mining techniques, clustering method is used. The data is taken from the Gene Expression Omnibus site.
3.1
Constructed the Cluster
Step 1: Choosing an appropriate marker for the genes expression analysis: DNA microarrays to study temporal gene expression of almost all genes in Saccharomyces cerevisiae is a process of increased changes in the DNA sequence of the variable regions of antibody. Expression levels were measured at several time points during the diauxic shift. In this thesis work, studies have been carried out on both time series as well as genes sample microarray data.
Step 2: Perform filtering technique: This procedure illustrates how to filter the data by removing genes that are not expressed or do not change. The data set is quite large and a lot of the information corresponds to genes that do not show any interesting changes during the experiment. To make it easier to find the interesting genes, reduce the size the data set by removing genes with expression profile.
Step3: Compare other genes by plotting multiple lines on genes expression profile levels.
Step4: Construct the hierarchical cluster and k-mean cluster: hierarchical cluster with profile construction involves the profile of edited samples. pair-wise clustering that includes more than two samples same color .For constructing cluster, there have been hierarchical clustering, the function pdist calculates the pair wise distances between profiles, and the function linkage creates the hierarchical cluster is used in
Step5: Match and joining group of similar genes using cluster method.
Step 6: Determine a cluster building method: The algorithms of cluster-based include pair group method using minimum and Average method are taken in present work.
Step7: Show cluster group in different colour using PCA microarray.
3.2
Development of Algorithm
This work includes the construction of the clustering for Saccharomyces cerevisiae samples. The samples for the varieties are loaded from the GCO database. The filtering technique are calculated based method and cluster are constructed based on hierarchical clustering profile levels and k-mean clustering profile levels methods for different datasets. The closely related genes are selected based on the log2mean condition and the samples which are satisfying the yeast value are needed to different time sequences. The series are also aligned using multiple samples alignment. The cluster are compared and checked if they are similar or not. The steps are shown below
NO New samples
Yes
Fig.1: Flowchart for Cluster construction
4.
RESULTS AND DICUSSIONS
Using MATLAB the two series are calculated which are given as: first series: genomic 6400, samples=7 and second series: genomic 6423, samples=8, On the basis of these yeast values are constructed profile expression levels &hierarchical clustering profile &k-mean clustering profile. Profile expression Compare other genes by plotting multiple lines on the same figure. The gene associated with this ORF, ACS1, appears to be strongly up-regulated during the time. The function cluster calculates the clusters based on either a cutoff
Nan Indices Filter
Filtered genes
Scatter plot with colour Select Samples
Empty Spots Filter
Gene variance filter
Gene entropy filter Gene low variance filter
Statistics Toolbox software also has a K-means clustering function. Again, 16 clusters are found, but because the algorithm is different these are not necessarily the same clusters as those found by hierarchical clustering. Instead of plotting all of the profiles are plot just the centroids.
Fig 2: Hierarchical clustering profile genes 6400*7
Fig 3: Hierarchical clustering profile genes 6423*8
[image:3.595.55.280.124.658.2] [image:3.595.53.278.385.641.2]Fig 4: K-means clustering profile genes 6400*7
Fig 5: K-means clustering profile genes 6423*8
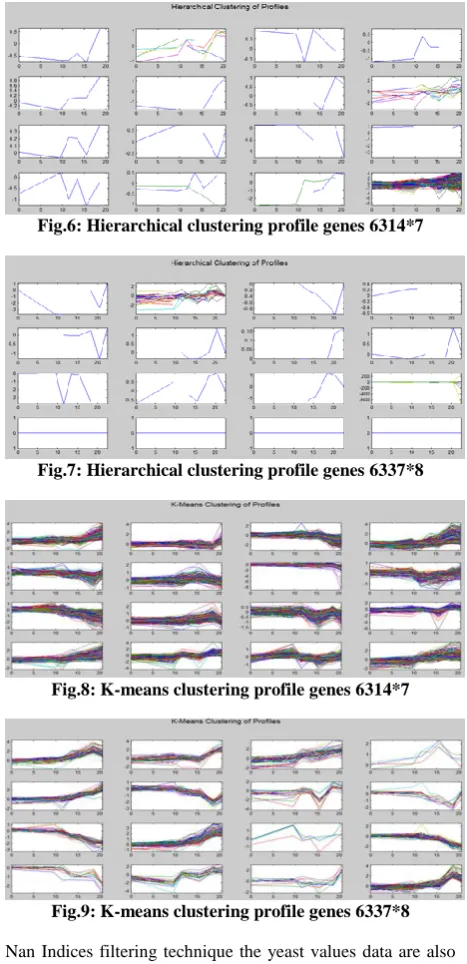
Then apply filtering technique on Saccharomyces cerevisiae samples. It used five filters. Empty spots filtering technique are show gene list in several spots marked as 'EMPTY'. These are empty spots on the array, and while they might have data associated with them, consider these points to be noise. First filter apply on genes result is genes = 6314, genes=6337
Fig.6: Hierarchical clustering profile genes 6314*7
Fig.7: Hierarchical clustering profile genes 6337*8
Fig.8: K-means clustering profile genes 6314*7
Fig.9: K-means clustering profile genes 6337*8
Nan Indices filtering technique the yeast values data are also see several places where the expression level is marked as
NaN. This indicates that no data was collected for this spot at the particular time step. One approach to dealing with these missing values would be to impute them using the mean or median of data for the particular gene over time. Second filter apply on genes result is: genes = 6276, genes=6292.
[image:3.595.317.546.627.724.2]Fig.11: Hierarchical clustering profile genes 6292*8
Fig.12: K-means clustering profile genes 6276*7
Fig.13: K-means clustering profile genes 6292*8
Gene variance filtering technique are out genes with small variance over time. The function returns a logical array of the same size as the variable genes with ones corresponding to rows of yeast data with variance greater than the 10th percentile and zeros corresponding to the threshold. Third filter apply on genes result is: genes = 5648, genes=5663.
Fig.14: Hierarchical clustering profile genes 5648*7
Fig.15: Hierarchical clustering profile genes 5663*8
Fig.16: K-means clustering profile genes 5648*7
Fig.17: K-means clustering profile genes 5663*8
Gene low variance filtering technique are removes genes that have very low absolute expression values. That the gene filter functions can also automatically calculate the filtered data and yeast values and used log2 mean method. Fourth filter apply on genes result is: genes = 423, genes=436.
Fig.18: Hierarchical clustering profile genes 423*7
Fig.19: Hierarchical clustering profile genes 436*8
Fig.21: K-means clustering profile genes 436*8
Gene entropy filtering technique are remove genes whose profiles have low entropy. Fifth filterapply on genes result is: genes = 310, genes=325.
Fig.22: Hierarchical clustering profile genes 310*7
Fig.23: Hierarchical clustering profile genes 325*8
Fig.24: K-means clustering profile genes 310*7
Fig.25: K-means clustering profile genes 325*8
Cluster of genes a manageable list of genes relationships between the profiles using some different clustering techniques from the Statistics Toolbox software. Cluster to create a heat map and dendrogram from the output of the hierarchical clustering. Red colour represents values above the mean, black colour represents the mean,and green colour represents values below the mean of a row (gene) across all columns.
Fig.26: Cluster 310 genes divided 5 groups
Fig.27: Cluster 325 genes divided 7 groups.
A scatter plot of the scores of the first two principal components shows that there are two distinct regions. The filtering process removed many of the genes with low variance or low information. These genes would have appeared in the middle of the scatter plot
Fig.28: Scatter plot of the scores genes 310*7
Fig.29: Scatter plot of the scores genes 325*8
Then create a scatter plot is with colour from the Statistics Toolbox software. Scatter creates a grouped scatter plot where points from each group have a different colour or marker. Use cluster data, or any other clustering function, to group the points.
Fig.31: Scatter plot of the scores with colour genes 325*8
[image:6.595.46.288.237.573.2]Principal-component analysis (PCA) is a useful technique you can use to reduce the dimensionality of large data sets, such as those from microarray analysis. PCA to find signals in noisy data.PCA calculate the principal components of a data set and consume to see the cumulative sum of the variances.
Table I: PCA genes 310*7
Series 1 PC ZSCROE PCVAR CUNSUM
Sample 1 0.0245 -4.3711 7.5936 78.3719
Sample 2 0.3033 0.7402 1.0505 89.214
Sample 3 0.1710 -0.6413 0.4090 93.435
Sample 4 0.2831 0.1427 0.2565 96.0831
Sample 5 0.1155 0.3703 0.2175 98.3283
Sample 6 0.4034 -0.1544 0.0961 99.3203
Sample 7 0.7887 0.394 0.0659 100.00
Table II. PCA genes 325*8
Series II PC ZSCROE PCVAR CUNSUM
Sample 1 -0.0229 -4.2589 7.8566 77.3431
Sample 2 0.2912 0.7891 1.0525 87.7045
Sample 3 0.1401 -0.7471 0.4688 92.3193
Sample 4 0.2933 0.2022 0.2899 95.1736
Sample 5 0.0236 0.02568 0.1108 97.1736
Sample 6 0.3600 -0.1522 0.0690 98.7267
Sample 7 0.8028 0.0162 0.0605 99.4043
Sample 8 0.1856 0.0134 0.5672 100,000
5.
CONCLUSIONS
In conclusion, It is demonstrated that the use of genes information improve the quality of DNA microarray. The major advantages is that they are computationally fast and are therefore capable of handling databases that are deemed to be too large for any other cluster methods. Model is constructed for microarray of genes expression different yeast varieties. Cluster method is used for finding the Evolutionary distances. Two clusters are constructed using filter technique for different datasets. Then by using the advanced pruning techniques, small cluster are combined to obtain the final cluster for complete dataset. Two clusters are constructed using Neighbor Joining method for different datasets. Clusters constructed using hierarchical cluster with profile and k-means clustering with profile are compared.
Cluster analysis (Hierarchical clustering) is used as data
improved accuracy. The overall advantage of DNA microarray may help us personalize medical treatments to match each patient’s genomic variations.
6.
REFERENCES
[1] A. Istvan, Travis N. (2007) “Mavrich Translational and rotational settings of H2A.Z nucleosomes across the Saccharomyces cerevisiae genome”, Nature 446, 572-576.
[2] Catalina Martínez-Costa, Marcos Menárguez Tortosa (2009) “A model-driven approach for representing clinical archetypes for Semantic Wwb environments”, JBI, vol.42, pp.150-164.
[3] D. Mark, D. Robinson (2010) “Bioconductor package for differential expression analysis of digital gene expression data”, vol.26, pp.139-140.
[4] F.Jihua , D.Xianhua (2010) “A simulation model for nucleosome distribution in the yeast genome based on integrated cross-platform positioning datasets”, Mathematical and Computer Modeling, PR China, Vol.52, pp.1932-1939.
[5] K. Archi and Dr. S. Amardeep (2013) “Implementing Phylogenetic Distance Based Methods for Tree Construction Using Hierarchical Clustering”, IJCSET 2013, Vol. 4, No. 07, pp. 54-61.
[6] L. Kaufman and P. J. Rousseeuw (2005) “Finding Groups in Data: an Introduction to Cluster Analysis”, 1sted. , John Wiley and Sons.
[7] R. Jen-hwa Chu1 Angela (2013) “Copy number variation genotyping using family information”, vol.14, pp.157-168.
[8] V. Heroen (2010) “Data mining approach identifies research priorities and data requirements for resolving the red algal tree of life”, BMC Evolutionary Biology, doi: 10.1186/1471-2148-10-16.
[9] O. Frick (2005) “Characterization of the metabolic shift between oxidative and fermentative growth in Saccharomyces cerevisiae by comparative 13C flux analysis”, Microb Cell Fact. Vol. no. 10, pp. 4-3.
[10]C. Harry (2011) “Implemented genome-wide methylation arrays has proved very informative to investigate both clinical and biological questions in human epigenomics”, PMC, vol. 2, pp. 88.
[11]I. S. Kohane, A. T. Kho (2003) “Microarrays for an Integrative Genomics”,Massachusetts, London, England, MIT Press Cambridge.
[12]U. Maulik and S. Bandyopadhyay (2000) “Genetic algorithm-based clustering technique”,Pat-tern Recognition, vol. 33, pp. 1455–1465.
[13]G. J. McLachlan, R. W. Bean (2002) “A mixture model-based approach to the clustering of microarray expression data”, Bioinformatics, vol. 18, pp. 413–422.
[14] D. Mark. Robinson (2010) “Bioconductor package for differential expression analysis of digital gene expression data”, vol.26, pp.139-140.