BIROn - Birkbeck Institutional Research Online
De Silva, Muthu and Howells, J. and Meyer, M. (2018) Innovation
intermediaries and collaboration: Knowledge–based practices and internal
value creation. Research Policy 47 (1), pp. 70-87. ISSN 0048-7333.
Downloaded from:
Usage Guidelines:
Please refer to usage guidelines at
or alternatively
Contents lists available atScienceDirect
Research Policy
journal homepage:www.elsevier.com/locate/respol
Innovation intermediaries and collaboration: Knowledge
–
based practices
and internal value creation
Muthu De Silva
a,b,⁎, Jeremy Howells
c, Martin Meyer
a aKent Business School, University of Kent, Canterbury, Kent, CT2 7FS, UKbBirkbeck, University of London, Malet Street, London, WC1E 7HX, UK cKellogg College, University of Oxford, 62 Banbury Rd, Oxford, OX2 6PN, UK
A R T I C L E I N F O
JEL classification: O300 L10 L14 M15 D830
Keywords:
Innovation intermediaries Knowledge based practices Value creation
European union
Research and technology organisations Knowledge capitalization
A B S T R A C T
This paper analyses how knowledge-based practices adopted by innovation intermediaries enable them to generate value for themselves when collaborating with their clients. While the literature focuses on value creation for their client organisations, little is known about how innovation intermediaries create internal value even though this is essential for ensuring their long-term survival and sustaining their key facilitating role in the innovation system. This understudied issue is explored using empirical evidence from a sub-set of innovation intermediaries, Research and Technology Organisations (RTOs). The results indicate that by capitalising on existing knowledge vested in employees and collaborators as well as understanding and shaping the knowledge base of the innovation ecosystem, innovation intermediaries generate internal value from their involvement in collaborative innovation, which range from differentfinancial to non-financial types of value. Implications for intermediaries, their collaborators and for policymakers are then discussed.
1. Introduction
This paper investigates how knowledge-based practices adopted by innovation intermediaries enable them to generate internal value for themselves when collaborating with their clients. Innovation has long been seen as a major factor in economic growth and development. In turn, innovation intermediaries have become recognised as key actors in the innovation landscape, improving firms’ innovative speed and performance (Knockaert et al., 2014; Lin et al., 2016). Innovation in-termediaries, broadly defined as“organisations that provide a suppor-tive role for collaboration between two or more parties during various stages of the innovation process”(Howells, 2006, 721), are therefore seen to be central to creating and maintaining a successful innovation ecosystem (Sieg et al., 2010). The role of innovation intermediaries extends from linking parties for collaboration, to setting up and med-iating relationships and bridging a wide array of knowledge, compe-tency and capability gaps (Smedlund, 2006; Klerkx and Leeuwis, 2008a; Klerkx and Leeuwis, 2008b; Edler and Yeow, 2016). Among the varied types of engagement by innovation intermediaries (Howells, 2006) their interaction in collaborative projects represents one of their more complex, enriched and involved roles as they (in addition to developing
and supporting the partnership) engage in co-creative innovative ac-tivity with collaborators, in a process of wider co-creation and co-de-velopment (Boon et al., 2011).
Whilst past research has extensively discussed the role of innovation intermediaries and how they generate value for their clients (Sawhney et al., 2003; Howells, 2006; Verona et al., 2006; Sapsed et al., 2007; Nambisan and Sawhney, 2007; Arnold et al., 2010; Tran et al., 2011; Landry et al., 2013; Knockaert and Spithoven, 2014), there is a lack of understanding on what enables intermediaries to generate value for themselves in the context of their engagement in collaborative in-novation. This is a non-trivial issue as business and innovation move towards more open and networked environments.‘Who gets what’in terms of value creation is a crucial issue in modern business dynamics with actors operating in a system in which‘we move from single-firm revenue generation towards multi-firm control and interface issues’ (Ballon, 2007, 7). How to efficiently capture value for each actor within dispersed networks remains a daunting task, but is essential for the long-term survival of not only businesses (Johnson et al., 2008), but also innovation intermediaries (del Águila-Obra et al., 2007; Lopez and Vanhaverbeke, 2009).
It is this aspect of the internal value creation by innovation
http://dx.doi.org/10.1016/j.respol.2017.09.011
Received 16 November 2016; Received in revised form 23 September 2017; Accepted 25 September 2017
⁎Corresponding author at: Kent Business School, University of Kent, Canterbury, Kent, CT2 7FS, UK.
E-mail addresses:[email protected],[email protected](M. De Silva),[email protected](J. Howells),[email protected](M. Meyer).
Available online 10 October 2017
intermediaries, which the literature has not yet been able to adequately address (Krenz et al., 2014), that is the focus of this paper. Theinternal value could be multidimensional comprising both financial and
non-financial values. The immediate gain for innovation intermediaries from client engagement can be expected to be fromfinancialbenefits in terms of: (a) revenues generated by services they provide for clients, or (b) funding secured from research grants. Apart from thesefinancial gains, intermediaries also generatenon-financialvalue that consists of knowledge,marketandnetworkbased benefits. In collaborative projects intermediaries with other partners may develop new knowledge (Mowery et al., 1996; Gulati, 1999; Kale et al., 2000), capabilities re-quired to deploy such knowledge (Hardy et al., 2003; Cepeda and Vera, 2007; Martín-de Castro, 2015), intellectual property (Martín-de Castro 2015), new forms of innovation (Earl, 2001) and useful networks (Nagaoka and Kwon, 2006). Although this, taken to the extreme, might be seen as parasitic or exploitative of their clients, innovation inter-mediaries need to generate sufficient gains for their long-term survival, without which the generation of value to their clients and their wider systemic benefits would not be possible.
In the ability of innovation intermediaries to generate internal value, the effective development and utilisation of knowledge is a cri-tical component (Wenger and Snyder, 2000; Teece, 2004; Alavi et al., 2005; Knockaert et al., 2014), especially in the context of collaborative innovation (Pisano and Teece 2007; Lichtenthaler and Lichtenthaler, 2009). The knowledge-based view of thefirm (Kogut and Zander, 1996; Spender, 1996) as well as the open innovation literature (Chesbrough, 2003; Chesbrough, 2006; Dahlander and Gann, 2010) highlight that valuable knowledge exists not only within organisational boundaries, but also outside the firm. As such,firms’ability to explore, acquire, retain, integrate and exploit knowledge (Grant, 1996), is central tofirm value creation (Gold et al., 2001; Klerkx and Leeuwis, 2008c; Lichtenthaler and Lichtenthaler, 2009; Knockaert and Spithoven, 2014).
Where do innovation intermediaries come into this process of knowledge management and coordination? The agency issue and role of cooperation and coordination is complex and not easy to resolve (Holmstrom, 1989), but a number of studies have started to explore the role of intermediaries in the knowledge creation and innovation pro-cess. They cover knowledge search, problem solving and connecting and coordinating knowledge between actors (Agogué et al., 2013a; Hargadon and Sutton, 1997) through to commercialising new tech-nologies (Aldrich and von Glinow, 1992). Thus, the successful provision of innovation intermediaries’services involves the handling of complex knowledge (Klerkx and Leeuwis, 2008c; Lichtenthaler and Lichtenthaler, 2009). Innovation intermediaries therefore act as knowledge repositories that introduce new combinations of knowledge and also make knowledge-based contributions when providing solu-tions to their clients (Hargadon and Sutton, 1997; Howells, 2006). In-novation intermediaries appear to be developing new methods and practices in more unknown knowledge environments where risk and uncertainty are high and where sophisticated management principles have to be developed (Agogué et al., 2013b). Thus, the successful de-livery of the intermediation process requires the effective adoption of knowledge-based practices, through which internal value is generated. Even though there is extensive research on investigating how to manage knowledge effectively in collaborative arrangements (Kale et al., 2000; Grant and Baden-Fuller, 2004), the positioning of innovation inter-mediaries in these studies has been as institutions that help other or-ganisations to manage knowledge and extract value (Lee et al., 2010; Spithoven et al., 2010) rather than on the intermediariesthemselves.
Using data from a survey of Research and Technology Organisations (RTOs), an important form of innovation intermediary (Howells, 2006; Oxford Economics, 2008; Arnold et al., 2010; Landry et al., 2013; Miller, 2014), the paper seeks to contribute in three ways to our knowledge of innovation intermediaries and their clients: (1) for in-novation intermediaries to more effectively assess and design
knowledge-based practices depending on which type of value they in-tend to generate; (2) indirectly, by allowing innovation intermediary clients’to better identify and appreciate which aspects of their colla-boration intermediaries benefit from the most; and, (3) for policy-makers to put in place better measures to support intermediaries as a pathway for wider innovation ecosystem value generation.
The remainder of this paper is organised as follows. The next section outlines a set of hypotheses developed to indicate how different knowledge-based practices may determine an innovation inter-mediaries’ability to generate both financial and non-financial value. This will be followed by methodology section and the paper then concludes by discussing the results, limitations and future research di-rections of the study.
2. Background literature
2.1. Internal value generation by innovation intermediaries through collaborative projects
Innovation intermediaries have been characterised as organisations that generate value to other actors within a system of innovation (Sawhney et al., 2003; Verona et al., 2006; Nambisan and Sawhney, 2007; Arnold et al., 2010; Tran et al., 2011). The focus has therefore been on studying how intermediaries enable their clients to leverage external technologies (Howells, 2006), existing design solutions (Hargadon, 2002), the knowledge and experience of customers (Verona et al., 2006), the expertise of external specialists (Tran et al., 2011) and exchange platforms (Lichtenthaler and Ernst, 2008). Nevertheless, in order for innovation intermediaries to successfully perform these tasks they need to generate internal value for themselves from such en-gagement with clients.‘Internal value’is defined as the sum of both
financial and non-financial values generated from their clients by in-novation intermediaries. The internal value generated by inter-mediaries during collaborative projects will be multi-dimensional, comprising both (a)financial and (b) non-financial gains (Huizingh, 2011).
2.2. The importance of adopting knowledge-based practices
Knowledge-based practices adopted by innovation intermediaries can influence their ability to generatefinancial and non-financial value from collaborative projects (Wenger and Snyder, 2000; Gold et al., 2001; Alavi et al., 2005; Martín-de Castro, 2015). The knowledge-in-tensive role of innovation intermediaries (Aldrich and von Glinow, 1992; Klerkx and Leeuwis, 2008a,b; Mount et al., 2015) heightens the need for them to systematically make use of external and internal sources of knowledge, such as employees, clients, collaborators and business (Lin et al., 2012), by integrating these effectively within their organisational and innovation processes (Escribano et al., 2009). Nevertheless, managing knowledge effectively for sustainable value generation is a complex process (Gold et al., 2001) since it requires the adoption of human capital associated knowledge-based practices, re-cognised as crucial for collaborative innovation success (Gassmann et al., 2010; Sieg et al., 2010; Boari and Riboldazzi, 2014). The re-cognition of the need for increased knowledge task specialization was noted by AdamSmith (1776)who stressed that the most fundamental aspect of the division of labour was the division of knowledge and the associated combinatorial ways of producing knowledge (Metcalfe, 2002). Invention, in particular, requires individuals (Rosenberg, 1965, 132–133) to draw upon the diversefields of knowledge and therefore the know-how needed to perform complex tasks can be very divided (Nelson, 2003, 911). Successful knowledge management with regard to innovation must therefore be centred on the individual (Howells, 2012, 1005) as meaning and knowledge is ultimately based within individual minds (Polanyi, 1961; Morton, 1997).
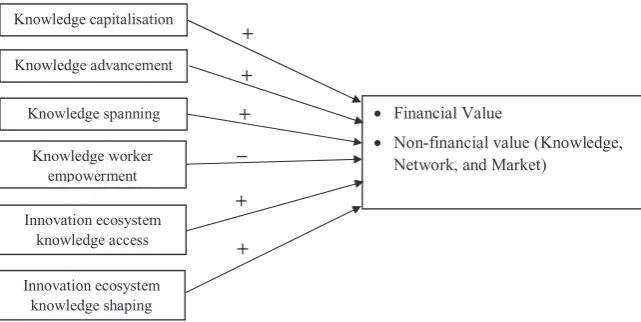
3. Theoretical framework and hypotheses
On the basis of the above discussion, this section proposes six hy-potheses to investigate how knowledge-based practices enable in-novation intermediaries to generate internal value for themselves. These six knowledge bases practices encompass mechanisms associated with managing knowledge vested in‘individuals’within intermediaries and their innovation ecosystem. They are: (1) ‘knowledge capitalisa-tion’associated with leveraging and recombining existingknowledge, both internally and externally between employees, partners and wider networks; (2) ‘knowledge advancement’ related to acquiring new knowledge, absorbing and internalising it; (3) ‘knowledge spanning’
covering the ability of an innovation intermediary to access unrelated knowledge that is non-adjacent to an intermediary’s knowledge base; (4) ‘knowledge worker empowerment’ associated with practices to empower employees engaged in collaboration as to how to use knowledge; (5)‘innovation ecosystem knowledge access’is related to the ability of an intermediary to possess knowledge of its wider in-novation ecosystem; and, (6) ‘innovation ecosystem knowledge shaping’is associated with practices and routines aimed at shaping the overarching collaborative framework and institutional form of the in-novation system. Each of these hypotheses will now be explored in more detail (Fig. 1).
3.1. Practices for knowledge capitalisation
Leveraging and recombiningexistingknowledge, both internally and externally between employees, partners and wider networks, termed here as‘knowledge capitalisation’, is found as essential if an organisa-tion, such as an innovation intermediary, is to generate value from collaborative innovation (Davenport et al., 1998; Gold et al., 2001).
‘Knowledge capitalisation’ practices include: retaining experienced staff; having a dedicated team working on specific tasks; capitalising on personal networks of staffand business-to-business relationships; and, engaging with partners with positive working experience (Hobday, 2000; Lichtenthaler and Lichtenthaler, 2009; Dahlander and Gann, 2010).
Capitalising on knowledge accumulated in trustworthy relationships increases the reliability, breadth and depth of tacit and codified knowledge available to an organisation (Nielsen, 2005), improves an organisation’s innovative performance (Martín-de Castro, 2015) and enhances their market advantage (Yli-Renko et al., 2001). Knowledge capitalisation also helps address common causes for failure in colla-borative projects by reducing cost and uncertainty (Granovetter, 1985; Vlaar et al., 2007) as well as the‘psychic’distance between partners (i.e., the degree of factors that prevent theflow of information between partners; see, for example,Bruneel et al., 2010; Bruneel et al., 2015), whilst increasing trust (Paulraj et al., 2008) which is vital for inter-mediaries to generate internal value.
Nevertheless, this may not be a wholly positive process; there are a number of negative aspects and problems associated with this focus. Capitalising onexistingknowledge could increase in-breeding, reducing the innovativeness of an organisation (Saviotti, 1996) and hence the long-term ability to generate value through collaboration (Sethi et al., 2002). A greater reliance on the knowledge of existing individuals (whether they are employees or collaborators) also increases the risk of knowledge loss to intermediaries since these individuals could always change their association or, even worse, join competitors (Davenport et al., 2002; Oliver, 2004), diminishing the ability to generate internal value through collaboration. Yet, when considering the role of in-novation intermediaries as‘bridgers’of knowledge between organisa-tions and those that introduce new combinaorganisa-tions of knowledge–which necessitates them to make the most out of their existing trustworthy knowledge–(Hargadon and Sutton, 1997; Howells, 2006), it is possible to suggest that they would benefit from adopting practices for knowl-edge capitalisation regardless of potential negativities:
H1.The adoption of practices for knowledge capitalisation positively influences the generation of financial and non-financial value for innovation intermediaries in collaborative projects.
3.2. Practices for knowledge advancement
In addition to exploiting current knowledge, acquiringnew knowl-edge, absorbing and internalising it (Garud and Nayyar, 1994; Smith et al., 2005; Knockaert et al., 2014) is essential for advancing and de-veloping new business opportunities as well as helping to avoid lock-in (Saviotti, 1996). This capability is termed here as ‘knowledge ad-vancement’. By being able to identify knowledge gaps through mapping current knowledge and having the capability andflexibility to integrate new with existing knowledge are key prerequisites for knowledge ad-vancement (Lichtenthaler and Ernst, 2006). Examples of practices in knowledge advancement include adopting a structured approach to-wards actively exploring and internalising new knowledge, hiring new staff who possess the required new knowledge (Earl, 2001; Lichtenthaler and Lichtenthaler, 2009) and better team-based learning techniques both within and across organisational boundaries (Scardamalia, 2002). Advancing knowledge is considered critically important for sustainability in an era of short product life cycles, ad-vanced technological developments and considerable economic un-certainty (Bowonder and Miyake, 2000).
However, since innovation intermediaries are mainly involved in handling and integrating knowledge bases of innovation ecosystem actors by exploiting current knowledge (i.e. their positioning as the
which the identification of opportunities for new knowledge re-combination would be impossible. Based on this particular importance and the positive effects of this practice, the second hypothesis is: H2.The adoption of practices for knowledge advancement positively influences the generation of financial and non-financial value for innovation intermediaries in collaborative projects.
3.3. Practices for knowledge spanning
The ability of an innovation intermediary to access new, unrelated knowledge that is non-adjacent to an intermediary’s knowledge base through‘knowledge spanning’is also an important competence for an organisation (Grant and Baden-Fuller, 2004). External unrelated knowledge is often required for a specific project (Earl, 2001), the complexity of which necessitates multi-disciplinary knowledge bases of different parties to be combined (Curley and Salmelin, 2013; Perkmann and Schildt, 2014). Intermediaries often access technical knowledge from universities or other organisations that possess ‘unrelated’ knowledge bases to achieve common goals for the success of a specific project. Since organisations engage in technical knowledge access are not inclined to internalise partners’knowledge, they remain specialists in their own domains of knowledge (Grant and Baden-Fuller, 1995; Lui, 2009).
Whilst projects that involve integrating ‘unrelated’ or multi-disciplinary knowledge are found to generate several benefits (Rhoten and Pfirman, 2007), accessing technical knowledge is not been without its challenges. This is due to difficulties faced by being unaware of the knowledge bases of other collaborators, which in turn leads to high transaction costs, uncertainty of outcomes and risk of failure (Zukin and DiMaggio, 1990; Petruzzelli and Rotolo, 2015). Particularly when considering the role of innovation intermediaries, it could be assumed that such challenges would be at a minimum since intermediaries are inherently successful at working with a wide array of actor types. On this basis, the third research hypothesis is:
H3.The adoption of knowledge spanning practices positively influences the generation of financial and non-financial value for innovation intermediaries in collaborative projects.
3.4. Knowledge worker empowerment
There is a danger of having an exclusive emphasis on organisational level factors and disregarding individual level determinants. Since in-novation is a multi-level phenomenon (Gupta et al., 2007), the attitudes of individuals/employees engaged in collaboration influence the overall success of the organisation (Gavetti, 2005). Whilst top-down approache ensures the whole organisation to coherently achieving its vision, lack
of employee empowerment on how they develop and use knowledge can lead to employee dissatisfaction and demotivation (Ford and Fottler, 1995). Hence, empowering knowledge workers by adopting practices that engender positively motivated staff(Gold et al., 2001; Lichtenthaler and Ernst, 2006) is seen to be an effective practice for innovation success (Argyris, 1998; Collis and Moonen, 2008).
Nevertheless, there is the danger that employee empowerment could potentially dilute the achievement of organisational outcomes (Jensen 2001). Since intermediaries work with several external orga-nisations, empowering employees may result in coordination problems, as staff adopt individualistic or temporary practices, which do not conform to more standard or transferable rules between individual staff
and their team members. This can often lead to a loss of control, thereby inducing opportunism and increased uncertainty (Mils and Ungson, 2003). Hence, while the adoption of these types of practice is important for value creation in collaborative projects, empowerment could also result in the inability of an organisation to coherently achieve intended objectives. This leads to the fourth hypothesis:
H4.The adoption of practices to empower knowledge-based workers negatively influences the generation of financial and non-financial value for intermediaries in collaborative projects
3.5. Practices for access to innovation ecosystem knowledge
A successful intermediation role requires having a better awareness of the needs, resources and competencies of a wide array of actors of a system of innovation and their institutional framework (Howells and Roberts, 2000; Muller and Zenker, 2001; Kauffeld-Monz and Fritsch, 2013), which is termed here as‘innovation ecosystem knowledge’. The practices adopted by innovation intermediaries to access innovation ecosystem knowledge include using digital platforms that have in-formation on the interests, knowledge and competences of potential partners as well as actively developing new relationships with key players (Howells and Roberts, 2000) through which intermediaries could enhance their awareness of the ecosystem. These practices and routines for innovation-ecosystem knowledge access differ from those for knowledge capitalisation (H1) and knowledge advancement (H2). The former involves enhancing awareness of ecosystem through new relationship building, whereas the latter involve in making use of knowledge vested inpre-existing relationships (H1) and in acquiring
‘new’knowledge to advance and fulfil‘knowledge gaps’by recruiting newstaff(H2), respectively.
[image:5.595.39.360.55.216.2]Nevertheless, the benefit of accessing the innovation ecosystem knowledge base using external sources and actively attempting to de-velop new relationships may be questionable as new knowledge/re-lationships might not be reliable or prove to be successful (Davenport et al., 1998; Dyer and Nobeoka, 2000). Hence, the chances of benefiting
from the time and effort made to access the knowledge of the innova-tion ecosystem might be low. Yet, developing knowledge about the wider innovation ecosystem is vital to intermediaries in order to iden-tify new opportunities to combine knowledge, mitigate uncertainty about profitability of collaboration, assess the value of available in-tellectual property and to bring suitable parties together for colla-boration (Kodama, 2008). On this basis, thefifth hypothesis is: H5. The adoption of practices for innovation ecosystem knowledge access positively influences the generation of financial and
non-financial value for innovation intermediaries in collaborative projects
3.6. Practices for shaping the innovation ecosystem knowledge base
Collaboration is difficult when partners have diverse interests, goals and motivations. One way of overcoming this is through shaping the interests of actors within an innovation system to increase the chances of reaching a shared understanding and mutuality between the parti-cipating actors which is important for successful collaboration (West and Gallagher, 2006; Wallin and von Krogh, 2010; Tjong et al., 2015). Practices and routines aimed at sustaining influence over potential collaborators and influential decision makers are seen as the‘political’
side of collaboration (Hardy and Phillips, 1998) During this process, innovation intermediaries externalise relevant knowledge to influence actions and interests of potential partners (Arnold et al., 2010). Thus, innovation intermediaries, in collaboration with other actors in the innovation system, often engage in helping to shape the strategic policy direction, which results in convergence around the interests of actors within the region or nation (Bouwen, 2002). Some even argue that developing consensus is one of intermediaries’ key functions (Etzkowitz, 2008; Meyer et al., 2017).
Nevertheless, there is no direct evidence to suggest that shaping the ecosystem would help intermediaries to generate internal value through collaborative projects (seeMazey and Richardson 2006) and indeed they may generate negative impacts by exposing intermediaries’
knowledge too much to external parties, with intermediaries losing their competitive advantage (Dyer and Nobeoka 2000). Yet, con-sidering the specific role of intermediaries as those who bring together partners with different knowledge bases (Agogué et al., 2013a; Hargadon and Sutton, 1997), it could be argued that these practices aimed at shaping the knowledge base of the ecosystem increase the chance of securing projects andfinding partners with common interests, thereby leading to value generation. This leads to thefinal hypothesis: H6. The adoption of practices that shape the knowledge base of an innovation ecosystem positively influencesfinancial and non-financial value generation by intermediaries in collaborative projects
These six hypotheses were then used in the study to investigate how practices adopted by innovation intermediaries enable them to generate
financial and non-financial value. Please note that, considering the exploratory nature of this study, signs are merely preliminary ex-pectations about the causality (Fig. 1).
4. Methodology
4.1. Methodological framework
The empirical base is a study of EU based RTOs that investigated how knowledge-based practices adopted by innovation intermediaries influence the generation offinancial and non-financial value during their engagement in EU funded projects, undertaken in collaboration with businesses, universities, public research organisations and RTOs (Andersen and Blanc, 2013). RTOs are a particular form of innovation intermediaries with origins around public ownership and the need to support the transfer of knowledge between science and industry.Hales (2001, p.4) has defined them as“organisations with significant core
government funding which supply services to firms individually or collectively in support of scientific and technological innovation and which devote much of their capability to remaining integrated with the science base”. Most RTOs, such as the Fraunhofer-Gesellschaft, were created to facilitate the transfer of knowledge from the science base to
firms and have an applied research focus (van Lente et al., 2003). The majority of RTOs operate between a technical science base, on the one hand, and manufacturing industries, on the other; what they define as
“hard intermediary”functions, such as technology testing. However, the functions of RTOs have broadened over time (Miller, 2014) to in-clude more soft forms, such as business service activities around net-working and consultancy (EARTO, 2017, 1). Research has highlighted that there is no single‘ideal type’RTO, and that each must be tailored to its innovation environment (Miller, 2014). Thus, RTOs are a sig-nificant type of innovation intermediary and key actors within the wider European system of innovation. RTOs receive about 30% of their income from government, 30% from competitive public and private grants and the rest from industry as contract income (Martínez-Vela, 2016). RTOs also coordinated a third of all EU research and innovation projects (Arnold et al., 2010) and led some 258 Horizon 2020 projects in 2015 (EARTO, 2017, 7). RTOs engage in a range of tasks in these EU projects, ranging from bringing parties together for collaboration to providing applied research to the consortium. A database of RTOs compiled by the Big Innovation Centre has identified that there are 122 European RTOs in total distributed across the seven EU member states with eight types of organisation (Andersen and Blanc, 2013) was the empirical base for the survey.
A mixed method approach to improve the validity of the overall study (Tashakkori and Teddlie, 1998; Bisbe et al., 2007) was adopted with three main stages: (1) an initial qualitative data gathering stage; (2) an online, quantitative survey; and, (3) a follow-up, depth in-terview phase. The data gathered through initial inin-terviews were checked against theoretical explanations to validate the conceptual framework and to develop the questionnaire survey, which was im-portant since the paper addresses an underexplored topic (Edmondson and Mcmanus, 2007; Autio et al., 2013). A total of 68 responses were received back, of which 59 were then usable after data cleaning, presenting a response rate of 48.3%. The non-response bias test re-vealed that there is no significant difference between respondent RTOs and the full empirical base of 122 RTOs in terms of type of centre [X2(5, 179) = 2.217,p= 0.818 > 0.05], sector of operation of RTOs [X2(3, 179) = 1.546,p= 0.672 > 0.05], turnover of RTOs (i.e. categorised as small medium and large) [X2(2, 179) = 3.308,p= 0.191 > 0.05], and number of employees (i.e. categorised as small medium and large) [X2(2, 179) = 1.272,p= 0.529 > 0.05].
The third phase interviews generated context-specific and in-depth understanding of the causality derived from the survey data (Downward and Mearman, 2007). Finally, a validation event with survey participants and a group of their collaborators, representing the ecosystem, was conducted to further verify the study findings. The adoption of this sequential mixed method design improved the validity and reliability of the overall study.
4.2. Variable construction
The main source of data was derived from the online survey and the
findings of in-depth interviews were used to validate the former (Kim and Miner, 2007; Autio et al., 2013). In addition, several control vari-ables capturing the characteristics and innovation approaches of in-novation intermediaries were also included in thefinal model.s 4.2.1. Dependent variables
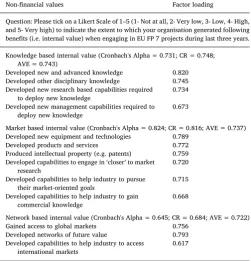
derived by requesting respondents to state the average annual income generated by their organisation (i.e. with respect to a particular centre, but not the group of centres) through EU Framework programmes (FP) during last three years. Since the data was collected in 2014, the period covered was 2011–13. Similarly, focusing on the same time span, variables for the three non-financial types of value were constructed by requesting respondents to state the extent to which they have generated specific benefits as a result of their engagement in EU projects on a Likert Scale of 1–5. These specific benefits representing each type of non-financial value were identified by checking thefindings of initial interviews against the theoretical framework. These responses clearly supported the conceptual development of three non-financial values (Section 2.1), thus used in the questionnaire survey to gather in-formation on internal value creation.
In terms of the reliability and validity of the measures internal consistency and uni-dimensionality were tested to assess the possibility of generating a single score for each non-financial value by aggregating the ratings of different benefits. The factor analysis resulted in gen-erating only one factor with an Eigen value more than 1 for knowledge (2.22, 55.50%), market (3.270, 54.5%) and network (1.581, 52.71%) based value (Table 1). Cronbach's Alpha for knowledge, market and network based values were 0.731, 0.824, and 0.645 respectively, in-dicating an acceptable level of internal consistency among items (i.e. benefits) used to construct three variables. The Composite Reliability (CR) (Chin, 1988) and Average Variance Extracted (AVE) (Fornell and Larcker, 1981) indices being more than 0.6 and 0.7 respectively further confirms the reliability of the measures and AVE also confirms the convergent validity. All these results indicate the suitability of variables constructed to measure three types of non-financial value.
4.2.2. Independent variables
Independent variables to representfive of the six knowledge-based practices were constructed using 13 practices identified from the lit-erature (Sections3.1–3.6), validated through initial interviews. During initial interviews it was evident that the practices adopted by RTOs would not drastically change at least during one EU framework pro-gramme. Since the data was gathered in 2014, the data on
knowledge-based practices is those adopted during the EU Framework Programme 7 (FP7) ran from 2007 to 2013. These practices were presented to the respondents who were requested to state to what extent they would adopt each practice on a 1–5 Likert scale. In relation to ‘innovation ecosystem knowledge influence’it was evident during initial interviews that different RTOs use different routes to shape the knowledge base of the European system of innovation, which may differently influence value creation. A total of 18 such sources were identified and re-spondents were requested to state the extent of use on a Likert scale of 1–5. The reliability and validity of the measures were further confirmed by empirical evidence. Thefirstfive variables of knowledge routines and practices were derived by performing a Principal Component Analysis (PCA) on the 13 practices. Five components with Eigen value≥1 were identified (Table 2). The Kaiser-Meyer-Olkin Measure is 0.655 (> 0.5); indicating that the patterns of correlations are relatively compact and factor analysis should yield distinct and reliable factors. The five components explain 70.25% of variance (i.e. C1–27.8%, C2–14.03%, C3–11.46%, C4–9.4%, C5–7.48%). The CR and AVE in-dices being more than 0.5 further confirms the reliability of the mea-sures and AVE also confirms the convergent validity (Table 2).
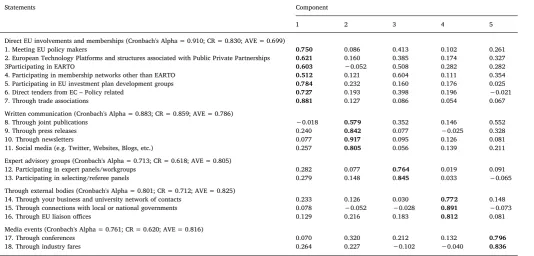
A second PCA was conducted to construct variables for the sixth knowledge-based practice, ecosystem knowledge influence, which re-sulted in identifying five components with high factor loading (i.e. > 0.5). Kaiser-Meyer-Olkin Measure of Sampling Adequacy was 0.763 and 78.307% variance was explained by thefive components. Thefirst component (Table 3) was identified as influencing through active involvements in EU activities and membership-based network organisations (for example, trade associations), the second component represents influence exerted from written media communication, the third component indicates participating in expert advisory groups, the fourth the influence made through collaboration with external bodies (such as EU liaison offices and universities) and thefifth component illustrates the influence felt by the use of media events. It was analysed how the level of use of these five types of routes determine inter-mediaries’ability to generatefinancial and non-financial value. 4.2.3. Control variables
Several control variables capturing the characteristics of innovation intermediaries and their innovation approaches were used. The general characteristics of innovation intermediaries may influence value gen-eration in EU projects. Turnover (i.e. average annual turnover during last three years; Hauser, 2010), age (as an indicator of experience; Bruneel et al., 2010), sector of operation, and number of employees engaged in EU activities (Fontana et al., 2006; Kirkels and Duysters 2010), together with variables covering RTOs’FP7 engagement, were all controlled for. Thus, the extent to which innovation intermediaries collaborate with different actors in an ecosystem may determine their ability to generate value through collaboration (Lee et al., 2010). For instance, collaborating with large firms provides innovation inter-mediaries with more economic advantages compared with universities and smallfirms (Wright et al., 2008; Huizingh, 2011; Howells et al., 2012) due to largefirms’capacity to develop long-term relationships and the size of their resource base (Huizingh, 2011). Nevertheless, large
[image:7.595.38.290.84.346.2]firms may have less need for intermediaries. By contrast, small and medium-sized enterprises (SMEs) and universities may have a higher reliance on innovation intermediaries (Yusuf, 2008; Lee et al., 2010; Howells et al., 2012) due to their need to overcome organisational and cultural issues of dealing with increased external contacts (Van de Vrande et al., 2009). Hence, intermediaries may have a greater chance to interact with SMEs and universities. Past studies on RTOs suggest that RTOs differ in terms of their collaborators. Whilst some RTOs seem to collaborate with largefirms to a greater extent, other RTOs seem to focus on developing a stronger network with local small businesses (Albors et al., 2014), which would indeed impact on the type of internal value they generate. Hence, the extent to which innovation inter-mediaries collaborate with different actors in an EU project was
Table 1
Variable construction of non-financial value: questionnaire items.
Non-financial values Factor loading
Question: Please tick on a Likert Scale of 1–5 (1- Not at all, 2- Very low, 3- Low, 4- High,
and 5- Very high) to indicate the extent to which your organisation generated following
benefits (i.e. internal value) when engaging in EU FP 7 projects during last three years.
Knowledge based internal value (Cronbach's Alpha = 0.731; CR = 0.748; AVE = 0.743)
Developed new and advanced knowledge 0.820
Developed other disciplinary knowledge 0.745
Developed new research based capabilities required to deploy new knowledge
0.734
Developed new management capabilities required to deploy new knowledge
0.673
Market based internal value (Cronbach's Alpha = 0.824; CR = 0.816; AVE = 0.737)
Developed new equipment and technologies 0.789
Developed products and services 0.772
Produced intellectual property (e.g. patents) 0.759
Developed capabilities to engage in‘closer’to market
research
0.720
Developed capabilities to help industry to pursue their market-oriented goals
0.715
Developed capabilities to help industry to gain commercial knowledge
0.668
Network based internal value (Cronbach's Alpha = 0.645; CR = 0.684; AVE = 0.722)
Gained access to global markets 0.756
Developed networks of future value 0.793
Developed capabilities to help industry to access international markets
controlled for.
Second, the innovation strategy adopted by innovation inter-mediaries may also influence value creation (Kirkels and Duysters 2010). Whilst traditionally innovation intermediaries have been known for adopting‘technology push’approach, there has been an increasing trend towards adopting ‘market pull’approach (or a combination of
[image:8.595.40.558.81.314.2]both the approaches) each of which have different consequences on value creation (Lichtenthaler and Ernst, 2008). Indeed, research by Polzin et al. (2016, 41–42)has shown a key function now of innovation intermediaries is in reducing uncertainty about future market oppor-tunities for new technologies and in niche market development for them. Respondents stated the extent to which they adopt‘technology
Table 2
PCA on the use of knowledge-based practices: questionnaire items.
Statements Component
1 2 3 4 5
Knowledge capitalisation (Cronbach's Alpha = 0.794; CR = 0.856; AVE = 0.549)
1. Capitalise on the personal networks of staffwhen engaging in EU Framework programmes 0.889 −0.082 0.029 −0.018 −0.023
2. Have a dedicated team working on EU engagements 0.785 −0.008 −0.155 0.289 0.038
3. Make an effort to retain those employees with successful EU experience 0.725 0.334 0.142 0.036 0.056
4. In EU consortia, engage with partners with whom you have good relationships 0.691 0.105 0.171 −0.173 −0.115
5. Capitalise on relationships with local/national government 0.578 −0.060 0.125 0.469 0.259
Knowledge advancement (Cronbach's Alpha = 0.554; CR = 0.616; AVE = 0.802)
6. Engage in advancing core competences 0.249 0.843 −0.103 −0.095 −0.091
7. Recruit a portfolio of employees with different skills (e.g. basic research, applied research, management, etc.) as a strategy
to advance knowledge and skills
−0.136 0.760 0.308 0.205 0.253
Knowledge spanning (Cronbach's Alpha = 0672; CR = 0.614; AVE = 0.796)
8. Accessing university knowledge to achieve project outcomes 0.231 −0.111 0.868 0.203 0.022
9. Engage with partners from different disciplines to make use of their knowledge to achieve project outcomes −0.016 0.339 0.723 −0.081 −0.259
Innovation ecosystem knowledge access (Cronbach's Alpha = 0.591; CR = 0.5870; AVE=0.711)
10.Use cross EC networks such as ERRIN and other digital platforms tofind potential partners and to understand them better −0.134 −0.036 0.246 0.771 −0.032
11.Develop relationships with key business players and other potential partners in the market 0.283 0.150 −0.215 0.651 −0.252
Knowledge worker empowerment (Cronbach's Alpha = 0.549; CR = 0.553; AVE = 0.618)
12. Your organisation’s staffhas freedom of deciding their EU engagements (e.g. what to engage in, with whom to engage in,
how to engage in etc.)
−0.069 0.003 −0.218 −0.238 0.722
13.Provide freedom for your employees to work in your member organisations in the form of a placement 0.449 0.270 0.131 0.287 0.514
Extraction Method: Principal Component Analysis. Rotation Method: Varimax with Kaiser Normalization. Rotation converged in 9 iterations.
Table 3
PCA on the use of sources to influence ecosystem knowledge: questionnaire items.
Statements Component
1 2 3 4 5
Direct EU involvements and memberships (Cronbach's Alpha = 0.910; CR = 0.830; AVE = 0.699)
1. Meeting EU policy makers 0.750 0.086 0.413 0.102 0.261
2. European Technology Platforms and structures associated with Public Private Partnerships 0.621 0.160 0.385 0.174 0.327
3Participating in EARTO 0.603 −0.052 0.508 0.282 0.282
4. Participating in membership networks other than EARTO 0.512 0.121 0.604 0.111 0.354
5. Participating in EU investment plan development groups 0.784 0.232 0.160 0.176 0.025
6. Direct tenders from EC–Policy related 0.727 0.193 0.398 0.196 −0.021
7. Through trade associations 0.881 0.127 0.086 0.054 0.067
Written communication (Cronbach's Alpha = 0.883; CR = 0.859; AVE = 0.786)
8. Through joint publications −0.018 0.579 0.352 0.146 0.552
9. Through press releases 0.240 0.842 0.077 −0.025 0.328
10. Through newsletters 0.077 0.917 0.095 0.126 0.081
11. Social media (e.g. Twitter, Websites, Blogs, etc.) 0.257 0.805 0.056 0.139 0.211
Expert advisory groups (Cronbach's Alpha = 0.713; CR = 0.618; AVE = 0.805)
12. Participating in expert panels/workgroups 0.282 0.077 0.764 0.019 0.091
13. Participating in selecting/referee panels 0.279 0.148 0.845 0.033 −0.065
Through external bodies (Cronbach's Alpha = 0.801; CR = 0.712; AVE = 0.825)
14. Through your business and university network of contacts 0.233 0.126 0.030 0.772 0.148
15. Through connections with local or national governments 0.078 −0.052 −0.028 0.891 −0.073
16. Through EU liaison offices 0.129 0.216 0.183 0.812 0.081
Media events (Cronbach's Alpha = 0.761; CR = 0.620; AVE = 0.816)
17. Through conferences 0.070 0.320 0.212 0.132 0.796
18. Through industry fares 0.264 0.227 −0.102 −0.040 0.836
[image:8.595.39.574.461.717.2]push’ (develop a technology to a marketable product or service),
‘market pull’(project being induced by the market need) and a‘ com-bined approach’, when engaging in EU framework programmes using a 1–5 Likert Scale. Another indication of the heterogeneity of their in-novation profile is the technology readiness levels of projects, in which the higher levels of readiness indicate closer to the market orientation of the organisation (Mankins, 1995). In order to control for this, re-spondents were requested to state the highest Technology Readiness Level (TRLs)1they engaged in when undertaking EU FP7 programmes. The data revealed the presence of three groups: with those reaching up to TRL 4; those up to TRL 6; with the rest on TRL 7. None worked at TRL 8 or 9. A categorical variable with these three groups was then devel-oped to profile this. Third, the role of innovation intermediaries in collaborative projects could vary from acting as a networking agent and providing associated coordination services (Batterink et al., 2010) to undertaking basic research and delivering associated training (Kodama, 2008) and conducting‘closer’to market research and providing related technology technological services and resources (Tran et al., 2011). As innovation intermediaries may engage in a combination of these ac-tivities to a different degree, respondents were requested to rate each types of contributions to indicate the extent to which they provided these in EU FP7 consortia.
4.3. Estimation strategy
The effect of knowledge-based practices adopted by innovation in-termediaries on value generation was then analysed. Pearson correla-tion revealed a significant positive correlation between three dependent variable of non-financial value (for knowledge and marketing r = 0.510, n = 59,p= 0.000: knowledge and networking r = 0.604, n = 59, p= 0.000: marketing and networking r = 0.524, n = 59, p= 0.000). A Multivariate Analysis of Covariance (MANCOVA) was therefore performed that took into account interactions between de-pendent variables in a context of multiple dede-pendent and indede-pendent variables with bothfixed variables and covariates (Meyers et al., 2006). There was no theoretical evidence to suggest using different sets of explanatory variables for different dependent variables (i.e. non-fi -nancial value), which to justify the use of Seemingly Unrelated Re-gression (SUR) over MANCOVA model (Zellner, 1962). A separate univariate analysis was then run to investigate the influence of knowledge-based practices on the generation offinancial value. 4.4. Robustness checks
Variance Inflation Factors and correlation analysis revealed that there is no evidence of multi-colinearity. Also in relation to MANCOVA, Box's Test of Equality of Covariance Matrices was found not to be sig-nificant (Value = 76.968,p= 0.271 > 0.1), indicating the ability to pool variance-covariance matrices without any concerns and the normal distribution of the sample. Similarly, Levene's Test of Equality of Error Variances was also not significant (Knowledge F (11, 47) = 1.297, p= 0.256 > 0.05, Market F (11, 47) = 1.869, p= 0.069 > 0.05 and Network F (11, 47) = 1.969, p= 0.054 > 0.05), satisfying MANCOVA assumptions. The plot of residuals further confirms the satisfaction of homogeneity assumption (Knowledge p= 0.200 > 0.05, Market p= 0.091 > 0.05 and Network p= 0.200 > 0.05). Levene's Test of Equality of Error Variances was not significant for the Univariate analysis (i.e. to
investigate the effect of knowledge-based practices onfinancial value creation)F(11, 47) = 0.990,p= 0.469 > 0.05, indicating the suit-ability of the model. The plot of residuals further confirms the sa-tisfaction of homogeneity assumption (p= 0.051 > 0.05).
Measures were undertaken to check the problem of endogeneity that could occur when independent variables might not be endogenous (Shadish et al., 2002). Firstly, the sequential mixed method design helped improve both internal and construct validity. Second, as pre-sented in Section4.1, a non-response bias test revealed that there is no significant difference between respondent RTOs and the full empirical base of 122 RTOs. Third, satisfactorily meeting Cronbach's Alpha, CR, AVE, Kaiser-Meyer-Olkin Measure of Sampling Adequacy and factor loading criteria confirmed the reliability and validity of the chosen constructs, minimising measurement errors. Fourth, measures were taken to avoid reverse causality. Even though the impact of practices on internal value was investigated, it could be argued that reverse caus-ality is possible, where organisations decide to introduce practices if they are not generating enough internal value from their engagements. Nevertheless, initial interviews revealed that since EU framework pro-grammes are long-term, practices were unlikely to be changed over the short term. Thus, the extent to which RTOs adopted a given list of practices during the FP 7 programme was gauged with DV based on value generation over the last three years of the programme (2011-3), increasing the likelihood that the practices adopted cause the values rather than vice versa. This structure therefore provides a good time frame from which to evaluate the influence of specific practices. Fifth, measures were undertaken to address common method bias. Informa-tion was cross-validated from secondary informaInforma-tion derived on the turnover of each organisation (Y) by multiplying it with the survey data on the percentage of turnover derived from EU projects (Z) in order to reduce common method bias. Additional questions were asked that mixed up independent and dependent variable related questions so that the respondents were unable to know the antecedents and outcome variable. The highest correlation among the constructs was also statis-tically checked (seeAppendix A). The highest value was 0.640 (with a majority less than 0.3), which is low (Bagozzi et al., 1991). Common method variance, using Harman’s one-factor analysis (Podsakoffand Organ, 1986) showed that the 10 factors extracted with eigenvalues above 1.0 (74.98% of the total variance) were explained by thefirst factor, which accounted for only 23.47%. Sixth, since our model com-bines factor analysis and regression analysis, Structural Equation Modelling (SEM) was conducted for the univariate analysis to further check the model fit (Miles, 2003). The results on the influence of practices on internal value were similar, except for the significant ne-gative effect of two elements relating to innovation ecosystem influence that were not significant in the univariate analysis yet reported a ne-gative influence. This similarity enabled us to use the modelfit mea-sures of SEM to further support thefindings of the univariate analysis.2 Seventh, as many theoretically justified control variables as possible were included to avoid the omitting of a regressor (Rubin, 2008; Shadish et al., 2002), which is recommended despite the cost of reduced efficiency (i.e., higher standard errors; Cameron and Trivedi, 2005). The results of SEM discriminant validity (i.e. measurement model of a construct is free from redundant items) test found no items with high Modification Indices (MI), confirming that our control variables are not redundant (Jöreskog and Sörbom, 1984). This comprehensive approach of robustness checks confirm that the model does not suffer from en-dogeneity and that the model is robust.
1TRL 1–Concept proposed with scientific validation; TRL 2–Application and validity
of concept validated or demonstrated: TRL 3–Experimental proof of concept completed:
TRL 4–Production validated in lab environment: TRL 5–Basic capability demonstrated:
TRL 6 –Process optimised for production rate on production equipment: TRL 7–
Capability and rate confirmed: TRL 8–Full production process qualified for full range of
parts: TRL 9–Full production process qualified for full range of parts and full metrics
achieved.
2GIF = 1.00(> 0.95); AGFI = 0.989 (> 0.95) (Tabachnick and Fidell, 2007);
RMSEA = 0.000 (< 0.05),p= 0.892 (> 0.05) (Byrne, 1998); TLI = 1.548 ( > 0.95);
IFI = 1.001 ( > 0.95); CFI = 1.000 (> 0.95) (Tabachnick and Fidell, 2007); CMIN/
5. Results and discussion
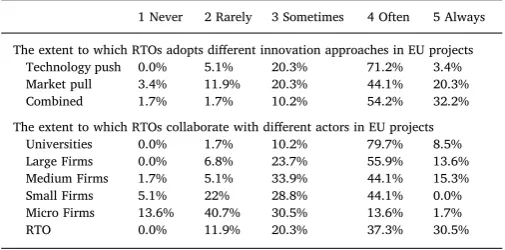
The role of RTOs in the projects ranged from engaging in basic re-search and associated training, acting as a networking agent, engaging in applied research to technology service provision, with a majority mentioning a greater involvement in latter two (Table 4). A majority of RTOs (86.4%) also reported adopting a combination of both ‘ tech-nology push’ (i.e. develop a technology to a marketable product or service) and‘market pull’(project being induced by the market need) approaches (Table 5), although‘market pull’activities came a strong second above that of‘technology push’factors (seePolzin et al., 2016). Of the RTOs, a third (33.9%) had engaged in projects up to TRL4, 28.8 percent up to TRL 6 and 37.3 percent up to TRL 7, representing dif-ferent levels of market readiness levels of project outcomes. The in-novation intermediaries were more likely to collaborate with uni-versities, large and medium-sized firms and other RTOs, rather than small or microfirms (Table 5).
Moving on to focus on internal value generation by intermediaries from client interaction, the descriptive statistics also indicated that in addition to financial value generation, innovation intermediaries also generated knowledge (M–3.83; SD–0.58), market (M–4.01; SD–0.65), and network (M– 3.85; SD– 0.59)3 based value (Table 4). The in-dependent variables constructed using factor scoring indicates that the respondents to a varying degree adopted the six types of knowledge-based practices, further supporting the need to investigate the influence
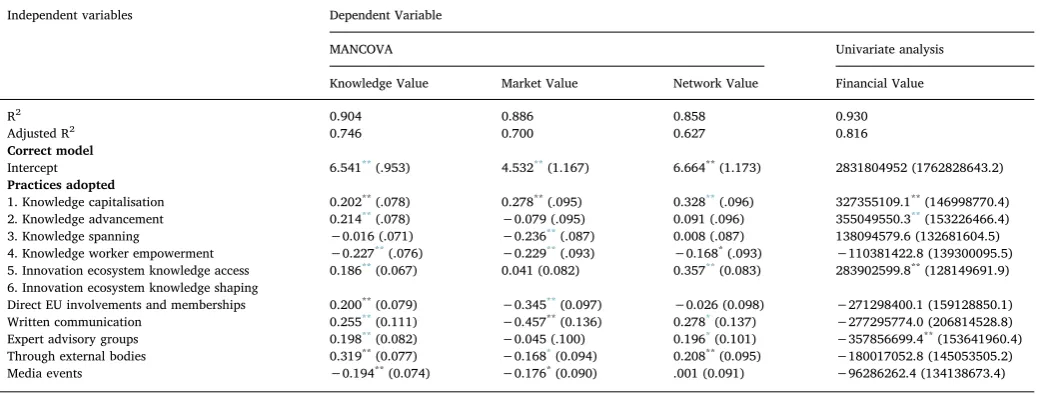
of the adoption of these practices on value creation. A univariate ana-lysis for financial value and MANCOVA for knowledge, market and network value creation was conducted (Table 6).
The results revealed that different practices influence the generation of different types of value. The only exception here was for practices adopted for knowledge capitalisation, which significantly positively influenced all four types of value creation (Practice 1,Table 6), sup-porting H1. Since innovation intermediaries extensively interact with several external parties, capitalising on existing trustworthy relation-ships, minimise the risk of failure and increase their ability to generate new knowledge by combining existing knowledge bases. Innovation intermediary employees engaged in EU projects seem to develop in-valuable experience which is tacit and difficult to transfer and RTOs made special efforts to retain them. Indeed, of the six knowledge-based practices, only knowledge capitalisation was found to have a significant positive influence on market value creation. This highlights the need for capitalising proven and established knowledge bases inside innovation intermediaries and/or strong networks to produce marketable products and services.
In relation to the H2, it is evident that practices adopted for knowledge advancement have a significant positive influence only on knowledge andfinancial value creation (Practice 2,Table 6). In-depth interviews validated this result suggesting that while knowledge ad-vancement improves RTOs’ability to secure funding, and thereforefi -nancial value, there is a lag period for newly recruited staffto generate market or network value. This means that only when new knowledge is appropriately integrated into the existing knowledge base is market and network value generated, which is captured in the H1 as a form of capitalising on existing knowledge.
[image:10.595.40.565.93.243.2]Interestingly, practices associated with the knowledge-spanning role had no significant positive influence on any type of value, except for the significant negative influence on market value (Practice 3,Table 6), rejecting H3. In-depth interviews revealed that RTOs mainly ‘access’ unrelated knowledge that is non-adjacent to their knowledge base, which they do not intend to acquire and internalise, but use only to achieve project outcomes. Hence, these interactions may not generate additional value other than achieving direct project outcomes. How-ever, it may also be a lag effect in that there are considerable‘start-up’ costs to create sunk capital in acquiring new knowledge which generate negative impacts over the short term, but may lead to longer-term value generation. RTOs have also highlighted the difficulties they face when interacting with collaborators from different disciplines, whose knowledge is not familiar to RTOs, and thus, unless these players could be of future value, interaction would be limited to achieving specific project outcomes, which may explain the results of the regression analysis. On this basis, therefore, if RTOs perceive that these players
Table 4
Descriptive statistics I
Descriptive Statistics
Minimum Maximum Mean Std. Deviation
Dependent variables
Knowledge based value 1.75 4.75 3.83 0.58
Market based value 2.40 5.00 4.01 0.65
Network based value 2.67 5.00 3.85 0.59
Financial value 0.00 5600000000.00 795820359.32 1276972477.44
Characteristics of RTOs
Age of RTO 3.00 100.00 42.49 27.93
Number of employees in EU engagement 1.00 800.00 92.75 167.74
Turnover of RTO 400000.00 700000000.00 87896785.63 141815294.21
Nature of contribution by RTOs for EU activities
Applied research and technology service provision 1.00 4.75 3.36 0.69
Act as a networking agent 2.50 5.00 3.62 0.66
Engage in basic research and training 1.00 4.50 2.86 0.61
Table 5
Descriptive statistics II.
% of respondents responding to each value on the Likert scale–the higher the score the
greater the involvement
1 Never 2 Rarely 3 Sometimes 4 Often 5 Always
The extent to which RTOs adopts different innovation approaches in EU projects
Technology push 0.0% 5.1% 20.3% 71.2% 3.4%
Market pull 3.4% 11.9% 20.3% 44.1% 20.3%
Combined 1.7% 1.7% 10.2% 54.2% 32.2%
The extent to which RTOs collaborate with different actors in EU projects
Universities 0.0% 1.7% 10.2% 79.7% 8.5%
Large Firms 0.0% 6.8% 23.7% 55.9% 13.6%
Medium Firms 1.7% 5.1% 33.9% 44.1% 15.3%
Small Firms 5.1% 22% 28.8% 44.1% 0.0%
Micro Firms 13.6% 40.7% 30.5% 13.6% 1.7%
RTO 0.0% 11.9% 20.3% 37.3% 30.5%
3The value range from 0 to 5 and the higher the mean, the greater the non-financial
[image:10.595.37.290.305.430.2]from other disciplines would be of future value, they make an effort to strengthen the relationship, the use of the knowledge of whom then becomes capitalising on knowledge vested in close collaborators, cap-tured in the H1.
Practices adopted to empower employees, such as giving freedom for staffto decide what EU projects to work on, with whom and what practices should be involved in such engagements, had significant ne-gative influence on all the non-financial value creation and non-sig-nificant, but still negative, influence on financial value creation (Practice 4, Table 6), supporting H4. Interviews revealed that since innovation intermediaries are by their nature outward-looking, having some control over employee engagement is essential. Therefore, there appears to be a dynamic balance between employee empowerment and centralised control by RTOs that enable them to generate value. This is further justified as RTOs engage in EU projects not only as a source of income but also as a source of long-term value creation in knowledge, network and market capability development.
Practices adopted to access innovation ecosystem knowledge (H5) significantly positively influence all the types of value creation apart from market-based value (Practice 5,Table 6). This was mainly asso-ciated with the role of RTOs as network builders, in which knowledge of the ecosystem actors enable RTOs to bring together key players for EU projects. This increases the chances of being successful both in terms of securing funding as well as delivering output. Having the opportunity to work with these players enable RTOs to develop new knowledge and network of future value. Not having a positive influence on market value creation might be because of other compatibilities or precondi-tions needed to be fulfilled (as discussed in relation to H1) to generate marketable products and services.
Innovation-ecosystem knowledge shaping (H6), interestingly, had a significant positive influence on knowledge and network value creation, but not on market orfinancial value creation (Practice 6,Table 6). All the sources used to influence innovation ecosystem knowledge, except for media events, positively influenced knowledge value creation. Written communication, expert advisory groups and influence made through external bodies have a positive impact on network value
generation. Influencing innovation system‘architecture’(Tjong et al., 2015), including EU project calls, enabled RTOs to improve the chances of developing knowledge of value during projects. Such influences have also been made in collaboration with other types of innovation inter-mediaries and like-minded organisations, which in turn become project collaborators leading to strengthening the network of future value. However, any source used to influence innovation ecosystem knowl-edge does not seem to positively influencefinancial or market based value creation.
6. Conclusions
6.1. Keyfindings and implications
There has been a growing body of knowledge and research sur-rounding the role and impact that innovation intermediaries haveon their client organisations, but little is known about the internal value creation of innovation intermediariesfromtheir interaction with their clients. This is a non-trivial issue because if innovation intermediaries do have an important impact on innovation system and network
‘health’ and on the specific performance and growth of client en-terprises and organisations, it is important to understand what helps to sustain and develop their own long-term growth and development. As Knockaert and Spithoven (2014, 1400)have suggested in their analysis of innovation intermediaries and the role of absorptive capacity one needs to understand the capacities of both clientfirms and technology intermediaries to understand the whole value generation process.
[image:11.595.40.564.81.278.2]Our results show that it is the knowledge attributes and routines of intermediaries’ staff and their attitudes (Gavetti, 2005; see also Tortoriello et al., 2012, 2014) as well as the support given to them in terms of knowledge capitalisation (butnotpractices allowing staffmore empowerment) that have the most significant impact on value creation within innovation intermediaries. Thisfinding is perhaps not surprising given that ultimately knowledge is held at an individual level. How an innovation intermediary harnesses local personal knowledge and per-sonal knowledge networks (Huber, 2012) is therefore essential for its
Table 6
MANCOVA and univariate analysis.
Independent variables Dependent Variable
MANCOVA Univariate analysis
Knowledge Value Market Value Network Value Financial Value
R2 0.904 0.886 0.858 0.930
Adjusted R2 0.746 0.700 0.627 0.816
Correct model
Intercept 6.541**(.953) 4.532**(1.167) 6.664**(1.173) 2831804952 (1762828643.2)
Practices adopted
1. Knowledge capitalisation 0.202**(.078) 0.278**(.095) 0.328**(.096) 327355109.1**(146998770.4)
2. Knowledge advancement 0.214**(.078) −0.079 (.095) 0.091 (.096) 355049550.3**(153226466.4)
3. Knowledge spanning −0.016 (.071) −0.236**(.087) 0.008 (.087) 138094579.6 (132681604.5)
4. Knowledge worker empowerment −0.227**(.076) −0.229**(.093) −0.168*(.093) −110381422.8 (139300095.5)
5. Innovation ecosystem knowledge access 0.186**(0.067) 0.041 (0.082) 0.357**(0.083) 283902599.8**(128149691.9)
6. Innovation ecosystem knowledge shaping
Direct EU involvements and memberships 0.200**(0.079) −0.345**(0.097) −0.026 (0.098) −271298400.1 (159128850.1)
Written communication 0.255**(0.111) −0.457**(0.136) 0.278*(0.137) −277295774.0 (206814528.8)
Expert advisory groups 0.198**(0.082) −0.045 (.100) 0.196*(0.101) −357856699.4**(153641960.4)
Through external bodies 0.319**(0.077) −0.168*(0.094) 0.208**(0.095) −180017052.8 (145053505.2)
Media events −0.194**(0.074) −0.176*(0.090) .001 (0.091) −96286262.4 (134138673.4)
Results after controlling for the characteristics of RTO, and other activities defining their role in EU projects such as the nature of contribution by RTOs, innovation approaches adopted by
RTOs, the extent of engagement with different types of actors, sector of operation of RTOs and the extent of commercialisation engagement by RTOs (seeAppendix Bfor full model
including control variables). **p <0.05.
long term growth and development. This is also true in terms of the impact of intermediaries on their client enterprises and organisations where the underlying absorptive capacity of both sets of organisations also inherently lies. This is why perhaps knowledge advancement is more limited in its impact, centred onfinancial and knowledge value creation, as the absorption and internalisation of new knowledge and knowledge practices take time. Knowledge spanning activities appear to be of little (or indeed negative in the case of market value) importance in terms of value generation to intermediaries. This indicates that it is the spanning of market knowledge with their existing technical com-petence that is important for the intermediaries themselves. Technical knowledge is therefore a condition for their other activities but not an immediate driver for innovation intermediaries.
By contrast, the benefit that innovation intermediaries generate as network integrators and shapers in terms of the architecture of the knowledge and innovation system is one of the most striking results. This is reflected in other studies of intermediaries that are emerging with, for example, the study Tjong et al. (2015) on the role of in-novation intermediaries on the development of bicycle technology within the Netherlands and how they helped change the institutional architecture of the national sectoral system. The role of innovation intermediaries as network builders, bridgers (Caloffiet al., 2015) and innovation system architects (Klerkx and Leeuwis, 2008b), with no apparent impact on theirfinancial bottom line, but one which enhances their long term capabilities and attraction, is their most significant policy impact. This, together with their direct impact on enhancing the performance of their client enterprises and organisations, is where in-novation intermediaries continue to build their presence within the innovation system of nations, regions and sectors.
6.2. Limitations and further research
The study has had to confront a number of issues, which must be acknowledged when reviewing the research, of which two are most significant here. Thefirst set revolve around lag effects and this can be seen on a number of levels. As noted above (Section 5.1) a number of
effects, such as the RTOs knowledge-spanning role are not observed in the data because the time period being considered is too short. In ad-dition, the different value types and their impact on RTOs are also af-fected by time and periodicity. Thus, as has been seen, shorter term
financial value ‘first order’ effects are more prominent but taking a longer term view ‘second order’ effects associated with knowledge, markets and networks could become much more significant. The second set of issues is how the generation of internal value and its variable
‘geometry’influences the future behaviour and routines of RTOs as a subset of innovation intermediaries. There will be positive and negative feedback loops on RTO behaviours and practices which are not ex-plored here, again in part because of temporal issues. Both these lim-itations indicate the need for research in this topic. Qualitative data from the RTO survey is available and this may point to further rounds of data collection, especially on a longitudinal basis. More fundamentally, the research points to a lack of the interaction between value genera-tion for both the clients of intermediariesandintermediaries themselves and how this shapes the trajectory of the market or the sector and the
‘loosely coupled’feedback loops between the two groups. This is im-portant in policy terms if we are to understand how innovation inter-mediaries may be used to leverage benefits for the wider national or regional innovation systems as well as just for their clients.
Acknowledgement
Authors would like to acknowledge the financial assistance pro-vided by the InnovateUK for this study. We would like to thank the editor, Prof Ben Martin, and three anonymous reviewers for immensely valuable feedback and advice in the preparation of this article. Our gratitude also goes to the Big Innovation Centre for supporting data collection.
Appendix A. Correlation matrices between each IV and DV. Annual turnover tor_Number_C Sta ff _Size_EU Age TRL_Combinations_C. Tech_Push Market_Pull Combined_Inno Partners_Universities
Partners_Large firms
Annual turnover 1 Sector_Number_C 0.301 1 Sta ff _Size_EU 0.640 0.289 1 Age 0.432 0.285 0.327 1 TRL_Combinations_C 0.001 0.260 0.240 0.420 1 Tech_Push 0.147 0.175 0.169 0.236 0.317 1 Market_Pull − 0.022 0.223 0.049 0.298 0.402 0.286 1 Combined_Inno 0.164 0.310 0.229 0.250 0.400 0.289 0.553 1 Partners_Universities − 0.134 0.059 0.047 − 0.069 − 0.076 0.066 − 0.033 − 0.111 1 Partners_Large fi rms 0.076 0.179 0.051 0.386 0.432 0.555 0.369 0.416 0.013 1 Partners_Medium fi rms 0.016 0.150 0.138 0.425 0.533 0.280 0.291 0.368 0.118 0.678 Partners_Small fi rms − 0.111 − 0.019 − 0.162 0.339 0.365 0.027 0.255 0.234 − 0.024 0.304 Partners_Micro fi rms − 0.063 − 0.121 − 0.020 0.186 0.234 0.085 − 0.003 − 0.089 0.017 0.114 Partners_RTO 0.166 0.288 0.097 0.492 0.415 0.195 0.288 0.198 0.124 0.520 Contri_ Ap. Research 0.185 − 0.093 0.154 0.398 0.187 0.113 0.204 0.005 0.303 0.213 Contribution_networking 0.050 0.101 0.107 0.262 0.436 0.052 0.398 0.286 − 0.144 0.369 Contri_Basic research − 0.173 − 0.125 − 0.004 − 0.194 − 0.083 − 0.182 − 0.152 − 0.231 0.114 − 0.103 EU_involvements 0.289 0.214 0.177 0.382 0.297 0.102 0.071 0.075 − 0.141 0.366 Written com 0.058 − 0.067 0.090 0.335 0.263 0.124 0.392 0.269 − 0.247 0.363 Expert_advisory − 0.197 0.160 − 0.112 − 0.058 0.251 0.325 0.161 0.350 − 0.137 0.502 External bodies 0.233 0.036 0.259 0.068 0.003 − 0.128 − 0.211 0.083 0.024 0.058 In fl uence Media − events 0.157 0.045 0.265 − 0.035 0.043 0.047 − 0.031 − 0.030 0.044 − 0.012 Know_Capitalisation 0.090 0.198 0.166 0.328 0.390 0.207 0.323 0.473 0.044 0.485 Know_Advancement 0.164 0.118 0.035 0.132 0.123 0.199 0.302 0.360 0.069 0.164 Tech_Know_Access − 0.119 0.008 − 0.014 − 0.222 − 0.045 − 0.394 0.054 − 0.025 0.115 − 0.387 Eco_Know_Access 0.180 0.132 0.100 0.056 0.066 0.311 0.010 0.084 − 0.096 − 0.055 Know_Comm_Dev − 0.028 0.085 0.068 − 0.150 0.015 − 0.096 − 0.144 0.130 − 0.035 − 0.127 Know_Value 0.031 0.138 0.205 0.331 0.494 0.096 0.393 0.510 − 0.045 0.244 Market_Value 0.030 0.178 0.034 0.341 0.515 0.316 0.464 0.488 − 0.062 0.543 Network_Value 0.007 0.234 0.094 0.174 0.458 0.319 0.301 0.447 − 0.045 0.364 Financila_Value N/A 0.176 0.566 0.402 0.051 0.156 0.099 0.263 − 0.157 0.151
Partners_Medium firms Partners_Small firms Partners_Micro firms
Partners_RTO Contri_ Ap. Research Contribution_ networking Contri_Basic research EU_involvements Written com Expert_ advisory External bodies Annual turnover Sector_Number_C Sta ff _Size_EU