2017 2nd International Conference on Computer, Mechatronics and Electronic Engineering (CMEE 2017) ISBN: 978-1-60595-532-2
Feature Enhancement of Noisy Image by Dyadic Wavelet Analysis
Zheng-hong HUANG
1,2and Li XIA
31
Chongqing Engineering Laboratory for Detection, Control and Integrated System
2
School of Computer Science and Technology, Chongqing Technology and Business University
3
School of mathematics and statistics, Chongqing Technology and Business University, 19 Xuefu Avenue in Nan’an, Chongqing, 400067, China
*Corresponding author
Keywords: Dyadic wavelet transform, Multiresolution representations, Threshold function, Image enhancement.
Abstract. The image de-noising method is proposed by multiresolution representations of the dyadic wavelet transformation. Firstly, the original image are decomposed using dyadic wavelet transformation, then the image can be de-noised by way of adopting different thresholds according to the different scales of wavelet coefficients, and finally nonlinear enhancing function are applied for wavelet coefficients with the enhancement method in the corresponding scales. Experiments of the medical images show that compared to the image enhancement method, our approach improves the information entropy and contrast improvement index of the images, enhances edge texture of images.
Introduction
During image capturing and transporting process, there are some noises which can affect not only the quality of image but also the image analyzing, understanding and application. To understand the image information effectively, the key point is to retain the image information while removing noises, and improve the information entropy and contrast.
Currently, most of de-noise approaches are based on spatial domain and frequent domain. However, the pixels in noise and edge are located the position where grayscale value varies fast and corresponds to the high frequency information. These approaches reduce the noise at cost of blurring the detail of information such as edge and texture [1]. Due to the shortcomings of the threshold function [2], so that constant deviation is produced between the wavelet coefficients and the wavelet coefficients of the signal to be processed. Although [3] has been improved, but too many thresholds are estimated in threshold function, it is more difficult to achieve. At the same time, Mallat proposed the sampling method to suppress the translation invariant of the wavelet transform, which leads to the small transfer of the digital signal in the time domain (or frequency domain), which results in the Pseudo-Gibbs phenomenon. Polesel and Zhang apply unsharp masking methods to noise-free images, which can better contrast enhancement in the spatial domain [4, 5]. But based on the image enhancement algorithm for multiresolution transformation, both the image details and the image of the noise are enhanced.
Multiresolution Representations of the Dyadic Wavelet Transform Analysis from two-dimensional signal, tensor space
{
}
Z j j j j V V
V2: ⊗ ∈ makes up the
multi-resolution analysis of L2(R2) , setting ψ
( )
xas one-dimensional scaling function, ϕ(x)the corresponding dyadic wavelet, thus an orthonormal basis of 2( 2)R
L is defined ) ( ) ( ) ,
(x y ψ x ψ y
ψ = 2
) ,
(x y ∈ R
three two-dimensional dyadic wavelet are available
) ( ) ( ) , ( ) 1 ( x x y
x ψ ϕ
ϕ = ) ( ) ( ) , ( ) 2 ( x y y
x ψ ϕ
ϕ = ) ( ) ( ) , ( ) 3 ( y x y
x ϕ ϕ
ϕ =
Two-dimensional dyadic wavelet can be expressed as
3 , 2 , 1 , 0 , , , ), 2 , 2 ( 2 1 ) , ( () ) ( , ,
2 ∈ ≥ =
− −
= x n y m j nm Z j i
y
x i j j
j i n m j ϕ ϕ
According to dimensional multiresolution analysis, low-frequent separation of two-dimensional image signal aj(x,y)under the scale j
2 can be showed as the two-dimensional sequence dxdy m y n x y x f y x y x f m n
a j j
R j n
m
j j )
2 , 2 ( ) , ( 2 1 )) , ( ), , ( ( ] , [ 2 , , 2 − − =
= ψ
∫∫
ψThe high frequent components are showed respectively as
dxdy m y n x y x f y x y x f m n
c j j
R j n
m
j j )
2 , 2 ( ) , ( 2 1 )) , ( ), , ( ( ] ,
[ (1)
, , 2 1 1 2 − − =
= ϕ ∫∫ ϕ
)) , ( ), , ( ( ] ,
[ 22 , ,
2 y x y x f m n
cj = ϕ j m n
)) , ( ), , ( ( ] ,
[ 32 , ,
3 y x y x f m n
cj = ϕ j mn
from àtrous algorithm
∑
+ = = + k j jj n h k a n k j J
a 1[ ] [ ] [ 2 ] 0,1,2....
∑
+ = = + k j jj n g k a n k j J
c 1[ ] [ ] [ 2 ] 0,1,2....
∫
+∞
∞ −
− = f t t n dt n
a0[ ] ( )ϕ( )
where h is the low-pass filter corresponding to the scaling function ψ(x), gis the the high-pass filter corresponding to dyadic wavelet function ϕ(x).
The image signal is decomposed into a low frequent component and three high frequent components, aj is the low-frequent component of scale 2 , j c1j,c2j, c3j are the vertical,
horizontal, diagonal high frequent components of scale 2 respectively, low frequent j component aj can still be decomposed according to above way. The original signal aj[n]
) ... 2 , 1 , 0
(j= J can be reconstructed by the dyadic wavelet signals aj+1[n] and dj+1[n]in the
decomposition equation and showed as:
{
∑
− +∑
−}
= + + k k j j j jj n h k a n k g k C n k
a ~[ ] [ 2 ] ~[ ] [ 2 ]
2 1 ]
[ 1 1 j=1,2...J
From dyadic wavelet filter
0
]
[
,
1
]
[
=
∑
=
∑
k kk
g
k
h
and fast àtrous algorithm, the fast decomposition of separable dyadic wavelet is realized, the concrete steps are as follows:
(2)Wavelet decomposition on each layer decompose image in to four equal size subband images, whose numbers of dyadic wavelet coefficients decomposing on different scales are equal to the numbers of pixels of the original image.
(3) In this way, approaching signals and continuing decomposition by analogy.
Threshold and Threshold Function
The main information of noise image by dyadic wavelet transformation is distributed in the low frequent region, the noise and image details are mainly distributed in the high frequent region, most image information is also distributed in a small number of wavelet coefficients, whose noise has the same amplitude. According to different scales, different threshold values can be chosen for wavelet coefficients denoising.
In order to reflect the feature that the standard deviation of noise in different decomposition scale varies with scale increasing in wavelet multi-scale analysis, assume the different lever threshold of dyadic wavelet are:
) 1 2 ln( / ln
2 + 1−
= i−
i σ N e
δ
where
σ
is the standard deviation of noise and N is the image pixels. When scale i = 1 , it becomes the original formulation. Wheni
>
1
, the thresholdδ
decrease with the scale increase, and the noise amplitude decrease with the scale increase. Moreover, adapt the decomposition noise in different scale and the lower bound of threshold denoising to propose the improved lever threshold function.To the noisy mixed signal, de-noise the measured signal fist, that is, choose a threshold for the noisy signal wavelet and then process the threshold to the wavelet transformed scale discrete detail to signal denoise.
< ≥ −
−
=
j k j
j k j
j j k j
j k
j k j
k j
δ ω
δ ω
δ δ ω
δ ω
ω
ω
, , ,
, ,
,
0
}
exp ){
sgn(
ˆ
.
where ωj,kis the wavelet coefficient, ωˆj,k is the estimated wavelet coefficient and δ j is the
threshold concerned scale. When ωj,k >δj, the difference between
ω
ˆj,k andω
j,k is small andthe reconstructed signal is approximate real signal better on scale j . The mathematic model of noisy image on scale i is,
i i
i
x
n
y
=
+
δ
i
=
1
,
2
⋅
⋅
⋅
⋅
⋅
⋅
N
where yi is the noisy image, xi is the denoising signal, ni is the independent identically normal distribution random noise, N is the number of pre-pixels[6].
By adapting different thresholds under various conditions of scale, so that the threshold function can automatically adjusted. To improve the denoising accuracy of new threshold function, the denoising error lower bound of the new threshold.
Nonlinear Enhancement Function of the Dyadic Wavelet Set the basic wavelet function ϕ(x)∈L2(R) to meet
∞
<
∫
ω
ω
ω
ϕ
d
R
2
)
(
ˆ
) ( 1 ) ( , a b x a t b a − =
ϕ
ϕ
signal function () 2( )
R L t
f ∈ , whose wavelet transform function is expressed as
) , ( ) ( 1 ) ( ) ( ) , )(
( a dt f a,b
a b x a t f b f W b a
Wf = =
∫
ϕ∗ − = ϕ(1) where a is the scale parameter, bis the displacement parameters.
Discretion the scale parameter, letting a=2−j , Equation (1) can be written as
dt t x a t f x x f x f
Wj j R j( )
1 ) ( ) ( ) ( )
( 2 2
2 = ∗ϕ =
∫
ϕ −(2) then dyadic wavelet transform of f(x) can be expressed as
) ( ) ( ) ( ) ( ) ( )
(x W2 f x 2 x f x 2 x 2 x
f j j j j j j
∑
∞∑
−∞ = ∞ −∞ = ∗ ∗ = ∗= χ ϕ χ
(3) where wavelet ϕ(x)andχ(x)satisfy the condition.
Letting
1
)
(
ˆ
)
(
ˆ
22
∗
=
∑
ϕ
jx
χ
jx
where
ϕ
ˆ(ω
) andχ
ˆ(ω
)are the transforms of Fourier respectively. Setting scale function φ(x), whose Fourier is transformed as∑
∞ = = 1 2 ) 2 ( ˆ ) 2 ( ˆ ) ( ˆ j j jx ϕ ω χ ω
φ
Meeting the telescopic equation
) 2 ( ˆ ) 2 ( ) (
ˆ ω φ ω
φ x = H
(4) where H(ω) is the Fourier transform of discrete filters.
Letting ) 2 ( ˆ ) 2 ( ) (
ˆ ω ω φ ω
ψ = G
) 2 ( ˆ ) 2 ( )
(ω ω φ ω
χ = K
(5) where G(ω) and K(ω) are discrete filters.
To achieve the purpose of enhancement, letting ψˆ(x)=−ωθˆ(ω), in the frequent domain where θ(ω) repents low-pass filter, there is
, 0 ) ( ˆω ≠
θ limˆ( )=0 ∞
→ θω
ω
According (5), the following discrete filters can be constructed
n H 2 ] 2 [cos )
(ω = ω
2 )] 2 [sin( )
(ω = ω
G l n k G H
K 2 1 2
0 2 )] 2 [cos( 4 1 ) ( ) ( 1 ) (
∑
− = − = − = ω ω ω ω (6) From (3)-(6), it is availablen 2 ] 2 / ) 2 / sin( [ ) (
ˆ ω ω ω
φ =
)] ( ) ( [ 2
)
( 2 2
2
2 f x x
dx d x
f
W k k
k
θ
∗ =
By the method of nonlinear enhancement, the direct enhancing function ~f(x) is available through enhancing the channel p in the time domain.
∑
+∞−∞ =
∗ =
k
x x f W E x
fˆ( ) [ k ( )] k( )
2
2 χ ( ) [2 ( ( ) ( )] 2 2[ ( ) 2 ( )] 2 ( ) 2
2 2
2
x x
x f dx
d x x f dx
d E x
f k p p
p
p θ θ χ
∗
∗ −
∗ +
=
) ( ~
x
f is simplified as
] 2
) 2
( [ ) ( ) ( ˆ
2 2
2 2
dx f d dx
f d E x f x
f = − p − p
Image Enhancement
As describe as above, based on the nonlinear operator, our approach can not only retain texture and detail of image but also reduce the noise of image [7].
(1) Compute the 2-D WTf(m,n) of noise image f(m,n) and decompose N×Nimages into four so that the energy concentrates on few coefficients.
(2) Choose suitable wavelet and then perform a wavelet transformation with decomposition level j. We get the wavelet coefficients. The denoised image fT(m,n) is obtained based on threshold and the wavelet coefficients Cf are obtained. The enhanced image 1( , )
n m
f− is
computed by inverse Discrete Wavelet Transform (IDWT) of Cf.
(3) Based on nonlinear enhancement process for the high frequency sub-image, the obtained wavelet coefficients can reconstruct the image to enhance the detail of image. By the method describe above, output image fˆ(m,n) is obtained.
Experimental Results and Analysis
We analysis the performance of image enhancement based on brain MRI image [8]. The MRI image obeys Rician distribution, whose noise is the Rician noise of non-zero mean value, whose average normally associated with partial strength of image, which is regarded as obeying to Gaussian distribution in the process of MRI image. As shown in original image, the contrast is low and the edge of tissues is vague. In our experiment, the information entropy and contrast are employed to estimate the performance of the proposed method. The entropy is often used as a characterization of the information content of a data source and defined as follows
∑
= − =255
1
2( )
log k
i
k p
p E
Where pi is the probability of the grayscale i, the contrast is treated as the clarity. If the contrast is lager, the image is sharpness.
The parameter CH (describe in reference) is to evaluate contrast of image
Original ocessed C
C
CH = Pr / . For a given image, we divide it into 3×3 patch and C is the average
contrast of all patches. The contrast of each patch is defined as min) /(max min) max
( − +
=
C
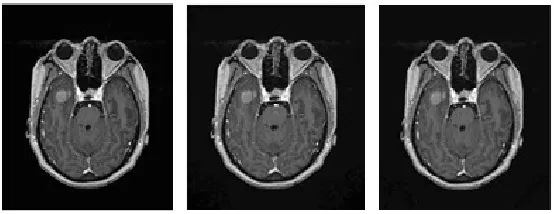
(a) Original image (b) Unsharp masking (c) The paper method of brain cancer enhancement Figure 1. Comparing the performance of various methods on brain MRI image.
[image:6.612.155.432.69.176.2]In experiment, we select a brain MRI image with size of 256 × 256. Figure 1(a) shows the original image. From which, we can be seen that it contain more noise; Figure 1(b) shows the enhancing image by unsharp masking method, Figure 1(c) shows the enhancing image based on the proposed approach.
Table 1. The comparison of enhancement performance Category Original
image
Unsharp masking method
The paper method
Information entropy 2.4842 2.5968 3.3931
Contrast improvement
index 1.1428 4.6304 6.7139
As the distribution of image high frequency component varies with the decomposed bands of dyadic wavelet. From Table 1, the dyadic wavelet based nonlinear enhancing approach can capture more detail of image. By àtrous method and dyadic wavelet transform, the image is decomposed into four subbands with different scale and the main energy concentrates few wavelet coefficients. Table 1 shows the contrast values and CH for the brain MRI image
features in the Figure 1. Nonlinear enhancement of dyadic wavelet coefficient performed significantly better than unsharp masking.
The information entropy is used to evaluate quality of image. For a grayscale image, if the entropy of its enhancing image is large, it implies there are more details in the enhancing image and its information capacity is large. Figure 1(c), we can see that the image is effectively enhanced and contains more distinguishing texture.
The experimental results show the entropy and contrast of enhancement image are improved significantly and the proposed approach boosts the feature information of image edge.
Conclusion
In this paper, the nonlinear enhancement of dyadic wavelet multiscale analysis is employed for MRI denoising, image enhancement and image edge processing. The proposed approach not only enhances the local detail but also suppresses the noise. In addition, by reducing noise in different bands, our method can enhance edge features of lesion and improve the accuracy of diagnosis.
Acknowledgements
This work was supported by the Nature Science Foundation of CEL (No.DCIS20150301). We thank all teachers in our lab for helpful discussion.
[2] Donoho DL. De-noising by soft thresholding, J.IEEE Tmnsactions on Information Theory. 41 (1995) 613-627.
[3] Bruce AG, Gao HY, Waveshrink with firn shrinkage, J. Statistica Sinica. 7, (1997) 855-74.
[4] Polesel A, Ramponi G, Mathews V J. Image enhancement via adaptive unsharp masking, J. IEEE Transactions on Image Processing. 9 (2000), 505-510.
[5] Zhang Ling, Huang Fen-ping, Zheng En-rang. Image enhancement based on rough sets and wavelet unsharp masking, J. Acta Photonica Sinica. 37 (2008) 1285-1288.
[6] Zhenghong Huang, B.Fang,etc. Image denoising bansed on the Dyadic wavelet transform and improved threshold, J. Wavelets, multiresolution and information processing. 7 (2009) 269-280.
[7] T. Abukirim, S. Yakano and K Niijima. Fast face detection by lifting dyadic wavelet filters, Procedings of the IEEE International Conference on Image Processing, (2003), 893-896.