DETECTING THE COMPOSITE OF PHOTOGRAPHIC IMAGE
AND COMPUTER GENERATED IMAGE COMBINING WITH
COLOR, TEXTURE AND SHAPE FEATURE
1YONGZHEN KE, 2WEIDONG MIN, 3XIUPING DU(*), 4ZHENWEI CHEN
1,2,4
School of Computer Science and Software Engineering, Tianjin Polytechnic University, China
3
School of Internet Education, Tianjin University, China
E-mail: 1
[email protected]
, 2[email protected]
,
3[email protected]
ABSTRACT
With the development of computer graphic techniques and smaller visual difference between photographic images (PG) and computer graphics (CG), splicing of computer graphics and photographic is becoming more common, which causes the need for automatically distinguishing computer generated images from real photographs. Based on several visual features that derived from color, texture and shape feature, using posterior probability support vector machine (PPSVM), this paper presents a method for classification of photographic image and computer generated images, and detection of local forgery composite of them. These features are obtained from 800 computer generated images and 800 photographs, and used to train and test the image samples with the PPSVM. The PPSVM can calculate the probability of image belonging to photographic images or computer generated images. We can achieve the result of classification by setting a threshold of probability. The classification accuracies for color, texture and shape features are 76.75%, 85.25% and 69% respectively. The accuracy is improved to 89.375% with combined color, texture and shape features. The proposed classification method is used to detect the local forgeries composite of the CG elements in photographic, and vice visa. Experimental results show that the proposed method is efficient with good detection rate of local forgeries composite of the PG and the CG. It also possess low dimensional features and low time complexity.
Keywords: Photographic Image, Computer Generated Image, Composite, Color, Texture, Sharp Feature, Posterior Probability Support Vector Machine
1. INTRODUCTION
Advances in computer graphics have made it easier to generate photorealistic images, which look very fantastic and beautiful, just like the life in the movie Avatar which is hard to arrange in real world. The composite technology of photographic and computer graphic brings us wonderful visual enjoyment, and may also be used to forge image for cheating others. If the faked images are abused, it may potentially lead to severe social, legal or privacy issues. Apparently it is urgent and also challenging to find effective methods to differentiate them. Photorealistic computer graphics are becoming more and more perceptually indistinguishable from photographic images. However, perceptual indistinguishability between photographs and photorealistic images does not imply complete indistinguishability. Even the most sophisticated rendering algorithms are based on rough models of the real world where photographs are produced through complex interactions among
objects, photons, and imaging devices, let alone simplistic ones that only aim at perceptual realism. The deviation of the computer simulating process from the real-world physics results in statistical differences between photographs and photorealistic images. If we find appropriate image features that capture the differences between photographic and computer graphic, we can design a two-class classifier to distinguish them.
ISSN: 1992-8645 www.jatit.org E-ISSN: 1817-3195
This paper is organized as follows. Section 2 presents the related works. The feature extraction method is described in section 3. The classification and detection of local forgery based on PPSVM are introduced in section 4 and 5. Experimental results are discussed in section 6. Finally, conclusion is drawn in section 7.
2. RELATED WORK
Recently, researchers have come up with some effective methods aiming at distinguishing the PG
and the CG. Farid[1] uses a statistical model based
on first four order wavelet statistics to capture regularities inherent to photographic images. A three level quadrature mirror filter (QMF) is computed, where the numbers of features is 72D per color channel, and henthforth 216D features is formed in total considering three color channels. T.
T. Ng et.al [2] gives an image model based on
geometry, which revealed certain physical
differences between the two categories, such as the gamma correction in the PG and sharp structures in the CG. The 192D geometry features are extracted
from each image. In literature [3], the authors found
that sensor pattern noise can be served as unique identification fingerprint of the images. The pattern noise can be obtained from images using a
denoising filter. The paper [4] pointed that image
acquisition in a digital camera is fundamentally different from the generative algorithm deployed by computer generated image. Pattern noise introduced by different digital cameras may have common properties, but this common characteristic will not be present in computer graphics. So the pattern noise can be used to identify the differences between the CG and the PG. Ying Wang and Pierre
Moulin [5] proposed a very efficient method by
extracting 144-dimensional (144-D) feature vector from characteristic functions of wavelet histograms. Statistics of the most significant digits are extracted from image’s Discrete Cosine Transform (DCT) coefficients and magnitudes of image’s gradient in literature [6].
Beside the challenge of the classification of the PG and the CG, the composition of the PG and the CG is also a challenge for the authenticity of digital images, i.e., how to judge whether objects created by computer graphics software are inserted in natural images, or vice versa. So we can’t simply say that the image is the PG or the CG, but we may find out that some small blocks in the image are the
CGs and others are the PGs. Conotter[7] develop a
method based on wavelet transform domain features
as described in literature [1] and sophisticated
pattern noise statistics to detect local forgeries composite of the CG in the PG. The total dimension of features is as many as 228D.
3. FEATURE EXTRACTION
As we know from previous works [2][5][8][9],
the main characteristics of CG generated with basic algorithms are that they have simple scenes without much depth, few and simple colors, patches of uniform color, strong black edges, containing text, and simple textures. Besides, CG often have a plastic/rubber feel because of a lack of details such as dust and small defects, subtle color variation, and radiosity caused by indirect lighting or specularity caused by light sources. Based on the above characteristics, this paper extracts color, texture and shape features for input of classifier.
3.1. Color Features
Color feature is the most widely used visual feature in image processing. The main reason is that color is often relevant to the object or scene which is contained in the image. In addition, color is less dependent on the size, direction and angle of the image itself with other visual features compared with other visual features. So it has a high robustness. The common methods to describe the color characteristics include color histogram, color moment, color sets, color aggregation vectors, as well as color features such as color correlative representation methods.
Stricker and Orengo [10] used color moments as
feature vectors for image retrieval. Since any color distribution can be characterized by its moments, and most information is concentrated in the low-order moments, only the first moment (mean), the second moment (variance) and the third moment (skewness) are taken as features in this paper.
The HSV color space is a non-linear transform of the RGB-cube. It is widely used in the field of color vision. The chromatic components hue, saturation and value correspond closely with the categories of human color perception. So, we obtain a 3-dimensional feature vector for each channel of HSV color space.
3.2. Texture Features
pattern (LBP), wavelet transform and co-occurrence matrix are the common used texture features.
3.2.1. Gray-level co-occurrence matrix [11]
One of the most popular and powerful ways to describe texture is gray-level co-occurrence matrix (GLCM). Co-occurrence matrix can be defined as the co-occurrence of the intensity value at a particular instance and at a particular angle. Features consist of energy, entropy, contrast and correlation are computed from gray level co-occurrence matrixes in four directions (00, 450, 900, 1350) in this paper.
3.2.2. Tamura texture feature [12]
Coarseness, contrast and directionality of tamura texture feature have considerable effects on image analysis. Coarseness is the degree of coarseness of the image. Contrast refers to the level of contrast between image colors. A larger contrast value indicates higher and more evident variations between colors. Directionality can generally describe the degree of directional variation of a certain color. A larger value of directionality indicates a higher degree of directional variation of the color.
3.2.3. Local binary pattern [13]
The LBP texture analysis operator is defined as a grayscale invariant texture measure, derived from a
general definition of texture in a local
neighborhood. For each pixel in an image, a binary code is produced by thresholding its value with the value of the center pixel. A histogram is created to collect up the occurrences of different binary patterns. The basic version of the LBP operator considers only the eight neighbors of a pixel and produces rather long histograms (256). In literature
[14], Heikkilä introduced the CS-LBP operator for
region description which is more efficient than LBP.
The scheme functions of LBP and CS-LBP are given together as
(
,)
1,0 ,
i c
LBP i c
p p S p p
otherwise
> =
(1)
(
)
( / 2)( / 2) 1, ,
0 ,
i i p
CS LBP i i p
p p T
S p p
otherwise +
− +
− >
=
(2)
where p pi, i+( / 2)p and pccorrespond to the gray-level of center-symmetric pairs of pixels and the center pixel on a circle of radius R, T is the threshold for the CS-LBP descriptor. The binary pattern of LBP and CS-LBP are calculated as
(
)
1
,
0
( , ) , 2
P
i
P R LBP i c
i
LBP x y S p p −
=
=
∑
× (3)(
)
( / 2)1
, , ( / 2)
0
( , ) , 2
P
i
P R T CS LBP i i p
i
CS LBP x y S p p
−
− +
=
− =
∑
× (4)where (x,y) denotes the coordinates of a pixel.
It is clear that the LBP produces 256 (28)
different binary patterns, whereas the CS-LBP
produce only 16 (24) different binary pattern for 8
neighbors.
3.3. Shape Features
The shape of objects and regions is another important feature to express the image information. Generally speaking, there are two methods to represent the shape features. One is the contour feature. The other is the region character. The former uses only the outer boundary of objects, while the latter relates to the shape of the whole region.
HU invariant moments are put forward by
M.K.Hu[15]. It is an invariant moment algorithm,
and has the stability characteristics in condition of translation, rotation and zoom. At present, the
invariant moments have become important
characteristics and are widely used in image recognition. It mainly represents geometrical characteristics of the object’s shape. The first order moment is relevant to shape. The second order moment shows the expansion degree of the average, and the average comes from the curve which is around linear. The third order moment is about the measurement of average’s symmetry.
For digital images, we assume the image’s gray distribution is f (x, y), after discrete, the (p + q) order ordinary moments and center moments’ formulas as follows:
1 1 ( , )
M N p q
pq x y
m =
∑ ∑
= = x y f x y (5)0 0
1 1( ) ( ) ( , )
M N p q
pq x y x x y y f x y
µ =
∑ ∑
= = − − (6)Where p,q=0,1,2,…
The normalized center moment:
00
pq
pq r
y µ
µ
= (7)
where 2
2
p q
r= + + , p+q=2,3,…
ISSN: 1992-8645 www.jatit.org E-ISSN: 1817-3195
the condition of translation, rotation and zooms at the same time. If we use the normalized center moment, the shape feature not only has stability in translation, but also has in zoom.
HU invariant moments use the second order moment and the third order to construct seven invariant moments. They keep translation, zoom and rotation invariant in continuous image, with the formulas as follows:
1 20 02
HU =y +y (8)
2 2 2 ( 20 02) 4 11
HU = y +y + y (9)
2 2
3 ( 30 3 ) (3 21 03)
HU = y + y + y −y (10)
2 2
4 ( 30 12) ( 21 03)
HU = y +y + y +y (11)
2 2
5 30 12 30 12 30 12 21 03
2 2
21 03 21 30 30 12 21 03
( )( )[( ) 3( ) ]
3( )( )[3( ) ( ) ]
HU y y y y y y y y
y y y y y y y y
= − + + − +
+ − + + − + (12)
2 2
6 20 02 30 12 21 03
11 30 12 21 03
( )[( ) ( ) ]
4 ( )( )
HU y y y y y y
y y y y y
= − + − + +
+ + (13)
2 2
7 21 03 30 12 30 12 21 03
2
30 12 21 30 30 12 21 03 2
3( )( )[( ) 3( ) ]
( 3 )( )[3( ) ( ) ]
HU y y y y y y y y
y y y y y y y y
= + + + − + +
− + + − +
(14)
3.4 Feature Fusion
In order to improve the performance, several features fusion is used in this paper. First, third-order statistical moments of HSV color space with 9 dimensions is extracted. Second, features such as energy, entropy, contrast and correlation are the most important texture features of image. So 16D features consist of energy, entropy, contrast and correlation are computed from gray level co-occurrence matrixes in four directions. Third, we extract histogram feature of the CS-LBP with 16 dimensions, instead of the traditional LBP features with 256 dimensions. Forth, tamura texture features
includes coarseness, contrast, directionality,
regularity and linelikenesss etc. But only three important features such as coarseness, contrast and directionality are used in our method. Last, Hu invariant moment features are considered to be a description of the statistical characteristics of the image's shape. Seven features including second order and third order of Hu invariant moment are obtained to describe the shape of the image in our method. The process of feature extraction is shown in Figure 1. In summary, the proposed method computed 51D features including 9D color features, 16D GLCM features, 16D CS-LBP features, 3D Tamura texture features and 7D Hu moment invariant features.
(16D)energy, entropy, contrast and correlation of GLCM in four
directions
(51D) color, texture and shape Features Input
Image (16D)Histgraom of CS-LBP
(3D)coarseness, contrast and directionality of tamura texture
(7D)second order and third order of Hu invariant moment (9D)third-order color moments of
HSV
Figure 1: The Process of Feature Extraction
4. CLASSIFICATION BASED ON
POSTERIOR PROBABILITY SUPPORT VECTOR MACHINE
The posterior probability support vector machine (PPSVM) is used for the automatic classification in this paper. The PPSVM has shown good performance in pattern recognition.
4.1. Posterior Probability Support Vector Machine
Platt[16] provided a kernel method where a
standard SVM plus sigmoid is trained to yield a posterior probability. A sigmoid is fit to map standard SVM outputs to posterior probabilities, and the sparseness of SVM is still retained. The PSVM maintains comparable performance with that of standard SVM.
Given training data n, 1, ...,
i
x ∈R i= l, labeled
byyi ={1, 1}− , the binary Support Vector Machine
(SVM) obtains a decision function f x( )so that
sign(f x( )) is the prediction of any test data
x
.Instead of predicting the label, many applications
require a posterior class probability p y( =1 | )x .
The literature [16] proposes to approximate
( 1 | )
p y= x by a sigmoid function
1 ( )
1 exp( ( ) )
P x
Af x B
=
+ + (15)
with parameters A and B. To estimate the best
values of (A,B), any subset of
l
training data(N+of them with
y
i=
1
, and N− of them with1 i
y = − ) can be used to solve the following
maximum likelihood problem:
( , )
min ( )
z A B
F z
= (16)
1
( ) ( log( ) (1 ) log(1 ))
l
i i i i
i
F z t p t p
=
= −
∑
+ − − , (17)1
, ( )
1 exp( )
i i i
i
p f f x
Af B
= =
+ + ,
1
1 2
, 1, 2, ..., 1
1 2
i
i
i
N
if y N
t i l
if y N
+
+
−
+
=
+
= =
= −
+
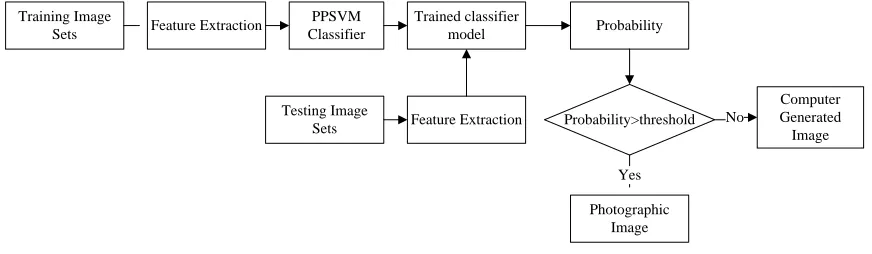
4.2 The Procedure of Classification
The procedure of classification is shown in figure 2. First, Features of every image extracted from image database as the training sets are sent to the PPSVM classifier initially for training (to learn the
pattern) and for predicting the labels of unknown samples once the training is complete. Second, features of testing images are fed into the PPSVM trained classifier, resulting in a probability of image belonging to photographic images or computer generated image. Compared with the output of standard SVM of label “1” or “-1”, the output of PPSVM is a probability value. These testing images belonging to photographic images will have a high probability, and vice versa. By setting a threshold between 0 and 1, testing images can be divided into two categories. If the probability of one image is greater than the threshold, this image belongs to the category of photographic images, and vice versa. We can achieve better results by adjusting the threshold.
Feature Extraction PPSVM
Classifier Probability
Trained classifier model
Probability>threshold
Photographic Image
Computer Generated Image Training Image
Sets
No
Yes Feature Extraction
Testing Image Sets
[image:5.612.92.528.290.417.2]
Figure 2: The Procedure of Classification
5. DETECTING THE COMPOSITE OF
PHOTOGRAPHIC IMAGES AND
COMPUTER GENERATED IMAGES
While the classifiers in general perform well on images belonging to a clear-cut category, there is a group of images that confuse the classifiers. This group includes both photographs with graphic content embedded in 3-D real-world scenes and images composed using both photographic and the
CG elements [17]. Based on our proposed
classification method, we try to detect local forgeries that composite of the CG elements in photographic, and vice visa.
Each spliced image is firstly divided into overlapping blocks with size of n*n. As a result, we can get (M-n)*(N-n) blocks for an M*N pixels image. Then, features extracted from each block based on our feature extraction method mentioned above will be sent to the trained PPSVM. Finally, we can find out the forgery area by marking these blocks with different colors according to the probability.
6. RESULTS AND DISCUSSION
6.1. Image Dataset
In the experiment, we used 800 photographic
images in the Columbia Image Dataset [18] and
800 computer graphics (download from irtc.org) with different level of photorealism. All images are colored, compressed JPEG, and of different size. The scenes of the images have a wide range including indoor and outdoor scenes with landscape, persons, and objects.
6.2 Classification Performances
The Least Squares Support Vector machine (LSSVM) classifier with RBF kernel was employed in the experiment. We used the “grid-search”
method to find the optimal parameters σ and γ of
RBF kernel. To train the LSSVM classifier, we randomly selected half of the images (400 PGs and 400 CGs) as training sets, and the rest of the images (400 PGs and 400 CGs) are used as testing sets.
In our experiments, we compare classification performance of different features under the same experimental conditions. Besides, we made
comparisons with previous works [3][19]. Here, we
ISSN: 1992-8645 www.jatit.org E-ISSN: 1817-3195
and test by using the same classifier and parameters in this paper based on our image database. Difference-histograms feature in our experiments achieves accuracy rate of 86.25% which is lower
than accuracy rate of 94.3% in [19]. The reason
[image:6.612.89.307.195.384.2]may be that we use different classifier and different image database. The results are shown in table 1.
Table 1: Classification Results with Different Features
Different Characteristics
Feature Dimension
Accuracy Rate Third-order Moments
of HSV color 9D 76.75%
GLCM Features 16D 72.25%
Tamura Texture
Features 3D 70.125%
Hu Invariant Moments 7D 69%
CS-LBP 16D 81.25%
Pattern Noise
Features[3] 12D 66.25%
Difference-histograms
Features[19] 56D 86.25%
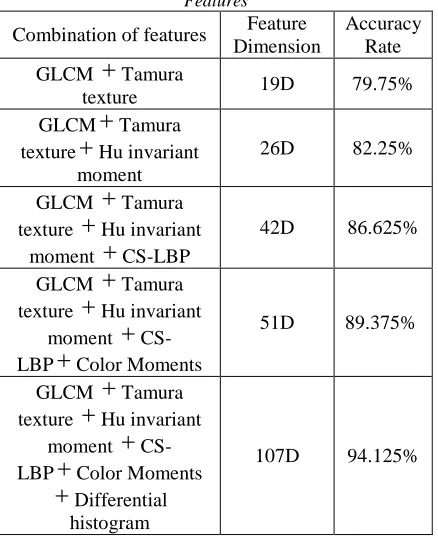
We also combine several features to construct a more robust classifier. The results are shown in table 2.
Table 2: Classification Results Combining Different Features
Combination of features Feature
Dimension
Accuracy Rate
GLCM
+
Tamuratexture 19D 79.75%
GLCM
+
Tamuratexture
+
Hu invariantmoment
26D 82.25%
GLCM
+
Tamuratexture
+
Hu invariantmoment
+
CS-LBP42D 86.625%
GLCM
+
Tamuratexture
+
Hu invariantmoment
+
CS-LBP
+
Color Moments51D 89.375%
GLCM
+
Tamuratexture
+
Hu invariantmoment
+
CS-LBP
+
Color Moments+
Differentialhistogram
107D 94.125%
From the table 2 and table 3, we can find that accuracy rate of 51 dimension features combined with color moment, GLCM, Tamura texture, Hu invariant moment and CS-LBP is 89.375%, higher than 86.25% of 56 dimension differential histogram feature. Further, classification accuracy rate combined with all the features including differential histogram features, color moment, texture features and shape features will reach 94.125%. According to the experimental results, it shows that features combined with color, texture and shape are effective in distinguishing the photographic images and computer generated graphics.
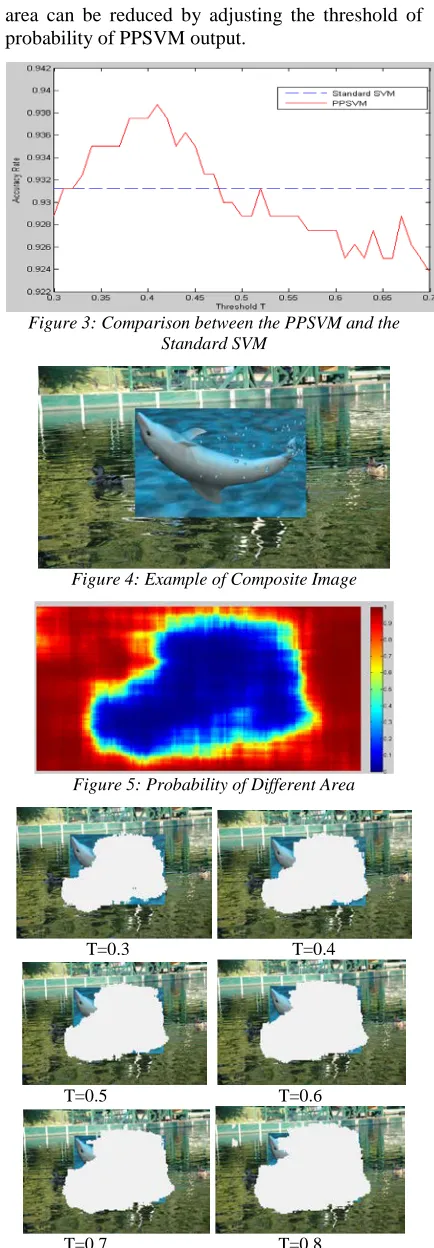
At the same time, we made a comparison between the PPSVM and the standard SVM. Classification accuracy of the PPSVM can be further improved through adjusting the threshold T. As shown in figure 3, when threshold T is 0.41, the classification accuracy reached 93.875%, greater than 93.125% of the standard SVM.
6.3 Detecting the Composite of Photographic Images and Computer Generated Images
[image:6.612.90.309.458.726.2]area can be reduced by adjusting the threshold of probability of PPSVM output.
Figure 3: Comparison between the PPSVM and the Standard SVM
Figure 4: Example of Composite Image
Figure 5: Probability of Different Area
T=0.3 T=0.4
T=0.5 T=0.6
T=0.7 T=0.8
Figure 6: Experimental Results with Different Threshold
7. CONCLUTIONS
Based on the main characteristics of CG, several features such as color, texture and shape features are extracted in this paper. Then, those features are fed into the PPSVM for training and testing to generate the probability of one image belonging to photographic images or computer generated image. By adjusting the threshold of probability, we can achieve better results of classification and good performance on detection of local forgeries composite of photographic image and computer generated image. The experimental results demonstrate that our method is efficient with high detection accuracy. The future work is to extract more other features about color, texture and shape, and then obtain best combinations of all the features through intelligent searching algorithm to further achieve better detection accuracy while maintaining optimal time complexity.
REFRENCES:
[1] Lyu, S. and H. Farid, "How realistic is
photorealistic", IEEE Transactions on Signal
Processing, vol.53, no.2, 2005, pp.845-850
[2] Tian-tsong Ng, Shih-fu Chang, Jessie Hsu and
Lexing Xie, "Physics-Motivated Features for Distinguishing Photographic Images and
Computer Graphics", Proceedings of the 13th
annual ACM international conference on Multimedia, New York, NY, USA, 2005, pp.239- 248
[3] J. Lukáš and J.F.A.M., "Digital Camera
Identification from Sensor Pattern Noise",
IEEE Transactions on Information Forensics and Security, vol.1, no.2, 2006, pp.205-214
[4] S. Dehnie and T.S.N.M., "Digital Image
Forensics for Identifying Computer Generated and Digital Camera Images", IEEE ICIP, 2006, pp. 2313-2316.
[5] Moulin and Y.W.A.P., "On Discrimination
between Photorealistic and Photographic", http://www.ifp.illinois.edu/~ywang11/paper/IC ASSP06_Revised.pdf
[6] Xu Bo, Wang Junwen, Liu Guangjie and Dai
Yuewei, "PHOTOREALISTIC COMPUTER GRAPHICS FORENSICS BASED ON
LEADING DIGIT LAW", JOURNAL OF
ELECTRONICS (CHINA),vol.28, no.1,2011, pp.95-100
[7] V. Conotter, L.C., "Detecting Photo Graphic
and Computer Generated Composites",
ISSN: 1992-8645 www.jatit.org E-ISSN: 1817-3195
SPIE Vol. 7870, 2011
[8] Tian-Tsong Ng and S.C., "Classifying
Photographic and Photorealistic Computer Graphic Images using Natural Image Statistics". 2004, Department of Electrical Engineering, Columbia University.
[9] Ianeva and T.I., "Detecting Cartoons: a Case
Study in Automatic Video-Genre Classification". Ph. D. Research Work, 2003, Valencia.
[10] Stricker, M.A. and M. Orengo, "Similarity of
color images", Proceeding of the Storage and
Retrieval for Image and Video Databases III, February 9, 1995, pp.381-392
[11] R. M. Haralick and K.S.I.D., "Textural
Features for Image Classification", IEEE
Transaction on Systems, man and Cybernetics,vol.SMC-3, 1973, pp.610-621
[12] Tamura, H., S. Mori and T. Yamawaki,
"Texture features corresponding to visual
perception", IEEE Transactions on systems,
Man and Cybernetics, vol.8, no.6, 1978, pp. 460-473
[13] Ojala, T., M. Pietikainen and D. Harwood,
"Comparative study of texture measures with classification based on feature distributions", Pattern Recognition, vol.29, no.1, 1996, pp.51-59
[14] Heikkila, M., M. Pietikainen and C. Schmid,
"Description of interest region s with local binary patterns", Pattern Recognition, vol.42, no.3, 2008, pp.425-436
[15] MK, H., "Visual Pattern Recognition by
Moment Invariants", IRE Transactions on
Information theory, IT, vol.8, 1962, pp.179-187
[16] Platt, J., "Probabilistic outputs for support
vector machines and comparison to regularized likelihood methods", Advances in Large Margin Classifiers, 2000, MIT Press.
[17] Ng, T. and S. Chang, "Identifying and
prefiltering images", IEEE Signal Processing
Magazine, vol.26, no.2, 2009, pp.49-58
[18] Columbia Photographic images and
Photorealistic computer graphics dataset. http://www.ee.columbia.edu/ln/dvmm/downloa ds/PIM_PRCG_dataset/
[19] Wu, R., X. Li and B. Yang, "Identifying
Computer Generated Graphics VIA Histogram
Features", Proceeding of the IEEE