International Journal of Emerging Technology and Advanced Engineering
Website: www.ijetae.com (ISSN 2250-2459,ISO 9001:2008 Certified Journal, Volume 3, Issue 6, June 2013)
119
Emission and Performance Test on Petrol Engine Using Fuel
Modification
V. Balaji Raman
1, X. Alexander
2 1,2Mechanical Engineering Department, ThiagarajarEngineering College, Madurai.
Abstract—This work presents the cold-start exhaust gas emission levels and also performance test on a petrol engine by using the fuel blends. The vehicle, powered by gasoline fuelled engine, was used in the experiments. The fuel for the engine is supplied using the conventional carburettor system. Cold-start emission levels are measured for gasoline-ethanol and gasoline-isobutanol blends at different proportion. Emission values are recorded for E5 to E20 in steps of 5% and for isobutanol, it is from IB10 to IB50 insteps of 10% increase. The cold start emission test results show that hydrocarbon
and carbon monoxide content is lowest for IB 30. And IB30
showed the highest increase of brake thermal efficiency of
8.7%.
Keywords— Fuel blends, cold start emissions, gasoline-ethanol, gasoline-isobutanol, performance.
I. INTRODUCTION
Alcohols have become the most attractive alternate fuel, in the current scenario of worsening global warming. Ethanol is produced commercially using sugar and corn whereas isobutanol can be produced from renewable feedstock and also from E-coli using the keto acid pathway. Ethanol has been used as fuel since the nineteenth century, but it was replaced by cheaper petroleum based fuel. It led to environmental crisis and increase of global warming. Knowing it, many countries started encouraging bioenergy. Politicians and law makers from all over the world have been constantly taking steps to increase the process of using renewable automobile fuels blended with the conventional gasoline. But, the production of biofuels and its sustainability is an issue which is too difficult to resolve, keeping in mind the factors like rising prices of food and land availability, environmental and social issues. Hence, it is preferred to go on for blends rather than opting for automobiles running completely on biofuels. So, the study is made using the gasoline-ethanol and gasoline-isobutanol blend in various proportions.
Many earlier studies have evaluated the possibilities of using ethanol as an additive in engine as a fuel due to its high octane value and also ability of ethanol to increase the octane value of gasoline.
Besides, Yücesu HS, Topgül T, Çinarm C, Okur M study shows the high flammability and evaporation heat for gasoline- ethanol blends effects positive effects on engine performance.
Alvydas Pikunas, Saugirdas Pukalskas & Juozas Grabys worked on gasoline-ethanol blends in the spark ignition engine. The study revealed that addition of ethanol resulted in decrease of the calorific value of the fuel whereas the octane number of the fuel increases. Apart from that, the test indicated that engine power and specific fuel consumption of the engine slightly increase when gasoline-ethanol blend is used. D.Balaji investigated the effect of ethanol-gasoline blend and ethanol-gasoline-isobutanol blends on a SI engine. The emission results showed that while blending unleaded petrol, the HC content is lowest for petrol- 87.5%+ ethanol 10% + isobutanol 2.5%.The addition of blends didn’t decrease the performance of the engine.
Benjamin R.Wigg investigated the pollutant content using butanol-gasoline blend emission in addition to trying the same engine with neat butanol. The results showed that 25% butanol and 75% gasoline reduces the UBHC(unburned hydrocarbon) content. But when neat butanol is used, the results show increases in the emission content of UHC when comparing it with pure gasoline.
After number of experiments based on US Federal Test Procedure (FTP-75), results showed that HC, CO, NOx content were reduced after 240s. So, it was inferred that most part of the pollution gases emitted by a spark-ignition IC engines comes from the first 200 seconds of operation, known as the cold start period.
International Journal of Emerging Technology and Advanced Engineering
Website: www.ijetae.com (ISSN 2250-2459,ISO 9001:2008 Certified Journal, Volume 3, Issue 6, June 2013)
120
II. EXPERIMENTAL SETUP
The project study focuses on the cold-start emission control and also performance test by fuel modification in a conventional two-wheeler Spark Ignition engine. The details of the engine are shown in Table 1.
TABLEI
ENGINE DETAILS
Item Specification
Engine Spark Ignition Engine No. Of cylinders Single cylinder No. Of valves 4
Swept volume 149.01 cc Bore diameter 57 mm
Stroke 58.4 mm
Power 14.09 HP (10.3 kW)) @ 8500rpm
Torque 12.76 Nm (1.3 kgf-m or 9.4 ft.lbs) @ 6500 rpm Compression 9.5:1
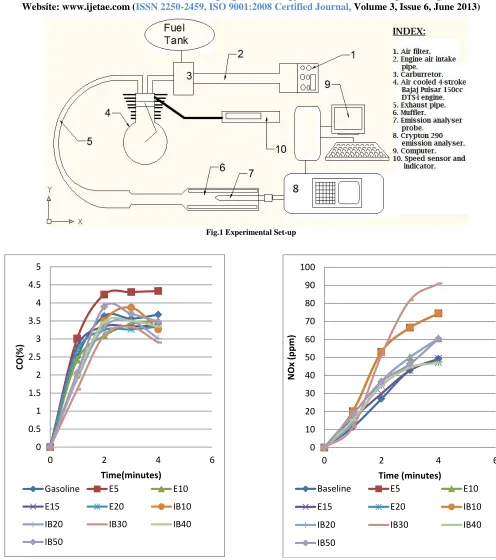
No changes in the engine were made. The schematic diagram of the project setup is shown in figure 1.
The air would be naturally aspirated through the air filter. Then it would mix with the fuel vapor from the fuel tank in the carburetor and sent to the engine for combustion. The exhaust gas would leave the engine and it escapes to the environment through the muffler.
Initially, the carburetor of the engine was cleaned to remove the residues present and the engine was checked for sustained running. The speed of the engine was monitored from the spark-plug pulses to the engine by using an electronic tachometer.
During the experiment the speed of the engine is maintained at 1400±50 rpm. After 240s, performance test of the engine was done under various loads.
III. RESULT AND DISCUSSION
The emission contents were compared with the baseline reading
.
Then the performance tests were made on the engine. The results were plotted.A. Exhaust Emission
The effect of adding ethanol and isobutanol with gasoline on HC, CO and NOx contents are shown in Fig 2,3,4 respectively.
Fig.2 HC vs Time 0
200 400 600 800 1000 1200 1400
0 2 4 6
H
C(p
p
m
)
Time(minutes)
Gasoline E5 E10
E15 E20 IB10
IB20 IB30 IB40
International Journal of Emerging Technology and Advanced Engineering
Website: www.ijetae.com (ISSN 2250-2459,ISO 9001:2008 Certified Journal, Volume 3, Issue 6, June 2013)
[image:3.612.55.551.118.678.2]121
Fig.1 Experimental Set-up
Fig. 3 CO vs Time Fig.4 NOx vs Time
0 0.5 1 1.5 2 2.5 3 3.5 4 4.5 5
0 2 4 6
CO(%
)
Time(minutes)
Gasoline E5 E10
E15 E20 IB10
IB20 IB30 IB40
IB50
0 10 20 30 40 50 60 70 80 90 100
0 2 4 6
NOx
(p
p
m
)
Time (minutes)
Baseline E5 E10
E15 E20 IB10
IB20 IB30 IB40
International Journal of Emerging Technology and Advanced Engineering
Website: www.ijetae.com (ISSN 2250-2459,ISO 9001:2008 Certified Journal, Volume 3, Issue 6, June 2013)
122
[image:4.612.72.283.197.427.2]Addition of alcohols on the gasoline, resulted in increase of oxygenates which provides better combustion leading to reduction in the HC and CO content in the exhaust. These also provided addition of heat to increase the brake thermal efficiency of the engine.
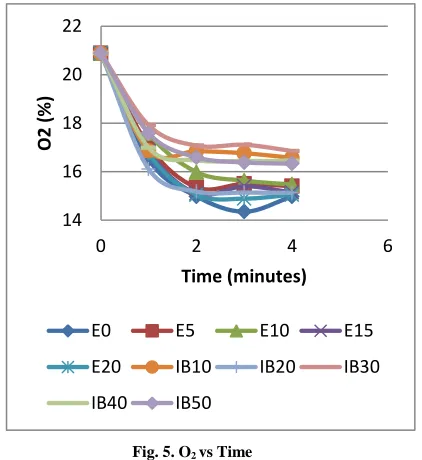
Fig. 5. O2 vs Time
Though the increase in O2 content was not harmful, it would help us in knowing the combustion characteristics. Knowing the percentage of oxygen in the exhaust one may estimate the air/fuel ratio of the engine as it runs. Therefore higher the oxygen content, higher was the lean mixture sent to it whereas lower the oxygen content, lower was the lean mixture i.e. rich mixture is sent to the engine. This is the reason why there was a decrease in HC and CO content. In case of the HC and CO emission content was found to be lowest for IB30.
B. Performance Test
Calorific Value and Energy consumption Rate:
The calorific value of the blends and their corresponding energy consumption rate were calculated using the relation.
∑
[ ] ⁄
where t - time for 5cc in seconds.
CVmix- calorific value of fuel.
ρmix - density of the fuel mixture.
The final values of the calorific value and energy consumption rate of various blends were tabulated:
TABLE II
CALORIFIC VALUE &ENERGY CONSUMPTION RATE
Blends Calorific Value (kJ/kg)
Energy consumption rate (kW or kJ)
Gasoline 44000 3.30
E5 43164 3.20
E10 42336 3.17
E15 41515 3.37
E20 40708 3.49
IB10 41393 2.31
IB20 42240 2.05
IB30 43109 1.87
IB40 40566 1.91
IB50 39760 1.95
[image:4.612.322.564.455.668.2]Fuel consumption: Fuel consumptions in (kg/h) are plotted against torque in Fig.6 which shows that the fuel consumption increases with increase in torque at constant speed of the engine.
Fig. 6 : Torque vs Consumption 14
16 18 20 22
0 2 4 6
O2 (%
)
Time (minutes)
E0 E5 E10 E15
E20 IB10 IB20 IB30
IB40 IB50
0.5 0.55 0.6 0.65 0.7 0.75 0.8 0.85
0 0.5 1 1.5
Co
n
su
m
p
tion
(k
g/
h
)
Torque(Nm)
Baseline
E5
E10
E15
E20
IB10
IB20
IB30
IB40
International Journal of Emerging Technology and Advanced Engineering
Website: www.ijetae.com (ISSN 2250-2459,ISO 9001:2008 Certified Journal, Volume 3, Issue 6, June 2013)
123
Brake Thermal Efficiency: Brake thermal efficiency for all blends are plotter against the torque in Fig.7 from the plot IB 30 gives the maximum thermal efficiency.
Fig.7 : Torque vs BTE
IV. CONCLUSION
An experimental study was made on two wheeler SI engine using a chassis dynamometer. In this way, it was ensured that the test was closer to the real world problem. Cold start emission readings were noted in a neutral position, followed by the performance test. Both the performance and cold start emission were conducted on it using gasoline-ethanol and gasoline-isobutanol blend. The following conclusions were observed:
1.All isobutanol blends showed reduction in fuel consumption comparing with the neat gasoline. 2.HC and CO content from the exhaust was found to be
lowest for E10 and IB30, in case of gasoline-ethanol and gasoline-isobutanol blends respectively.
3.IB30 showed 40.9% and 11.34% reduction in the HC and CO content.
4.Energy consumption rate decreases with increase in alcohol content.
5.Blending ethanol and isobutanol with gasoline showed improvements in performance as well as reduction in exhaust emissions.
6.Addition of ethanol and gasoline showed increase in brake thermal efficiency in all case. IB30 showed the highest increase of brake thermal efficiency of 8.7%.
REFERENCES
[1] Najafi G, Ghobadian B, Tavakoli T, Buttsworth DR, Yusaf TF, Faizollahnejad M. 2009. Performance and exhaust emissions of a gasoline engine with ethanol blended gasoline fuels using artificial neural network. Appl Energy.Ding, W. and Marchionini, G. 1997 A Study on Video Browsing Strategies. Technical Report. University of Maryland at College Park.
[2] Schfer F, Basshuysen RV.,1995. Reduced emissions and fuel consumption in automobile engines. Altenburg: Springer-Verlag Wien and Society of Automotive Engineers, Inc.
[3] Das LM, Reddy YVR.1996.p.951-58 Evaluation of alternative fuels for internal combustion engine. In: First trabzon international energy and environment symposium; July 29–31.
[4] Bechtold RL.1997. Alternative fuels guidebook. Society of Automotive Engineers Inc.
[5] Hsieh WD, Chen RH, Wu TL, Lin TH. 2002. Engine performance and pollutant emission of an SI engine using ethanol–gasoline blended fuels. Atmos Environ.
[6] Yücesu HS, Topgül T, Çinarm C, Okur M.2006. Effect of ethanol– gasoline blends on engine performance and exhaust emissions in different compression ratios. Appl Therm Eng.
[7] Shaw,T.,Bryan and Hedrick,J.,Karl.2002. Coldstart engine combustion modeling to control hydrocarbon emissions. Triennial World Congress, Barcelona, Spain
[8] Wigg, R., Benjamin , A study on the emission of butanol using a spark ignition engine and their reduction using electro statically assisted injection
[9] Sorda G, Banse M, Kemfert C. 2010. An overview of biofuel policies across the world. Energy Policy
[10] Timilsina., GR, Shrestha A. How much hope should we have for biofuels? Energy, Corrected proof, in press,
[11] Ajanovic A. 2010. Biofuels versus food production: does biofuels production increase food prices? Energy Corrected proof, in press.. [12] Cai X, Zhang X, Wang D. 2011. Land availability for biofuel
Production. Environmental Science Technology.
[13] M.A. Hamdan, B.A. Jubran, The effect of ethanol addition on the performance of diesel and gasoline engines, Dirasat 13 (1986) 229e244.
[14] A.A. Abdel-Rahman, M.M. Osman, Experimental investigation on varying the compression ratio of SI engine working under different ethanol gasoline fuel blends, Int. J. Energy Res. 21 (1997) 31e40. [15] M.S. Badwan, Performance and knock limits of ethanol gasoline
blends in spark-ignited engines, SAE Paper 850213 (1985). 5
10 15 20 25 30
0 0.5 1 1.5
B
TE
(%
)
Torque(Nm)
Baseline
E5
E10
E15
E20
IB10