501
MULTI-LEVEL ATTRIBUTE-BASED MATCHING
APPROACH TOWARDS ENERGY-EFFICIENT RESOURCE
PROVISIONING IN CLOUD DATA CENTERS
1FRANK ELIJORDE, 2SUNGHO KIM, 3*JAEWAN LEE
1College of Information and Communications Technology, West Visayas State University, Philippines
2 Department of Control and Robotics Engineering, Kunsan National University, South Korea
3 Department of Information and Communication Engineering, Kunsan National University, South Korea
E-mail: 1frank, 2shkim, 3jwlee @kunsan.ac.kr *Corresponding author: JAEWAN LEE
ABSTRACT
In this paper, we present a resource provisioning technique which classifies data center entities through their attributes as characterized by their resource requirements. The classification process enables the multi-level matching approach which assigns client requests to the most appropriate VM, while the VM is assigned to a Host of similar characteristics. By considering the multi-dimensionality of compute resources, data center entities which include applications, VMs, and Hosts, are consolidated and assigned according to the most proportionate available resource. Evaluation results confirm the benefits of applying such techniques on the performance and energy consumption of a cloud data center.
Keywords: Resource Provisioning, Cloud Data Centers, VM Consolidation, Cloud Computing, Green
Computing
1. INTRODUCTION
The cloud computing model offers a very flexible option for businesses to scale up or scale down their IT systems by allowing them to acquire compute resource on-the-fly. However, the cost of maintaining a data center composes a significant portion of the cost of providing timely service [1].Workloads in a cloud data center can fluctuate considerably due to the dynamic behavior of user applications running on its virtual platform. This makes statically-configured virtual resources suffer much the same dilemma as dedicated physical resources: they are often either underutilized or overloaded. For these reasons, data centers are now equipped with monitoring capabilities and probes such as smart power distribution units to achieve energy efficiency and reduce overall cost. Considering a recent study that forecasts electricity consumption to rise 76% from 2007 to 2030 [2] citing data centers as the major contributor, an obvious indication of this increase emphasizes the importance of reducing energy consumption in the Clouds. In support of this, studies and experiments [3, 4] have found that an active server with very low CPU utilization consumes between 50 and 70 percent of the power that it consumes when fully utilized.
The aforementioned scenario raised the concern regarding the importance of VM (virtual machine) assignment and VM placement in reducing energy consumption in data centers. Existing works such as [5] and [6] show the impact of the virtual machine placement problem, and how cloud operators can benefit from the use of efficient placement policy in terms of energy savings. Obviously, the most straightforward way to lower energy consumption in a data center is to reduce the number of running PMs (physical machines). As different VMs require different kinds and amounts of resources (e.g., CPU, RAM, bandwidth, storage), strategies for placing VMs on PMs need to consider the fact that a PM cannot host any more VM if one of its resources is exhausted, even when all other resources are sufficient. Those unutilized resources in a fully loaded host, still consume significant amount of energy and is detrimental to the profitability of a cloud infrastructure. Thus, in order to improve the resource utilization in a way that minimizes the number of running PMs, part of our goal is the reduction of resource excess among hosts.
502 alleviation is often considered to be a more practical approach in contrast to pure load balancing which requires maintaining an equal distribution of load at all times as the latter may require expensive migrations even when the system is not under stress. However, deciding which VMs that are running on the overloaded hosts are to be migrated and to where remain a challenge. In an instance where a virtual machine needs to be deployed to a server, requirements regarding CPU, RAM, network, and storage of the host machine should be carefully considered. Therefore, the multidimensional needs have to be carefully matched with the multidimensional loads and capacities on the servers. This policy should also be observed on the upper level of resource consolidation which aims to establish proper matching between applications and the VM to which they will be assigned for execution. From a wider view, our goal is to efficiently consolidate virtual resources among data center entities (applications, VMs, PMs) and to alleviate hot spots through VM migration. This leads us to a twofold objective of imposing energy efficiency in a cloud data center and at the same time upholding the SLA (service level agreement) contracted with the clients.
In energy-aware data centers, the efficient consolidation of virtualized resources to client applications is influenced by strategies behind the VM Assignment and VM Placement. The aforementioned procedures are geared toward increasing the utilization of servers and dynamic consolidation of workload, while at the same time aiming to save energy and upholding the SLA. Previous approaches for management and consolidation of VMs in cloud data centers were mostly focused on a single requirement which is the CPU. That is, the allocation of resources for client requests were heavily based on the CPU requested; whereas the cloud controller’s approach for Data Center optimization is also based on the workload reflected by CPU utilization. Although CPU utilization has been regarded in numerous studies as a metric for evaluating the throughput and SLA adherence of a cloud data center, considering other resources such as RAM, Network, and I/O would lead to better profiling of the cloud users’ requirements which leads to a more accurate matching of Services to VMs and VMs to Hosts. As compared with a single-dimension approach towards provisioning of compute resource, we put forward a better strategy which considers the multi-dimensional nature of both the virtual machine and host requirements for compute resources.
The rest of the paper is organized as follows. In Section 2, we present the related work of our proposed approach directed towards energy-efficient cloud data center through proper VM placement, VM management, and monitoring. In Section 3, the architecture of the proposed system and the underlying components and algorithms are discussed. In Section 4, the implementation of the simulation setup is discussed; furthermore, the metrics for evaluation and the corresponding results are discussed in detail. Finally, in Section 5, we wrap up the importance of the problem addressed by our proposed approach and then conclude the paper.
2. RELATED WORK
In a cloud data center, the placement of virtual machines on a cluster of physical machines is a crucial task brought by the emerging virtualization technology; as such, different factors have to be considered in the process of VM placement. As matter of fact, much work has been done regarding VM placement in the cloud computing environment, which involves various constraints such as performance, availability, network, and cost. For instance, the work in [7] presents a high level overview of VM placement, and proposes a VM placement system architecture design, which adopts autonomic VM placement, to achieve cost savings from the better utilization of computing resources. A traffic-aware policy of optimizing the placement of VMs is proposed in [8]. Traffic patterns among VMs were aligned with the communication distance between them and VMs with mutual bandwidth usage are assigned to PMs in close proximity. As for the work in [9], they take network conditions into account to minimize the data transfer time consumption and maintain application performance. To achieve better performance, live migration is adopted in their work. An application profiling technique was employed in [10] to improve resource utilization in the process of VM placement.
503 allocation to VMs is done by considering the relationship between two heterogeneous workload types such as transactional and long running tasks, by looking at their respective resource needs to meet SLA goals. The work in [13] employed average resource utilization over a configurable time window to carry out different VM placement policies toward power saving and load balancing among hosts; however, as the authors pointed out, the amount of required VM migrations might quickly become too high in case of high churn which affects system performance. A Power Manager energy monitoring service is presented in [14] as part of their GreenCloud data center solution. It collects the energy usage information from Intelligent Power Distribution Units (iPDUs), which are devices installed on physical machines of the data center to perform real-time energy monitoring. The authors analyzed and extracted the temporal patterns of energy usage of different devices from the database which allowed them to devise energy distribution models for various machines. In [15], they proposed a hierarchical architecture for VM management in a large-scale data center. They deployed agents that work cooperatively to manage VMs in order to reduce the energy consumption and SLA violations. Due to the heterogeneity of various jobs, different VMs on the same PM can have different job completion times. Therefore, different VM placements have different job completion times.
3. CLOUD DATACENTER MONITORING AND OPTIMIZATION
3.1 System Architecture
The subscription and provisioning of various services in the cloud architecture discussed in this paper mainly involves the Cloud Users, the Data Center Broker, and the Cloud Service Provider. The cloud users are subscribed to the service providers of their choice and avail of the services being offered by form of requests which requires the consolidation of virtualized resources. The data center broker mediates and facilitates the aggregation, integration and customization of services and the corresponding compute resources to client requests. In this work’s context, we refer to a cloud service as a service utilized by IT consumers for a certain application, which in our proposed cloud system, is within the SaaS and PaaS layers of the cloud paradigm. Also, a cloud service can be composed of several services. On the other hand, the cloud service provider as the supplier of services hosted in a cloud data center needs to
manage a huge number of physical servers and keep the optimization of their performance and utilization.
With regards to resource consolidation, Fig. 1 shows the client applications requesting for compute resources. Requests are being gathered and processed by the Data Center Broker for their respective VM and Host assignments prior to their submission to the Cloud Manager. However, prior to the assignment procedure, the broker needs to classify the entities (Application, VM, Host) that are involved. The classification is important for determining the type of application that needs to be run, the type of VM in which it will be executed, and the type of host to which the VM will be deployed. Considering a layered approach, the Cloud Manager utilizes the VM mapping and Host assignment data to determine the number of client requests and their respective application class in terms of their resource requirements. At the platform level, the information gathered from the previous procedure will be used in order to deploy a number of compatible VM instances. The goal is to consolidate sufficient VM instances of different types according to the total amount of resources required by the client requests. Finally, within the infrastructure level, the goal is to assign the VMs into their respective servers as characterized by their attributes, which in turn will also determine the number and types of Servers that need to be activated in the data center. In this paper, the term ‘attribute’ refers to the resources (CPU, RAM, Nw, I/O) that are utilized by a data center entity. Thus, the class (e.g. cpu-intensive, memory-intensive) to which an entity belongs is determined by its most dominant attribute.
3.2 VM Consolidation
504
1. Algorithm: EntTypeList
2. Input: entPool //requests,VM,Hosts
3. Output: EntList //entity list
4. For each entity in entPool {
5. entype = GetType(entity)
6. entity.type = entype
7. EntList.add(entity)
8. }
9. Return EntList
10.Function GetType(entity) {
11.curHi = min
12.For each entity.attrib {
13.curAtt = entity.attrib
14.If curHi < curAtt
15.curHi = curAtt
16.}
17.Return curHi
18.}
1. Algorithm: Attribute-Based VM
Consolidation
2. Input: SrvList //service list
3. VMList //vm list
4. Output: SrvVmMap //mapping list
5. SrvList = EntTypeList(requests)
6. VMList = EntTypeList(VMs)
7.
8. For each Srv in SrvList{
9. Srv.mapped= false
10. For each VM in VMList{
11.if VM.type = Srv.Type
12. VMcompList.add(VM) //compatible
13. }
14.VMcompList.Sort // sort according to
attribute availability, ascending
15. For each VM in VMcompList{
16.if Srv.attrib VM.attrib {
17. SrvVMmap.Add(VM,Srv)
18. Srv.mapped= true
19. Continue
20. }
21. }
22.if Srv.mapped =false
23.SrvVMmap.Add(Rand(VMcompList),Srv)
24.}
machine for execution. A number of important considerations that we will tackle are: a) software services should run on platforms that are compatible to the application’s resource demands b) VMs should be deployed to hosts that are configured for certain classes of VMs. Thus, for a given entity with a set of attributes, it is important to establish its attribute weights and determine the most dominant one. For instance, to determine the dominant attribute of an application we use the following:
max . .
where (1)
min
max min (2)
The variable stands for the rescaled value of the compute resource i. Normalizing those values are important in order to give them an equal influence on an entity’s classification. After an application has been classified based on its dominant attribute, it will be assigned to a compatible VM for execution. It should be noted that the VMs were also subjected to a similar classification process. The process of generating the entity list with their corresponding types is shown in Algorithm 1.
Algorithm 1. Entity classification and list generation.
The algorithm takes as input the pool of requests, VM, and Hosts. For example, given a pool of VMs, each of them is assigned a class via the GetType function by deriving the most dominant attribute, which is the most utilized resource.
After the entity list and their corresponding classification are established, they
will be forwarded to the next process which is the VM consolidation. The procedure for the VM consolidation approach is shown in Algorithm 2.
Algorithm 2. The VM consolidation algorithm.
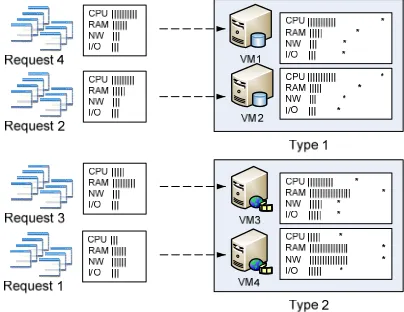
505 two entities is added to SrvMap and the request is set as mapped. However, if the loop terminates and the mapping condition is not met, a VM from the compatibility list will be randomly selected and assigned to execute the request. To better illustrate the VM consolidation process, it is shown in Fig. 2. In the figure, each VM is categorized according to their attributes and is then provisioned with a set of virtualized resources, each with corresponding maximum capacity indicated by ‘*’. Similarly, the incoming client requests are also classified in terms of their most dominant attribute. For example, Request 4 requires the following: CPU=800Ghz, RAM=256MB, NW=100mbps, I/O = 500MB; in this case, the most dominant attribute is its CPU requirement. Upon classification, it is determined that the application is compatible to VM1 and VM2 which are both classified as Type 1 virtual machines. Basically, all compatible VMs in the pool will be queried and the one with the highest utilization but can still provide the required resources without getting overloaded is selected as the application’s execution platform. To easily determine their compatibility, an application’s system requirements are being scaled against a VM’s available resources. The details of how the scaling is done are further discussed in the next section, which applies the same approach to the VM placement routine.
Fig. 2. The VM consolidation process.
3.3 VM Placement
After the VM consolidation, the VMs need to be deployed to their respective Hosts by the process of VM Placement. At this stage, the VM tasked to execute the given client requests will be assigned to a Host based on the following function:
where is the total ratio of the host’s available resources. On the other hand,
stands for the total resource requirement of the VM which is made proportionate to the available resources of the Host to which it is compared with. If the proportionate size of a VM is less than or equal to the server’s available resources, then the VM will be deployed to the said host. The proportion of a VM against the availability of a Host is derived by:
∗ ∗
∗ /
/ ∗
where
(4)
1 (5)
The variable w assigns weight to each attribute, thereby comprising the 100% combination of CPU, RAM, Nw, and Storage resources of the virtual machine and host. The same process is applied to each VM as they are compared against potential hosts that are available. The host utilization level , which is the accumulation of VM placements on a given host is quantified as:
(6)
where is the proportionate size of the VM i deployed in the host. Finally, the utilization level of the host should be governed by a condition such that: , indicating that a host’s utilization level should not exceed a certain threshold or else an overloading will occur which triggers VM migration.
For the users what matters is their demands are satisfied as reflected in the agreed upon SLA, which means the manner in which resources are allocated to them can be completely transparent. On the part of the provider, more profit can be gained by consolidating resources to user applications in a way which closely matches the actual compute requirements. The proposed VM
, , ,
506
1. Algorithm: Optimize Utilization
2. While request <> 0
3. uThreshold= GetUpperThreshold()
4. lThreshold= GetLowerThreshold()
5. For each host in ActiveHosts{
6. if hostOverloaded(host, uThreshold)
7. HMigList.Add(host)
8. if hostUnderloaded(host,lThreshold)
9. HMigList.Add(host)
10. }
11. For each host in HMigList{
12. SelectVM(host) //select vm from
host
13. VMList.Add(vm)
14. }
15. clear HMigList
16. For each vm in VMList{
17. AllocateVM(vm,host)
18. }
19. Clear VMList
20.End while
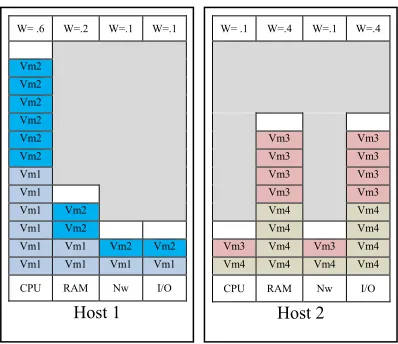
[image:6.612.95.294.114.286.2]Placement approach is illustrated in Fig. 3.
Fig. 3. VM Placement using VM and Host matching.
As shown, after the Data Center Broker received the incoming requests, the Cloud Manager activates the hosts that match the incoming workload. In the above example, Host1 and Host2 are configured for specific applications as indicated by the weight assignment of their dominant attributes. Consequently, VMs were consolidated to client applications according to their class, resulting to the deployment of Vm1 and Vm2 which were classified as CPU-intensive, and Vm3 and Vm4 which are RAM and I/O intensive. Knowing the type and attribute weights of the VMs and Hosts, efficient VM placement can be achieved by way of proportionate matching.
3.4 Load Monitoring and Optimization
Physical machines can turn into hot spots in which available resources are not sufficient to satisfy the provisioning requirements, while cold spots are over-provisioned hosts which lead to underutilization of resources and low energy efficiency in a data center. From a cloud provider’s point of view, handling hot spots is extremely important in order to meet the quality of service agreed upon with the clients. Moreover, eliminating cold spots would also leverage the optimal utilization of physical resources and eliminate resource wastage thereby taking advantage of virtualization to its full potential. To attain this, a number of considerations have to be met, as shown in Algorithm 3. First, we need to know whether a host is overloaded which would require migrating one or more VMs to a less loaded host. Similarly, an underloaded host also needs to migrate its VMs
to another host so it can be put to a low-power mode. Another consideration is the policy for the selection of VMs that need to be migrated. Finally, the VMs chosen for migration need to be re-deployed to new hosts; this process is not straightforward and also needs an efficient technique. Below, we show the overall algorithm for the optimization approach.
An overloaded host could occur due to excessive CPU, memory, network or disk I/O usage, depending on its class. To address the occurrence of overloads, the algorithm scans the utilization level of each host and whenever a host is found to be overloaded, it is added to the migration list. The goal of establishing a migration list is to prepare the transfer of one or more VMs from their hosts to the more suitable ones. As discussed in the previous section, the consolidation process assigns the VMs to client requests. However, application workloads are dynamic; when some VMs terminate or decrease their demand for compute resources, it could cause the server to become underutilized. Moreover, when the requirements of VMs spike up, a server becomes overloaded which leads to SLA violation. Failing to act upon the overloaded host would degrade the performance of the data center, while failing to meet the agreed upon QoS in the SLA would hamper its profitability.
Algorithm 3. The utilization optimization approach.
3.4.1 Hotspot Alleviation and VM Selection However, not at all times that a VM reported as overloaded would be subjected to immediate migration. We argue that migrating overloaded VMs in a greedy manner does not
W= .6 W=.2 W=.1 W=.1
Vm2 Vm2 Vm2 Vm2 Vm2 Vm2 Vm1 Vm1
Vm1 Vm2
Vm1 Vm2
Vm1 Vm1 Vm2 Vm2
Vm1 Vm1 Vm1 Vm1
CPU RAM Nw I/O
Host 1
W= .1 W=.4 W=.1 W=.4
Vm3 Vm3
Vm3 Vm3
Vm3 Vm3
Vm3 Vm3
Vm4 Vm4
Vm4 Vm4
Vm3 Vm4 Vm3 Vm4
Vm4 Vm4 Vm4 Vm4
CPU RAM Nw I/O
507
1. Algorithm: Alleviate Hotspot
2. Input: Host //overloaded host
3. Output: MigList //migration list
4.
5. RecTH = GetRecTime(Host)
6. For each vm in Host{
7. migTvm = GetMigTime(vm)
8. if RecTH MigTVM
9. tmpList.Add(vm)
10. }
11. tmpList.sort //sort decreasing
12. loadDiff=GetDiff(Host)
13. vmMig=false
14. For each vm in tmpList{
15. if
16. MigList.Add(vm)
17. vmMig=true
18. break
19. }
20. if vmMig=false
21. MigList.Add(tmpList[0])
22. Return MigList
necessarily lead to an optimal hotspot alleviation. There are instances that the overhead involved in migrating a VM costs more and it would be more practical to just allow the VM to execute and finish its processing. In our approach, we will first determine if the overloaded host can still recover from its current state and get back to its normal utilization level. The recovery time of a certain host is given by:
(7)
where is derived by summing up the difference between the total execution time and elapsed time of n applications running in m VMs. The recovery time of a host is then compared against the migration time of the VM in question. Whether to migrate a given VM or not is governed by:
,
, (8)
In cases where the recovery time of a host is greater than the migration time, the Migration Handler needs to decide which VM to migrate according to the migration list. Recall that hosts are also classified according to their dominant attribute to facilitate matching between them and the VMs they host. In the case of overloading, the Cloud Manager needs to find the difference between the overloaded host’s current utilization level and the upper threshold such as:
(9) For each overloaded host, their VM list is traversed and sorted according to their dominant attributes (e.g. CPU, RAM) in a decreasing order. For the purpose of bringing the utilization level of the host below its threshold as much as possible, the list is then searched for the VM whose proportion is greater than or equal to the host’s excess load and is then selected as candidate for migration; if no such VM is found, the one at the top of the list shall be selected. Doing so will alleviate the host of overloading in its most dominant attribute since our approach always consider the multi-dimensionality of compute resources in a data center. The entire process of selecting the VM for hotspot alleviation is shown in Algorithm 4.
Algorithm 4. The hotspot alleviation approach.
3.4.2 Host Selection and VM Migration
Once the VMs that need to be migrated have been chosen, the next step is to assign them to their new hosts. The strategy for choosing the hosts for the migrating VMs is concerned not only about finding hosts that can support them but also to maintain a desirable system performance by keeping the disruption as little as possible. For this purpose, we present a host selection approach which considers the overhead involved if a given VM will be migrated to a certain Host. The overhead of assigning a VM to a host is given by:
∗
where
(10)
/ (11)
where ∑ is the total
508
1. Algorithm: Host Selection
2. Input: MigList, Hostlist
//migration list, host list
3. Output: MigMap //migration map
4.
5. For each vm in MigList {
6. minOhead = max
7. For each host in HostList {
8. oHead = GetOverHead(vm, host)
9. if oHead < minOhead {
10. minOhead = oHead
11. migHost = host
12. }
13. }
14. MigMap.add(vm,host)
15. MigList.remove(vm)
16.}
17.Return MigMap //new host assignment
Algorithm 5. The host selection approach
4. IMPLEMENTATION AND EVALUATION RESULTS
4.1 Simulation Setup
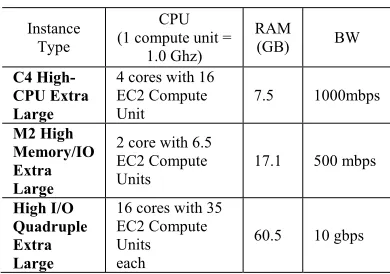
[image:8.612.312.522.486.602.2]Due to the hardware and software complexities and the massive size of a real-world cloud data center, testing it using physical machines would be very costly and impractical; thus, simulation has been a widely-used approach for system evaluations. Regarding the simulation platform, we used CloudSim toolkit [16] which is a simulation framework made in Java. After we modified and extended parts of the simulator, we implemented our proposed approach and performed extensive simulation equivalent to a 24-hour operation of a data center. The simulated data center is set by using realistic models of Cloud Applications, VM instances, and Host machines. With regards to the applications, we used specifications from the Google App Engine instances [17]. For the 1050 VM instances, we deployed 5 types of VM instances with characteristics similar to the Amazon EC2 instance types [18] shown in Table 1.
Table 1. VM instances specification.
Instance Type
CPU (1 compute unit =
1.0 Ghz)
RAM
(GB) BW
C4 High-CPU Extra Large
4 cores with 16 EC2 Compute Unit
7.5 1000mbps
M2 High Memory/IO Extra Large
2 core with 6.5 EC2 Compute Units
17.1 500 mbps
High I/O Quadruple Extra Large
16 cores with 35 EC2 Compute Units each
60.5 10 gbps
M1 GP Large
2 cores with 4 EC2 Compute Units each
7.5 500 mbps
M1 GP Small
1 core with 1 EC2 Compute Units each
1.7 250 mbps
For the heterogeneous data center setup, we considered 300 physical machines with specifications and power consumptions (in Watts) shown in Table 2. The server variants are: 1) Fujitsu PRIMERGY RX300 S7 (8 cores, Intel Xeon E5-2660 2.2 GHz processor, 16GB RAM), 2) IBM System X3500 M4 (8 cores, Intel Xeon E5-2680 2.7 GHz processor, 16GB RAM), 3) HP ProLiant DL380 G7 (6 cores, Intel Xeon X5675 3.07 GHz processor, 12GB RAM), 4) HP ProLiant ML110 G5 (2 cores Xeon 3075 2660 MHz processor, 4GB), 5) HP ProLiant ML110 G4 (2 cores Xeon 3040 1860 MHz processor, 4GB). The production of multi-core CPUs and improved virtualization led to the production of modern servers equipped with large amounts of memory, which begins to dominate their power consumption [19]. Furthermore, the recent hardware advancement and the complexity of modeling power consumption by modern multi-core CPUs makes building precise analytical models a complex research problem [20]. This is same reason we utilize real data on power consumption provided by the results of the SPECpower [21] benchmark instead of using an analytical model of power consumption by a server.
Table 2. Server power consumption at varying loads.
Server Variant
Target Load (%)
100 90 80 70 60 50 40 30 20 10 0 RX300 S7 255 217 187 156 134 117 105 95 85 75 54
X3500 M4 247 233 217 196 169 142 123 107 95 86 57
DL380 G7 222 199 180 163 147 136 126 116 106 94 52
ML110 G5 135 133 129 125 121 116 110 105 101 97 94
ML110 G4 117 114 112 108 106 102 100 96 93 90 86
4.2 Evaluation Results
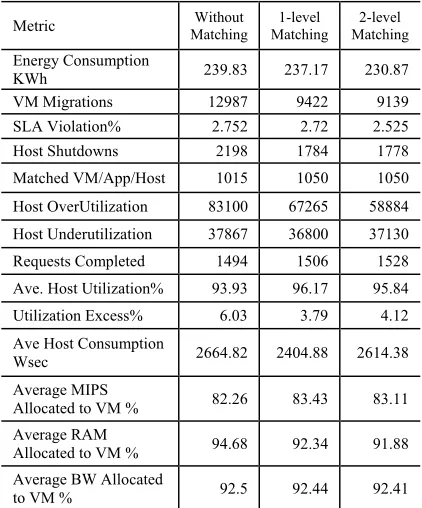
[image:8.612.96.291.593.730.2]509 Without Matching - requests are assigned to VMs and VMs are assigned to hosts using the First Fit Decreasing approach of bin packing, b) App/VM Matching – requests are assigned to VMs which match their attributes, c) App/VM/Host Matching– initiates another level of matching in which VMs are assigned to hosts that are similar to their characteristics.
[image:9.612.89.300.443.697.2]As shown in the table, imposing a policy which concerns the consolidation of VMs to client requests play an important role in improving the efficiency and performance of a cloud datacenter. By classifying applications according to their attributes and assigning them to VMs with corresponding resources, crucial parameters such as energy consumption, VM migrations, SLA violation, and host utilization were significantly improved. Seeing the remarkable difference, we further applied another level of matching between VMs and Hosts; expectedly, improvements are more pronounced as compared with the previous configuration which only involves single-level entity matching. The result of the initial experiment brings us to a decision to indeed utilize the configuration for two-level entity matching in the final performance evaluation, hence we call it TAbM.
Table 3. Effect of entity (App/VM/Host) matching.
Metric Matching Without Matching 1-level Matching 2-level
Energy Consumption
KWh 239.83 237.17 230.87
VM Migrations 12987 9422 9139
SLA Violation% 2.752 2.72 2.525
Host Shutdowns 2198 1784 1778
Matched VM/App/Host 1015 1050 1050
Host OverUtilization 83100 67265 58884
Host Underutilization 37867 36800 37130
Requests Completed 1494 1506 1528
Ave. Host Utilization% 93.93 96.17 95.84
Utilization Excess% 6.03 3.79 4.12
Ave Host Consumption
Wsec 2664.82 2404.88 2614.38
Average MIPS
Allocated to VM % 82.26 83.43 83.11
Average RAM
Allocated to VM % 94.68 92.34 91.88
Average BW Allocated
to VM % 92.5 92.44 92.41
After we derive the best configuration for our proposed scheme, we evaluate its performance
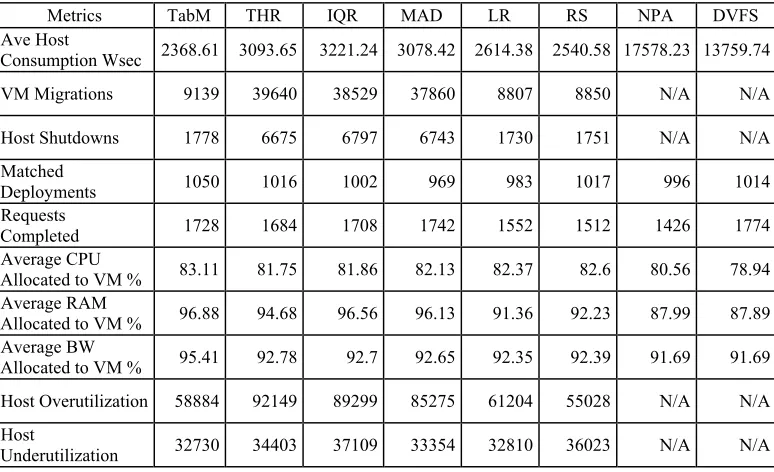
by comparing it with other methods presented in [20]. The methods chosen for comparison are: a) Threshold-Based (THR) approach, which requires setting the upper limit for host utilization and keeping the total CPU utilization below such threshold. b) Inter Quartile Range (IQR), using the given CPU utilization history it measures the dispersion of data which is used to decide on host overloading. c) Median Absolute Deviation (MAD), which uses residuals from the CPU utilization data’s median. The derived value is then used to set the upper utilization threshold for detecting overloaded hosts. d) Local Regression (LR), which builds a trend line that estimates the next observation for the CPU utilization which will decide if a host is overloaded. e) Random Selection (RS), which randomly selects a number of VMs and migrating it to less loaded hosts. f) The Non Power-Aware (NPA) policy, which does not employ energy efficient techniques and assumes 100% CPU host utilization thereby consuming maximum power at any given instance. g) Dynamic Voltage and Frequency Scaling (DVFS), which uses dynamic voltage scaling to reduce the energy consumption of hosts. Methods a to d use the Minimum Migration Time Policy (MMT) policy to select a VM which requires the least time to complete a migration compared to other VMs hosted by the physical server. To better interpret the results, we divide the performance metrics into two groups, the minor metrics and the major metrics. In Table 4, we compare the aforementioned strategies against our proposed approached using the minor metrics. For these metrics however, it should be noted that some are not applicable to NPA and DVFS due to their lack of power-awareness.
510 after serving the requests. As already known, the delays involved in turning on a server has a significant impact on the occurrence of SLA violations in a cloud system. As for the next metric, at 1050 TabM has the most number of Matched Deployments with regards to the Applications, VMs, and Host. This is consistent with the intentions of our proposed consolidation approach which is to consolidate the most appropriate VMs to client requests, and place VMs to Hosts that share the same attributes in terms of compute resources in order to reduce resource excess. Next is the Number of Requests Completed, this refers to the number of client requests that have been fully executed within the given simulation period. As shown, MAD has the most number of completed requests at 1774 while TabM comes at 1728. In the latter discussions, its relation to host utilization will also be tackled. The next metric is the Average Percentage of resource (CPU, RAM, BW) requests that have been completely allocated to the clients. As shown, TabM was able to deliver the highest percentage of compliance to user requests. However, due to the volume of user requests coming into the cloud system and the limitations of the physical hardware itself, the compute requirements of the applications are not always fully allocated upon request. Still, the extents to which requests are met are also an important factor in the efficiency of resource provisioning. The next metric is the number of times Host Overutilization occurred; this refers to the instance where a host gets loaded past its maximum threshold. As shown, RS has the lowest at 55028, TabM comes next with 58884, while THR is the highest with 92149. As for the Host Underutilization, TabM has the lowest number of occurrences at 32730 while IQR has the highest at 37109. In the latter discussion, their relationship with the major performance metrics will be analyzed.
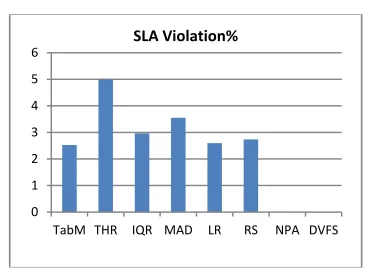
[image:10.612.325.517.98.234.2]Before we go further, we would like to point out that the SLA Violation metric does not apply to NPA and DVFS. This is for the reason that both approaches have no capabilities to dynamically optimize resource allocation, as well as monitoring SLA violations and energy consumption. In Fig. 4 it is shown that TabM has the lowest SLA Violation of about 2.5%, while THR has the highest with 5%. As the result shows, it is consistent with the outcomes of VM Migrations, Host Shutdowns, and Host Overutilization in Table 4. This shows that effectively handling the occurrences of those three events would result to a lower SLA Violation rate and higher QoS.
Fig. 4. Comparison of SLA Violation rate
We show in Fig. 5 the comparison in terms of Energy Consumption. As expected NPA has the highest energy consumption, while TabM has the lowest, which conforms to its low Average Host Consumption in Table 4. Moreover, due to its ability to match Apps, VMs, and Hosts in terms of their requirements and attributes, virtual resources are efficiently provisioned; thereby reducing underutilization and minimizing resource excess, which leads to a fewer number of active servers.
Fig. 5. Overall energy consumption.
In Fig. 6, the data center’s Average Utilization level for each of the aforementioned strategies is compared. Looking back at Table 4, the result for TabM agrees with its Number of Requests Completed and Average Percentage of resources allocated to each request. This shows that a higher number of completed requests are an indication that resources are efficiently provisioned, thus keeping the hosts optimally utilized.
0 1 2 3 4 5 6
TabM THR IQR MAD LR RS NPA DVFS
SLA Violation%
0 500 1000 1500
TabM THR IQR MAD LR RS NPA DVFS
[image:10.612.328.506.401.530.2]511 Fig. 6. Average utilization of hosts.
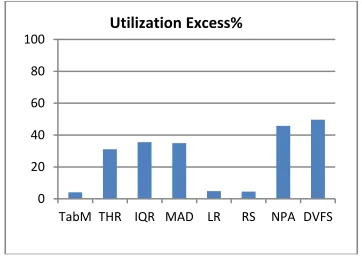
Shown in Fig. 7 is the result for the Utilization Excess. This metric refers to the average percentage of resources that are considered excess once the host’s utilization level reaches the maximum and can no longer accommodate incoming requests. In the figure, TabM has the lowest percentage of excess resource whereas DVFS has the highest. Looking at TabM, it is consistent with the result for its Host Overutilization and Host Underutilization which means that compute resources are efficiently utilized with regards to the minimum and maximum thresholds.
Fig. 7. Average utilization excess.
Shown in Fig. 7 is the result for the Utilization Excess. This metric refers to the average percentage of resources that are considered excess once the host’s utilization level reaches the maximum and can no longer accommodate incoming requests. In the figure, TabM has the lowest percentage of excess resource whereas DVFS has the highest. Looking at TabM, it is consistent with the result for its Host Overutilization and Host Underutilization which means that compute resources are efficiently utilized with regards to the minimum and maximum thresholds.
5. CONCLUSIONS
Being the core of a cloud infrastructure, the performance of a data center directly affects the quality of service provided to the clients. These facts make it a basic research issue, which is to increase the resource utilization, decrease the excess resources, and to improve the performance of a data center while at the same time keeping the energy consumption at its most efficient. In this work, we emphasized the importance of VM Assignment and VM Placement, and their influence in the efficient consolidation of virtualized resources in a cloud data center. Although hotspot mitigation is also addressed by our proposed solution in general, we put emphasis on the resource provisioning approach that we presented on this paper. As opposed to the common practice of resource provisioning and load balancing which are primarily based on CPU utilization, we present a multi-dimensional approach which considers all of the compute resources available. The approach enabled the classification of entities according to their attributes which leads to better accommodation of requests, VM consolidation, and Host assignment. Furthermore, the classification procedure also allowed us to perform a matching strategy which designates application requests to the most appropriate VM for execution and also deploying the VMs to hosts of the same characteristics based on their resource requirements. Based on the results, we are able validate the realization of our objectives by comparing our work, TabM, to other previously-proposed approaches using a number of performance metrics. In terms of SLA Violation rate, TabM is able to outperform its counterparts which also conform to its number of VM Migrations, Host Shutdown, and Host Overutilization. It also had the lowest overall Energy Consumption as supported by its low Average Host Consumption. With regards to the Average Utilization of the entire data center, it also coincides with the number of Completed Requests and the Average Percentage of allocated resources to client requests. Finally, we are also able to minimize the amount of idle resources by keeping TabM’s Utilization Excess the lowest among other approaches. Putting it altogether, it is indeed important to employ an excellent approach for provisioning virtualized resources. By doing so, efficiency in cloud data centers can be achieved which leads to improved performance and lower energy consumption.
0 20 40 60 80 100
TabM THR IQR MAD LR RS NPA DVFS
Average Utilization%
0 20 40 60 80 100
TabM THR IQR MAD LR RS NPA DVFS
[image:11.612.104.285.413.543.2]512 ACKNOWLEDGEMENTS
This research is partially supported by Institute of Information and Telecommunication Technology of KNU
REFERENCES
[1] A. Greenberg, J. Hamilton, D.A. Maltz, P. Patel, “The cost of a cloud: research problems in data center networks”, ACM SIGCOMM Computer Communication Review, 2009, pp. 68–73 [2] “World Energy Outlook 2009 FACT SHEET”,
http://www.iea.org/weo/docs/weo2009/factsheet sWEO2009.pdf.
[3] A. Greenberg, J. Hamilton, D.A. Maltz, and P. Patel, “The Cost of a Cloud: Research Problems in Data Center Networks,” Proc. ACM SIGCOMM Computer Comm. Rev., vol. 39, 2009, pp.68-73.
[4] A. Khosravi, S. Garg, and R. Buyya, “Energy and Carbon-Efficient Placement of Virtual Machines in Distributed Cloud Data Centers,” Proc. 19th Int’l Conf. Parallel Processing (Euro-Par ’13), 2013.
[5] R. Bianchini, R. Rajamony, “Power and energy management for server systems”, IEEE Computer, vol. 37, no. 11, 2004, pp. 68–74. [6] W. Vogels, “Beyond server consolidation”,
ACM Queue, vol. 6, no. 1, 2008, pp. 20–26. [7] C. Hyser, B. McKee, R. Gardner, B.J. Watson,
Autonomic virtual machine placement in the data center, February 2008, HP Labs Technical Report.
[8] X. Meng, V. Pappas, L. Zhang, “Improving the scalability of date center networks with traffic-aware virtual machine placement”, in: Proc. the 29th Conference on Computer Communications, INFOCOM, 2010.
[9] J.T. Piao, J. Yan, “A network-aware virtual machine placement and migration approach in cloud computting”, in: Proc. of 9th International Conference on Grid and Cloud Computing, GCC, 2010.
[10] A.V. Do, J. Chen, C. Wang, Y.C. Lee, A.Y. Zomaya, B.B. Zhou, “Profiling applications for virtual machine placement in clouds”, in: Proc. the 2nd International Conference on Cloud Computing, GRIDs, and Virtualization, 2011. [11] S. H. Wang; Huang, P.P.-W.; Wen, C.H.-P.;
Li-Chun Wang, "EQVMP: Energy-efficient and QoS-aware virtual machine placement for
software defined datacenter networks," Information Networking (ICOIN),
2014 International Conference on , February 2014, pp.220-225.
[12] D. Carrera, M. Steinder, and I. Whalley, “Autonomic Placement of Mixed Batch and Transactional Workloads,” IEEE Transactions on Parallel and Distributed Systems, vol. 23, no. 2, 2012, pp. 219–231.
[13] F. Wuhib, R. Stadler, and H. Lindgren, “Dynamic resource allocation with management objectives: Implementation for an OpenStack cloud,” in CNSM’12, 2012, pp. 309–315.
[14] L. Liu, H. Wang, X. Liu, X. Jin, W. He, Q. Wang, Y. Chen, “GreenCloud: a new architecture for green data center, in: 6th International Conference Industry Session on Autonomic Computing and Communications Industry, 2009, pp. 29–38.
[15] F. Farahnakian, P. Liljeberg, T. Pahikkala, J. Plosila, H. Tenhunen, "Hierarchical VM Management Architecture for Cloud Data Centers," Cloud Computing Technology and Science (CloudCom), 2014 IEEE 6th International Conference on , December 2014, pp.306-311.
[16] R.N. Calheiros, R. Ranjan, A. Beloglazov, C.A.F.D. Rose, R. Buyya, “CloudSim: a toolkit for modeling and simulation of Cloud computing environments and evaluation of resource provisioning algorithms”, Software: Practice and Experience, 2011, pp. 23–50. [17] Google App Engine Frontend Instance Class
[Online]. Available:
https://cloud.google.com/appengine/docs/admin console/instances, Accessed: 15:42:20
20/01/2016
[18] Amazon EC2 Instance Types [Online]. Available: http://aws.amazon.com/ec2/instance-types/
[19] L. Minas, B. Ellison, “Energy Efficiency for Information Technology: How to Reduce Power Consumption in Servers and Data Centers”. Intel Press: Hillsboro.
[20] A. Beloglazov and R. Buyya, "Optimal Online Deterministic Algorithms and Adaptive Heuristics for Energy and Performance Efficient Dynamic Consolidation of Virtual Machines in Cloud Data Centers", Concurrency and Computation: Practice and Experience (CCPE), John Wiley & Sons, Ltd, 2012, pp. 1397-1420.
[21] Standard Performance Evaluation Corporation [Online]. Available:
513 APPENDIX:
Fig. 1. The resource consolidation approach.
Table 4. Comparison of minor performance metrics.
Metrics TabM THR IQR MAD LR RS NPA DVFS Ave Host
Consumption Wsec 2368.61 3093.65 3221.24 3078.42 2614.38 2540.58 17578.23 13759.74
VM Migrations 9139 39640 38529 37860 8807 8850 N/A N/A
Host Shutdowns 1778 6675 6797 6743 1730 1751 N/A N/A
Matched
Deployments 1050 1016 1002 969 983 1017 996 1014 Requests
Completed 1728 1684 1708 1742 1552 1512 1426 1774 Average CPU
Allocated to VM % 83.11 81.75 81.86 82.13 82.37 82.6 80.56 78.94 Average RAM
Allocated to VM % 96.88 94.68 96.56 96.13 91.36 92.23 87.99 87.89 Average BW
Allocated to VM % 95.41 92.78 92.7 92.65 92.35 92.39 91.69 91.69
Host Overutilization 58884 92149 89299 85275 61204 55028 N/A N/A
Host
[image:13.612.113.500.398.634.2]