ISSN: 1992-8645 www.jatit.org E-ISSN: 1817-3195
3597
ESTIMATION OF THE SUCCESS OF BITCOIN AS
CRYPTOCURRENCY
Jesús Álvarez Cedillo1, a, Teodoro Álvarez Sánchez2, b, Mario Aguilar Fernandez1, c, Raul Jr.
Sandoval Gomez1, d , Andrés Calvillo Téllez2, e
1Instituto Politécnico Nacional, UPIICSA, Av. Te 950, Granjas México, Ciudad de México, MÉXICO 2Instituto Politécnico Nacional, CITEDI, Instituto Politécnico Nacional 500, Tijuana, B.C., MÉXICO
E-mail: a[email protected], b[email protected], c[email protected], d[email protected], e[email protected]
ABSTRACT
Bitcoin is a currency and a digital system. As currency serves for everything that any currency serves, without belonging to a government entity that issues and supports it, is based entirely on the digital system that was designed by its creator, Satoshi Nakamoto. The Bitcoin does not belong to any country or government; and since its creator is anonymous and decided that his invention was a free license, it does not belong to any individual or private company. Also, those who keep their platform running are the users themselves. Investing in bitcoins is precisely the same as making investments with other currencies; the principles are basic: buy cheap and sell expensive and with it is possible to obtain again, but in the case of digital currency there are important considerations because it is a virtual currency. The first of these is its volatility.
The price of a bitcoin fluctuates several times during the day in greater magnitude than other currencies or stocks, which is a risk for most, but an opportunity for speculators who know their markets. In this work, an estimation of the success of this cryptocurrency was made in the next ten years. A complete mathematical analysis is shown based on time series.
Keywords: Bitcoin, Financial System, Micropayments, Cryptocurrencies, Economic Forecasts
1. INTRODUCTION
Money is considered as an instrument of economic organization. It differs from the traditional means of exchange in that it does not need to coincide with the individual and immediate needs of the exchange partner, due to its widespread acceptance, money allows exchanging goods or services in greater or lesser quantity. It results in a more developed, robust, more accepted and cheap trade [1].
From an economic abstraction, any item used as money acquires three primary functions: it has to function as a medium of exchange, a reserve of value and a unit of account [2].
The most important function of money is that it facilitates transactions to meet the needs and desires of the person who owns it; this functional nature depends on its widespread acceptance between the parties in a transaction [3].
Currently, according to Invest.com, more than 500,000 companies worldwide accept bitcoins. Among them are huge companies such as Dell, Google, Microsoft and even the Expedia travel agency. However, the situation of the principal online retailers (1000), only 10% accept bitcoins [4].
Bitcoins are accepted for daily business activity. For example, in the so-called "Bitcoin-Kiez" which is used in the city of Kreuzberg in Berlin, it has 40 retail stores and small companies that accept bitcoins as a means of payment for goods and services [5].
3598 Bitcoins incorporate value as long as there continues to be a continuous demand. The literature shows how it has been developed since November 2013, and the exchange value of bitcoins towards the US dollar has always exceeded USD 150 [1][2][3].
In December 2017, the value of Bitcoin reached a maximum, more than 19,000 US dollars [6].
It is also used as an accounting unit since it provides a common denominator to designate the prices of the goods or services that are exchanged. The value of each good and service can be expressed in terms of a monetary unit, that is, a national monetary unit such as the euro or the US dollar.
The Bitcoin system also provides a nominal unit (BTC) that can be used to quantify the values of goods or services and make them comparable. However, the value of a Bitcoin unit is more volatile than virtually any other currency authorized by the state [1][4].
Currently, it is not possible to say if and to what extent the acceptance of bitcoins or other virtual currencies will increase in the future. However, we will try in this work to show the perspective and its tendency.
Empirical data indicate that, in most cases, bitcoins are used to acquire investment assets rather than as a means for transactions in goods and services. As the supply of bitcoins is not subject to the control of a central authority and the possible number of units in circulation is limited to approximately 21 million, bitcoins and other virtual currencies could offer an alternative to the conventional banking systems sanctioned by the state [7].
Very similar to gold, bitcoins get their value from the fact that they are not reproducible in unlimited quantities but, unlike physical items, they offer most of the cost and flexibility advantages of using non-payment methods [8].
According to Bloomberg, Bitcoin shot up 79% since the beginning of 2016 to more than 778 US dollars, its highest level since the beginning of 2014. That is four times the advance registered by the level
reached by the Russian ruble and the Brazilian real [10][11].
After its creation in 2008, world economists praised Bitcoin for the largest and most influential cryptosystem in currency markets, an apparent monetary evolution in an increasingly digital world [12].
However, by 2014, its value had collapsed 58% as governments limited their use and one for that modus the bag lost funds. There are some reasons for this currency to be reborn now, from capital controls in places like China, the United Kingdom and the United States [13].
This article analyses the behaviour of the financial system worldwide and its impact on the market through a new economy called Bitcoin, where an online market prevails, and transactions are innumerable, euros are accepted as currency, American dollars, Russian rubles and the yen in various internet sites [14].
Beginning in the 1980s, within the framework of the new accumulation regime, a financial globalization was detonated that gave rise to deregulation, capital liberalization, and exchange among nations, which greatly exceeded the borders of developed countries, given that the Opening up to capital inflows was a powerful incentive to reform the financial systems of developing countries [15]. See Figure 1.
ISSN: 1992-8645 www.jatit.org E-ISSN: 1817-3195
[image:3.612.89.298.76.329.2]3599 Fig. 1. Bitcoin History.
The basic argument that this paper considers is that in the changing world of globalisation, the money markets change structure and operation, change and adopt new financial products, because of: a) 1. An increase in international competition; b) 2. The increase in risk inherent in credit
operations;
c) 3. The tendency to release the regulations that are imposed on financial systems.
Financial liberalisation has contributed to the rapid growth of credit, which in turn has generated vulnerability in the financial system and if regulatory oversight is not appropriate to address the problems created by credit booms, regardless of whether the system is well designed or not [17] [18].
If it is applied effectively, it will be possible for instability to occur in the financial system: banking panic; effects of a monetary contraction (the fear that means of payment cannot be obtained at any price).
Therefore, it is considered that financial globalisation is an irreversible phenomenon linked to the new information technology, whose impact on the economy is favourable, due to the opening and financial liberalisation [19] [20].
This, of course, has to do with the new structure of the International Financial System through the
global economic integration that began in 1944 with the birth of the Bretton Woods institutions: The International Monetary Fund (IMF) and the World Bank (WB), since the world trade and capital flows were restored, generating a greater interdependence among the economies of the world [21] [22].
In Mexico, the financial system in the 1990s began with a deregulated banking system, a highly concentrated commercial bank that did not fulfil the functions of generating financing for productive investment or offering effective deposit rates to savers.
It this was presented from the North American Free Trade Agreement (NAFTA), foreseeing as a strategy that of associating with foreign intermediaries up to 30% of the share capital, as established by the Law on Credit Institutions [23].
In the case of Mexico, the signing of NAFTA, the application of this model has led to the reduction of real wages, the appreciation of the exchange rate and the opening to competition of imports favouring, the real cheapening of the exchange rate [24].
Currently, Cryptocurrency is a digital strategy designed to function as a means of exchanging goods using cryptography to secure transactions and control the creation of additional units of currency [15].
Money issued by the central bank of a State is recognised as a currency. In some cases, a group of nations can use a common currency; for example, the monetary unit of the European Union (euro). Its value is that this currency is generally accepted in the exchange of goods or to settle accounts, not because of its value in itself, but because it provides the possibility of acquiring others in exchange for it.
3600 Although historically, the currency emerged with the division of labour between production and trade. Through the currency exchanges stopped being made by barter. The first coins took very different forms: livestock, cereals, spices.
The need to have an easily transportable and divisible currency quickly imposed the use of metal.
2. DEVELOPING
For the realisation of this research, the linear regression model was used. Regression is the set of techniques used to explore and quantify the dependency relationship between a quantitative variable called a dependent variable or response, and one or more independent variables called predictor variables.
The first step to determine whether or not there may be dependency/relationship between variables is to graphically represent the observed pairs of values through a point cloud, which is known as a scatter plot (SPSS, 2007).
Once the data is represented and after detecting that between two or more variables there is a relation, the next step would be to try to model this relationship.
The most straightforward statistical modelling to express the dependent variable through its predictor variables is through a linear equation (1).
𝑌 𝛽 𝛽 𝑋 ⋯ 𝛽 𝑋 𝑌 𝛽
𝛽 𝑋 ⋯ 𝛽 𝑋 (1)
The simplest case for a single variable would be a line Y = mx + n, and it is called simple linear regression. When 𝑘 1𝑘 1 is called multiple regression.
To these data, the Pearson correlation coefficient was calculated to determine the linear relationship between the two variables, because it requires that the variables be quantitative and that the two variables be distributed normally.
The result of this correlation was 0.6971604, which indicates that there are a positive correlation and a direct relationship between the variables
In this research, the simple Linear and Bayesian statistics were performed, in order to be able to relate and compare our data of each prediction to make it more accurate.
3. SIMPLE LINEAR REGRESSION
The simplest regression model case is the construction of a line that defines the relationship between the response variable, Y, and the predictor variable X. The model is shown in expression (2).
𝑌 𝛽 𝛽 𝑋 𝑒 (2)
where 𝛽 and 𝛽 are known as regression coefficients and are, respectively, the ordinate at the origin (the cut-off point with the y-axis) and the slope of the regression model line.
In the equation e is the random error, it represents the difference between the value adjusted by the line and the real value. It reflects the absence of absolute dependence between the variables; the relationship is subject to uncertainty.
The simple linear regression model has the structure shown in equation (3).
𝑦 𝛽 𝛽 𝑥 𝑒 (3)
for 𝑖 1, . . . , 𝑛𝑖 1, . . . , 𝑛.
After the adjustment made of a regression line to a data set, and let (xi, yi) be any point. Then yi can be in (4).
𝑦 𝑓 𝑦 𝑒 𝑦 𝑒 (4)
ISSN: 1992-8645 www.jatit.org E-ISSN: 1817-3195
3601 Given the characteristics of our acquired data, it is possible to apply the least squares method, where the general procedure consists of estimating the regression coefficients 𝛽 y 𝛽 to obtain the
line 𝑦 𝛽 𝛽 𝑥
When any line is adjusted in a data set, it is possible to find the existence of small differences between the values estimated by the line and the real values, which produces a random error 𝑒 𝑦
𝑦.
If all the residuals are added to obtain an estimate of the total error, the data when adding positive and negative differences can be cancelled. Try to solve this problem, the differences are squared (Ferrari & Head, 2010).
Therefore, with the least squares criterion, the regression coefficients 𝛽 and 𝛽, are estimated, minimising the sum of the squares of the residuals. This general equation is shown in (5).
𝑀𝑖𝑛𝑖𝑚𝑎𝑙 ∑ 𝑒 𝑖
∑ 𝑦 𝑦 ∑ 𝑦 𝛽 𝛽 𝑥 (5)
Our first step is to apply the Shapiro-Wilk test, to obtain the contrast of the normality of a data set. It is proposed as a null hypothesis that a sample
𝑥1, . . . , 𝑥𝑛 comes from a normally distributed
population. Equation (6) shows its calculation.
𝑤 ∑∑ (6)
Where 𝑥 (with the subscript i in parentheses) is the number that occupies the ith position in the sample and 𝑥 is the simple mean.
Since the null hypothesis is that the population is normally distributed, if the p-value is less than alpha (level of significance) then the null hypothesis is rejected (it is concluded that the data do not come from a normal distribution).
If the p-value is more excellent than alpha, the hypothesis is not rejected, and it is concluded that the data follow a normal distribution.
We have a regression model with the ability to relate the predictor variable and the dependent variable.
We can use it now to predict future events of the dependent variable through new values of the predictor variable.
For this, one of the following conditions must be verified:
1. The value of the predictor is within the range of the original variable.
2. If the value of the predictor is outside the range of the original, must ensure that future values will maintain the proposed linear model.
4. RESULTS
The results shown correspond to the simple regression analysis of three parameters:
1. Historical of its Price;
2. Historical Market Capacity;
3. Historical of transaction volume.
All the historical data were obtained from Blockchain (https://blockchain.info); these data have bi-monthly information.
The data obtained has the Bitcoin price estimate from its birth to May 2017. Figure 2 shows the critical history of its Price, Figure 3 — the history of Market Capacity and Figure 4, the historical volume of transactions.
Our first step is to apply the Shapiro-Wilk test, to obtain the contrast of the normality of a data set. It is proposed as a null hypothesis that a sample
x1, . . . , xn comes from a normally distributed
3602
Fig. 2. Bitcoin price history.
Fig. 3. Historical Bitcoin Market Capacity.
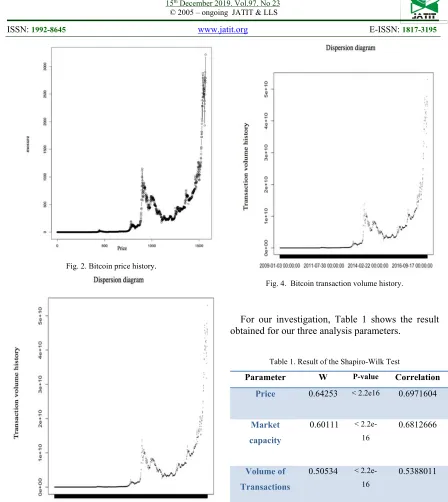
[image:6.612.83.531.49.551.2]Fig. 4. Bitcoin transaction volume history.
[image:6.612.316.534.418.563.2]For our investigation, Table 1 shows the result obtained for our three analysis parameters.
Table 1. Result of the Shapiro-Wilk Test
Parameter W P-value Correlation
Price 0.64253 < 2.2e16 0.6971604
Market capacity
0.60111 < 2.2e-16
0.6812666
Volume of Transactions
0.50534 < 2.2e-16
0.5388011
Once we saw that there is a relationship between the variables, the model was adjusted.
ISSN: 1992-8645 www.jatit.org E-ISSN: 1817-3195
[image:7.612.88.298.92.291.2]3603 Table 2. Residuals obtained
Waste
Variabl e
Min 1Q Media
n
3Q Max
Price
-1135.1 2
-248.22
41.12 253.56 488.58
Market capacity
-6.316e
+09 -3.413e
+09 -9.700e
+08
1.903e +09
3.951e +10
Volume of Transac
tions -39296
679 -15331
640 -60334
63 68958
62
38411 6837
Table 2 shows the difference between the experimental values and adjusted by the model.
Tables 3, 4 and 5 show the correlation of the coefficients obtained from the regression for their behaviour in Price, Market Capacity and volume of transactions.
Table 3. Correlation of the Coefficients obtained from the price regression
Coefficients Estimated Standard
error value t- Pr(>|t|)
Intersection
-283.19848
17.41464
-16.26
<2e-16
[image:7.612.314.522.112.197.2]X 0.73968 0.01922 38.49 <2e-16
Table 4. Correlation of the Coefficients obtained from the regression in Market Capacity.
Coefficients Estimated Standard error
t-value
Pr(>|t|)
Intersection -17146751 1602918
-10.70
<2e-16
X 44922 1780 25.24 <2e-16
Table 5. Correlation of the Coefficients obtained from the regression in the volume of transactions. Coefficients Estimated Standard
error t-value
Pr(>|t|)
Intersection 589.54972 9.64709 61.11 <2e-16
x 0.65708 0.01707 38.49 <2e-16
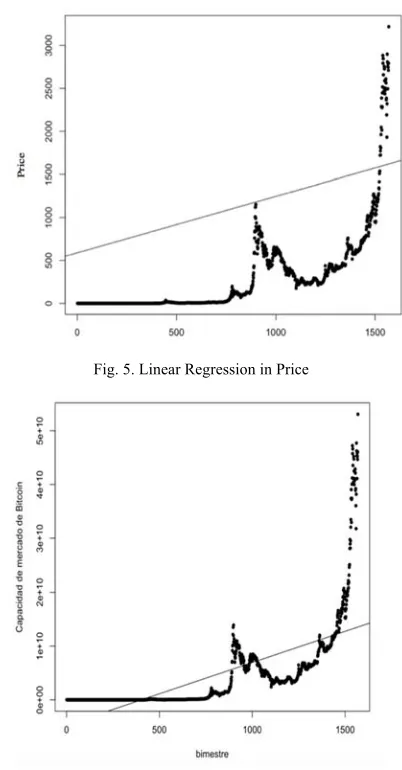
[image:7.612.317.518.330.715.2]Tables 3, 4 and 5 show the estimates of the model coefficients are provided together with their standard deviations ('standard error'), at-value and the probability of the null hypothesis that the coefficients have a value of zero. In this case, for example, there is evidence that both coefficients are significantly different from zero. Figure 5, 6 and 7 shows the result of the linear regression for the three parameters analysed.
Fig. 5. Linear Regression in Price
[image:7.612.115.513.332.717.2]3604 Fig. 7. Linear Regression in transaction volume
The adjustment intervals specify the calculation of confidence or prediction intervals (tolerance) at the specified level, sometimes referred to as narrow versus wide intervals.
The prediction intervals are for a single observation in each case, the data used for the adjustment with variance, the estimated value of σ2.
The default is to assume that future observations have the same error variance as those used for the adjustment.
[image:8.612.94.528.67.267.2]Tables 6, 7, and 8 show the prediction values of the model proposed for each parameter.
Table 6. Prediction values for the price
N Adjustment Low High
1 -282.4588 -959.5146 394.5970
2 -281.7191 -958.7732 395.3350
3 -280.9794 -958.0319 396.0730
4 -280.2398 -957.2906 396.8111
5 -279.5001 -956.5493 397.5491
[image:8.612.325.520.410.624.2]6 -278.7604 -955.8080 398.2872
Table 7. Prediction values for market capacity
N Adjustment Low High
1 -4686386643 -15814929097 6442155811
2 -4674751330 -15803266763 6453764104
3 -4663116016 -15791604464 6465372432
4 -4651480703 -15779942200 6476980794
5 -4639845389 -15768279969 6488589191
6 -4628210076 -15756617774 6500197622
Table 8. Prediction values for transaction volume
N Adjustment Low High
1 -17101830 -79222651 45018992
2 -17056908 -79177576 45063760
3 -17011986 -79132502 45108529
4 -16967065 -79087428 45153298
5 -16922143 -79042355 45198068
6 -16877222 -78997281 45242837
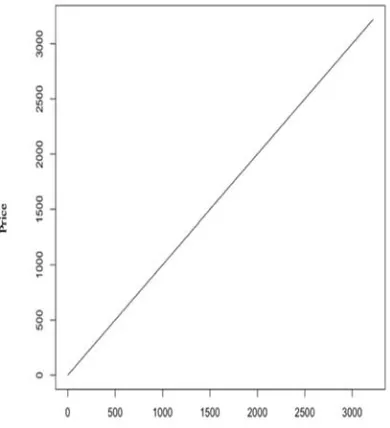
Figure 7, 8 and 9 show the final prediction of each parameter.
The next step is to predict the values for later periods, in this case, they are bi-monthly and to cover the ten years proposed we are talking about six reports per year, 60 in total.
The estimated prediction produces the values obtained by evaluating the regression function within the framework of the defined model; the standard errors of the predictions were calculated.
[image:8.612.91.299.500.604.2] [image:8.612.90.299.638.729.2]ISSN: 1992-8645 www.jatit.org E-ISSN: 1817-3195
[image:9.612.94.295.344.582.2]3605 Fig. 8. Future Observations on Market Capacity
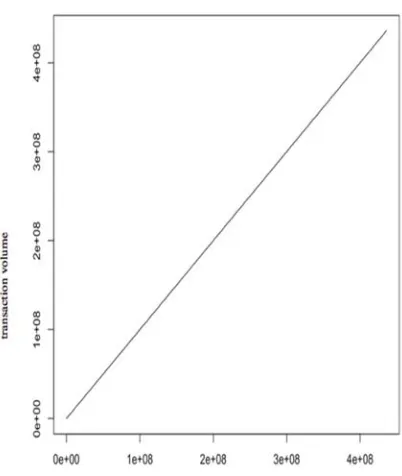
Fig. 9. Future observations in transaction volume
5 CONCLUSION
Once we finished our research on the Bitcoin world and realised our project to take advantage of the energetic waste that the Bitcoin miners produce when mining, we will present the conclusions that we have reached after carrying out the work:
1. The Bitcoin network is secure and reliable, it has never been hacked and never stopped working each day of the year.
2. Bitcoin being a great achievement since the Visa payment network was without service 8 hours in Europe.
3. Bitcoin does not need third-party intermediaries such as state institutions or private financial agents, thus reducing the costs of international transfers.
4. After the surveys made in this blog, we have been able to observe that the Bitcoin is not entirely known, which influences that it is more or less used. This ignorance produces distrust and therefore leads to a little use of a cryptocurrency that is expanding.
5. Also through the surveys, we can see that after receiving the necessary information about this virtual currency, most of the voters would be willing to use it, so that a more excellent knowledge of it could launch its expansion and use.
6. Although the governments do not finish accepting it, in Spain, there are already several ATMs that allow access to the Bitcoin wallet, which makes this currency more and more accessible.
7. After carrying out a study on the viability of our project, we estimate that in 9 months there would be complete amortisation of the mining equipment (Antminer S7 + PSU Corsair 1200w) and from there, an income would be received with the current difficulty of approximately 6-7. Dollars / Day (to which you would have to discount the electricity cost) with the added benefit of free heating.
8. On the other hand, if the price of Bitcoin had remained above 425 Dollars / Btc, the machinery would have been amortised in the six months under study, there could even have been a benefit in this period as the price of Bitcoin exceeded 450 euros.
3606 produced by the miner and the saving of heating that this entails, added to the production of the miner offers a more than obvious benefit.
10. Not only do we save money, but we also save energy by using the waste as heating, contributing to a certain extent with the environment.
11. The installation of the project in homes is straightforward and convenient, so it should not worry about looking for a secluded site or with specific conditions since all it needs is a connection to the electricity and Internet.
ACKNOWLEDGEMENT
We appreciate the facilities granted to carry out this work to the Instituto Politécnico Nacional through the Secretariat of Research and Postgraduate Studies with the SIP 20194986, 20195024, the Interdisciplinary Unit of Engineering and Administrative and Social Sciences, Center for Innovation and Technological Development and Digital Technology Research and Development Center.
Likewise, to the Program of Stimulus to the Performance of the Researchers (EDI) and the Program of Stimulus to the Teaching Performance (EDD).
REFERENCES:
[1] Barnes, S. (2008). Money. In Engineering a High-Tech Business: Entrepreneurial
Experiences And Insights.
https://doi.org/10.1117/3.786604.ch3
[2] Vohs, K. D., Mead, N. L., & Goode, M. R. (2006). The psychological consequences of
money. Science.
https://doi.org/10.1126/science.1132491 [3] Back, "Hashcash - a denial of service
counter-measure,"http://www.hashcash.org/papers/hash cash.pdf, 2002.
[4] Asuman Sönmez, Digital Currency Bitcoin, Turkish Online Journal of Design, Art and Communication, 2014
[5] Wright, C. S. (2019). Bitcoin: A Peer-to-Peer Electronic Cash System. SSRN Electronic Journal. https://doi.org/10.2139/ssrn.3440802
[6] Benjamin Geva - Bitcoin and Mobile Payments - 2016Mobile Payments and Bitcoin: Concluding Reflections on the Digital Upheaval in Payments.
[7] Grinberg, R., Primer, B., Ecosystem, B., Sustainable, I. B., & Issues, L. (2012). Bitcoin: an innovative alternative digital currency. Hastings Sci. & Tech. LJ.
[8] Hobson, D. (2013). What is Bitcoin? XRDS: Crossroads, The ACM Magazine for Students. https://doi.org/10.1145/2510124
[9] Meiklejohn, S., Pomarole, M., Jordan, G., Levchenko, K., McCoy, D., Voelker, G. M., & Savage, S. (2016). A fistful of Bitcoins: Characterizing payments among men with no names. Communications of the ACM. https://doi.org/10.1145/2896384
[10] Decker, C., Seidel, J., & Wattenhofer, R. (2016). Bitcoin meets strong consistency. ACM International Conference Proceeding Series. https://doi.org/10.1145/2833312.2833321 [11] D. Bayer, S. Haber, W.S. Stornetta, "Improving
the efficiency and reliability of digital time-stamping, “In Sequences II: Methods in Communication, Security and Computer Science, pages 329-334, 1993.
[12] Urquhart, A. (2016). The inefficiency of
Bitcoin. Economics Letters.
https://doi.org/10.1016/j.econlet.2016.09.019 [13] H. Massias, X.S. Avila, and J.-J. Quisquater,
"Design of a secure timestamping service with minimal trust requirements," In 20th Symposium on Information Theory in the Benelux, May 1999.
[14] Jeremiah Bohr-Masooda Bashir, Who Uses Bitcoin? An Exploration of the Bitcoin Community, 2014.
[15] Joshua Hendrickson-Thomas Hogan-William Luther, The Political Economy of Bitcoin, Economic Inquiry – 2015
[16] Maria Perugini - Bitcoin – Benefits and Risks Petar Čekerevac-Zoran Čekerevac, Fbim Transactions – 2015.
[17] Maria Perugini-Cesare Maioli, Bitcoin: Tra Moneta Virtuale E Commodity Finanziaria (bitcoin: Between Digital Currency and Financial Commodity), Ssrn Electronic Journal 2014ç
[18] Maria Perugini, Bitcoin E Schemi Sequenziali Di Hashing (bitcoin and Sequential Hashing Schemes) Ssrn Electronic Journal – 2015 [19] R.C. Merkle, "Protocols for public key
ISSN: 1992-8645 www.jatit.org E-ISSN: 1817-3195
3607 [20] Robert Kurek, Bitcoin on the Insurance Market,
Studia Oeconomica Posnaniensia, 2015. [21] Rodney Garrtt-Neil Wallace,Bitcoin 1, Bitcoin
2: An Experiment In Privately Issued Outside Monies, Economic Inquiry, 2018.
[22] S. Haber, W.S. Stornetta, "How to time-stamp a digital document," In Journal of Cryptology, vol 3, no2, pages 99-111, 1991.
[23] S. Haber, W.S. Stornetta, "Secure names for bit-strings," In Proceedings of the 4th ACM Conference on Computer and Communications Security, pages 28-35, April 1997.
[24] Stern, P. N., (1980). Grounded Theory Methodology: Its Uses and Processes. doi:10.1111/j.1547-5069.1980.tb01455.x [25] W. Feller, "An introduction to probability