Detection of Oil Spills in SAR Images using Threshold
Segmentation Algorithms
Alaa Sheta
Taif UniversityTaif, Saudi Arabia
Mouhammd Alkasassbeh
Mutah UniversityJordan
Malik Braik
University of BirminghamBirmingham, Edgbaston, UK
Hafsa Abu Ayyash
Al-Balqa Applied UniversitySalt, Jordan
ABSTRACT
Identification of potential oil spills on Synthetic Aperture Radar (SAR) satellite images is a complex process. Oil companies, as well as the coast guard have tested a whole range of methods for monitoring and detection of possible oil spills. These meth-ods are found to be expensive, complex and require high pro-cessing power and time. In this paper, an oil spill detection method is proposed. The method consists of four main stages, namely: 1) Image enhancement; 2) Image segmentation 3) fea-ture extraction; and 4) Object recognition of the segmented ob-jects as oil spills or look-likes. The algorithm was trained on a large number of Synthetic Aperture Radar (SAR) images. The proposed thresholding algorithm can be considered an alterna-tive to manual inspection for large ocean areas. Promising results and high detection rates for the oil spills have been achieved.
General Terms:
Image Processing, Object Recognition
Keywords:
Oil Spill Detection, Thesholding, Segmentationifx
1. INTRODUCTION
[image:1.595.303.557.256.364.2]Petroleum production has been an essential component for the modern industry.Oil is needed in diversity of industrial pro-cesses. Oil has to be transported in seas and oceans. During transportation, oil spills can happen. The major sources of oil spill pollution are mainly due to: Tanker accidents or ballast wa-ter. Once oil is spilled, it quickly spreads to form a thin layer on the water surface, known as an ”oil slick”. Marine oil spill is highly dangerous because of many environmental factors. It can be easily spread over a wide area [10]. Between 1988 and 2000, there were 2,475 spills, which released over 800,000 liters of oil in Toronto and surrounding regions [12]. Over the years, many methods for monitoring and detecting of possible oil spills were tested. Some of these methods include: InfRed (IR) ra-diation, radar, lasers and many types of night-vision schemes. Unluckily, these methods are found to be both expensive, com-plex and require high processing power and time. Nevertheless, they fail to provide promising solutions [2, 13]. Consequently, it is a must to have an efficient technique for monitoring and de-tecting oil spills. Aircraft and ship-based sensors are not fully adequate for sea monitoring and oil spill detection. This is due to the limited coverage and the operational costs [19]. Table 1 shows the largest and recent oil spill in the world [15], containing the Ship/Incident, location, date of the accident and the quantity of spilled oil in tones.
Table 1. Largest and recent oil spill [15]
Ship/Incident Location Date Tones
Gulf War Sea Island, Kuwait Nov 26,91 800000 IXTOC/blowout Gulf of Mexico, Mexico Jun 06,79 470000 Atlantic Empress Caribbean Sea, off Tobago Jul 19, 79 300000 Castillo de Bellver Saldanha Bay, South Africa Aug 08,83 260000 Amoco Cadiz Coast of Brittany, France Mar 06,78 235000 Exxon Valdez Prince William Sound Mar 24,89 39000 Aegean Sea La Coruna, Spain Dec 05,92 75000
Erika Coast of Brittany Dec 12,99 10000
Prestige Coast of Galisia, Spain Nov 19,02 40000
1.1 SAR Images
Nowadays, with the advent of remote-sensing techniques solv-ing oil spill detection and monitorsolv-ing problems ussolv-ing SAR im-ages became very promising [1]. Satellite-borne SAR provides a number of advantages compared to other systems for the detec-tion and monitoring process of oil spills. The SAR images can in-clude almost everything on the earth specifically seas and oceans, no matter of the weather conditions, if it’s windy or cloudy. And it has the capability to take images during the day and the nights also. The SAR images have the ability to detect and distinction between the objects on the sea like it is ships or sea animals or even the oil spills. Most important here in the SAR images is the variance between the foreground and the background of the image itself. The SAR images by itself have difficulties to be fully automatic oil spill’s detection system, so that other add-in needed to complete its work [2]. A fully automated system for the identification of possible oil spills presented on Synthetic Aperture Radar (SAR) satellite images based on fuzzy logic was presented in [11]. The developed system analyzes the satellite images and assigns the probability of a dark image shape to be an oil spill for Aegean Sea in Greece.
The rest of this paper is organized as follows: Section 2 briefly summarizes the main steps in the proposed algorithm, also it pro-vides a flowchart which illustrates each phase of the proposed technique. In Section 3, we describe the image enhancement phase in details; it consists of contrast stretching and Gaussian filtering. Section 4 introduces the detailed procedure of the de-tection phase, and the achieved results for each step. Moreover, four successive steps are combined successively to accomplish this phase; they are: local thresholding, land masking, global thresholding and merging. The spot feature extraction phase is presented in Section 5. Then; we illustrate the spot classification algorithm in Section 6. Finally, Section 7 contains concluding and future work remarks.
2. PROPOSED THRESHOLDING ALGORITHM
Guassian Filtering Contrast Stretching
Masking
Global Thresholding
Masking
Merging Local Thresholding
Spot Feature Extraction
Sopt Classification Oil Spill
Features
Final Stage: Composite Classified
Image First Stage: SAR Image
Database
[image:2.595.84.252.95.268.2]Dark Spot Detection Enhancement
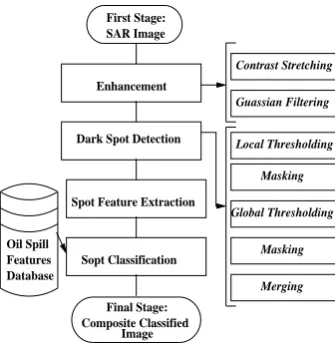
Fig. 1. Proposed Oil Spill Detection Algorithms
based on local and global threshold techniques, while the clas-sification process is implemented in a set of extracted features presented in [2, 4] and fully utilized based on statistical features in the oil spill domain.
The main approach which is used to detect the dark spots, con-sists of local and global threshold techniques. For each dark spot, a number of features have been counted in order to classify the slick as either an oil slick or other possible objects in the sea. The proposed approach detects the dark spots in the images primar-ily using local and global threshold techniques [2, 4]. For each dark spot, a number of features are expressed in order to classify the slick as either an oil slick or a look alike [4]. The proposed threshold algorithm, initially analyzes the SAR images, and then assigns a probability to the dark spot to indicate whether it is an oil spill or look alike.
The entire stages of the proposed algorithm are shown in Figure 1. The algorithm consists of four main phases:
(1) A preprocessing phase which consists of traditional image enhancement methods.
(2) A threshold segmentation algorithm for the detection of pos-sible oil spills.
(3) For each dark spot, a set of features is calculated to classify the slick as either oil slick or look alike.
(4) Finally, a classification criterion is carried out, which sepa-rates oil spills from look alikes. A classification scheme is utilized based on statistical features using the oil spill fea-tures database.
3. IMAGE ENHANCEMENT
[image:2.595.327.522.109.285.2]Reducing the noise and smoothing the image are the most critical steps before applying the segmentation process. Consequently, the natural variations and noise inside the SAR images will dis-turb the segmentation process, which in turn leads to the qual-ity of the segmented images which based on the type of filter that had been used. Adaptive filters based on appropriate scene and speckle model are the most fitting filters for SAR images [18, 16].
In addition, the enhancement methods also used to improve the visual appearance of SAR images in order to obtain the best pos-sible image perception. This can be accomplished by sharpen-ing the image features and increassharpen-ing the contrast of the image [7]. This preprocessing phase must manage the effects of noise and increases the visibility of the image [8]. Moreover, artifi-cial neural network was used to enhance SAR images [21]. Fur-thermore, in the work of [22], an adaptive image enhancement method based on Contourlet transform was used to improve the
50 100 150 200 50
100 150 200
50 100 150 200 50
100 150 200
0 500 1000
Value
Graylevels 0 100 200
0 500 1000
Graylevels
Value
0 100 200
Fig. 2. Upper Left: Input image, Upper right: Contrast stretching image, Lower left: Original histogram, Lower right: Contrast
stretching histogram
quality of the images. The author claimed that their results pro-vided a significant performance even with low contrast.
3.1 Contrast Stretching
Low-contrast images may result from different factors, for ex-ample, the poor illumination of the camera, or the absence of dynamic range in the imaging sensor, or even wrong setting of lens aperture during image acquisition. Contrast stretching is one of the simplest piecewise linear functions [3]. Contrast stretch-ing technique improves the readability of low contrast areas in the SAR image. Figure 2 shows the effect of contrast stretching technique on the SAR image. It can be seen from Figure 2 that the contrast stretching process has two effects:
(1) Increase the dynamic range of the gray levels within the im-age being processed by contrast stretching.
(2) Increase the histogram of the overall intensity of the pro-cessed image, so that the new image appears more obvious than the original SAR image. Also, the processed image his-togram is distributed over a large range when it’s compared to the histogram of the original SAR image.
3.2 Gaussian Filtering
Gaussian filter is proposed for removing the noise as it preserves the structural and textural features, and also can improve the im-age quality for better estimation [18]. Speckles can be reduced, in the intensity images, using the moving kernel which has the shape of the Gaussian hump. The moving window size of the filter is selected as(41×41). The Gaussian filter is defined as given in Equation 1 [8]:
G(x, y) = 1 2πσ2e
−x2 +y2
2σ2 (1)
50 100 150 200 50
100
150
200
0 200 400 600 800 1000 1200
Graylevels
Value
[image:3.595.82.259.102.197.2]0 50 100 150 200 250
Fig. 3. Filtered using Gaussian filter, Right: Histogram of the filtered image
Fig. 4. Local threshold segmented image
the Gaussian filter removes the noise while preserving the details and edges. Consequently, the image enhancement step illustrates the differences between the oil spill objects and the background.
4. DARK SPOT DETECTION
The dark spot detection locates all spots in the SAR image, which represents oil slicks. The oil spills are mainly character-ized by their dark levels with respect to the background. Many phases are developed and add up for the dark spot detection mod-ule as given in the following subsections.
4.1 Local Threshold
It computes a set of low spots in the SAR image to find the bor-ders between the oil slick and the surrounding sea [20]. Local threshold segments the image into two classes:
(1) Class 1: which has the pixels below a predefined threshold value, and
(2) Class 2: which has the pixels above the same threshold value.
This operation is applied to each individual pixel on a local level by computing the local mean value in a window which moves across the image. Figure 4 shows the result of local threshold technique when applied to the smoothed SAR image. The win-dow size in this work is eight connected neighborhood. Although the dark spots are not accurately segmented, the following stages of spot detection are needed in order to complete the detection process.
4.2 Land Masking
[image:3.595.353.506.105.266.2]Land regions involve several dark regions, which may deceive the classification process. This is why; the land mask is an im-portant stage in dark spot detection. Land masking process [17]
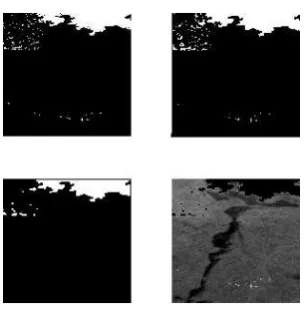
Fig. 5. Upper left: Binary image, Upper right: Closing the image, Lower left: Opening the resulted image, Lower right: The
segmented image
can reduce or may eliminate the dark regions in the image by following the three steps just as given below:
(1) Convert the image to binary using a predefined thresholding level. In this work, the level selected is to be 0.5.
(2) The output binary image has two values0(black) for all pixels in the input image with luminance less than0.5, and
1(white) for all other pixels.
(3) Apply a morphological filter with closing and opening oper-ations.
Morphological operations are ways of extracting image elements like regions, shape, boundaries and so on. A detailed explanation of mathematical morphology operations can be found in [8]. Di-lation and erosion are the two basic morphological operations. The Structure element (S) used in this stage has a size of3×3
as shown in the following matrix:
S=
"0 1 0
1 1 1 0 1 0
#
(2)
Sis a matrix that defines a neighborhood shape and size for mor-phological operations consisting of only 0’s and 1’s.S has an arbitrary shape and size. The pixels with values of 1 define the neighborhood. The results of applying land masking filter are shown in Figure 5.
4.3 Global Thresholding
The first step in the global threshold is to get the image comple-ment, so that the zeros become ones and the ones become zeros; i.e. black and white are reversed. The window addressed at this stage is the entire image. All pixels corresponding to the digi-tal number values less than the threshold value are registered as pixels of dark regions.
[image:3.595.111.226.240.400.2]Fig. 6. Global segmented image
the definedSin the previous stage. Then, the opening operator using the sameSis applied to smooth the contour of the lands’ objects. In sum, tiny protrusions are eliminated from the image.
4.4 Merging
Merging is the finishing stage in the spot detection algorithm. The final spot image is constructed by combining the two im-ages resulted from the land masking and global threshold stim-ages. The segmented objects were controlled over the spot detection problem without losing any small objects in the image. The final segmented image is shown in Figure 6. It can be seen that the proposed algorithm produces the best segmentation of the dark areas, this image includes only the oil spills, which can be used as a prior task to posterior classification.
5. SPOT FEATURE EXTRACTION
Classification accuracies are highly dependent on the feature set selection. In other words, classification accuracy is as good as the feature set that is selected to represent an image. For each dark spot, a set of features are calculated [6]. The dark spots are then classified into either probably oil slicks or other objects based on the extracted features. The extracted features are defined as follows:
(1) The Area of the segmented object represents the number of pixels in the object.
(2) The Max of the segmented object indicates the pixel of the largest value in the object.
(3) Entropy(e)is a measure of randomness [8]. The entropy is defined as given in Equation 3.
e=−
L−1
X
i=0
p(zi) log2p(zi) (3)
whereziis the image intensity,p(z)is the histogram of the intensity levels in a region, andLis the number of possible intensity levels.
(4) Uniformity(U)is also known as Energy, uniformity of en-ergy, or angular second moment. Uniformity measures the maximum gray level when they are equal. The uniformity is defined as given in Equation 4 [8].
U =
L−1
X
i=0
[image:4.595.368.490.103.281.2]p2(zi) (4)
Fig. 7. Final segmented image
(5) Mean(m)measures the average intensity [8]. Mean is de-fined as given in Equation 5.
m=
L−1
X
i=0
zip(zi) (5)
(6) Standard Deviation(σ)measures the average contrast [8]. Standard deviation is defined as given in Equation 6.
σ=pzi−m2= √
σ2 (6)
(7) Skewness(µ3)is known as Third moment, it measures the third order moment about the mean. Skewness is defined as given in Equation 7 [8].
µ3=
L−1
X
i=0
(zi−m)
3
p(zi) (7)
(8) Smoothness (R) measures the relative’s smoothness of the intensity in the region [8]. Smoothness is defined as given in Equation 8.
R= 1−1(1 +σ2) (8)
6. SPOT CLASSIFICATION
Herein, is the final stage of the proposed method, where each segmented object is recognized as an oil spill object or not. This stage helps reducing the false alarm which may be acquired. A group of features have been used as evaluation criteria to detect the type of each object. These features have been tested for a group of segmented oil spill objects. The true locations of the oil spill objects were defined in [7]. In Table 2, its shown the values of each feature of the intensity values of each segmented object. It was found that each feature on the oil spill object has a spe-cific range of intensity values. The range of each feature value and the true location of oil spill objects are compared to the val-ues given in [7]. This range is called anoil spill domain. The extracted features of the oil spill objects were tested based on the true domain. The intensity values of the extracted features are found within the true range as shown in Table 3.
Table 2. Feature intensity values for a group of segmented oil spill objects Object Area Max Ent- Unifo- Skew- Smooth- Std Mean
No. ropy rmity ness ness
1 355 129 5.24 0.1 0.6008 0.0163 32.92 28.76
2 455 129 4.4733 0.19 0.623 0.014 30.4 21.32
3 13318 107 4.688 0.05 0.0306 0.005 18.11 23.66
4 436 131 5.096 0.04 0.3857 0.0129 29.22 34.25
5 1145 75 4.4564 0.049 -0.004 0.0024 12.45 52.21 6 4463 69 4.3693 0.053 -0.0073 0.0019 11.26 46.14 7 632 69 4.3467 0.059 -0.0153 0.0022 11.88 38.88
8 24402 155 4.66 0.07 0.05 0.0058 19.5 22.76
9 1523 73 4.7587 0.04 -0.0348 0.0034 14.82 35.49
10 922 70 4.7905 0.04 -0.0211 0.0031 14.16 35
11 1621 100 3.4009 0.28 0.1167 0.0058 19.45 14.66
12 464 73 4.3137 0.11 0.053 0.0062 20.2 21.65
13 1016 64 4.4412 0.057 -0.0319 0.0024 12.49 41.76
14 552 79 4.79 0.04 -0.0115 0.003 13.88 36.08
15 417 79 4.8664 0.04 0.0033 0.0033 14.61 34.68
16 1023 185 4.9425 0.04 0.0982 0.0046 17.32 30.4 17 1573 87 4.6478 0.05 -0.0091 0.0023 12.14 36.74 18 1371 77 4.6602 0.05 -0.0029 0.0023 12.12 37.96
19 775 85 4.647 0.05 0.0027 0.0023 12.22 39.97
20 342 91 4.6194 0.05 0.0108 0.0025 12.77 41.35
21 841 75 4.357 0.06 -0.0182 0.0019 11 56.86
22 35 52 3.1476 0.21 0.0607 0.0047 17.87 15.17
[image:5.595.98.243.397.495.2]23 73 133 2.7896 0.37 1.5748 0.0272 42.91 27.14
Table 3. Extracted features domain Feature Name Oil Spill Domain
Area (>=35 pixels) Max (52 - 185) pixels Entropy (2.79 - 5.24) Uniformity (0.04 - 0.37)
Skewness (-0.0348 - 1.5748) Smoothness (0.0019 - 0.0272) Standard Deviation (11.00 - 42.91)
Mean (14.66 - 56.86)
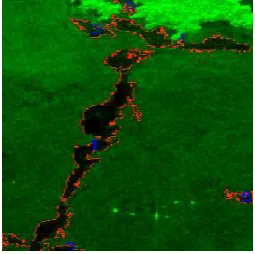
inside the true domain are classified as oil slick. In particular, the oil slicks with feature values out of the true domain are classified as look alikes. In sum, the developed algorithm achieved a high accuracy in true locating of oil spills. Figure 8 shows the precise location, and the distribution of the major detected and identi-fied oil slicks of SAR image. Comparing the segmented image in Figure 7 to the precise location of oil slicks in Figure 8, in this work,it has been found that the proposed method identifies the location of oil spills in the image accurately. Hence, persuasive results and acceptable detection rates are obtained.
7. CONCLUSION AND FUTURE WORKS
An oil spill detection algorithm was implemented based syn-thetic aperture radar images; this algorithm is mainly based on local and global threshold techniques. The presented algorithm can distinguish between oil spills and look alike. Oil spill classi-fication accuracies were highly dependent on the feature set se-lection. The experimental results demonstrate that the proposed segmentation algorithm has the ability to detect oil spills. For future works, speeding up the computation process by using par-allel programming will be taken under consideration. Moreover, another extension of this work will focus on using artificial neu-ral network as a classifier tool instead of using a firmly estab-lished domain.
Fig. 8. True location of oil spill in SAR image of the Prestige tanker oil slick near Galicia [14]
8. ACKNOWLEDGEMENTS
Prof. Alaa Sheta is a full-time faculty member with the Com-puters and Systems Department, Electronics Research Institute (ERI),Cairo,Egypt. He would like to acknowledge ERI.
9. REFERENCES
[1] Hafssa A. AbuAyyash. Improving oil spill detection using remote sensing techniques, m.sc. of computer science. [2] R´egia T. S. Ara´ujo, F´atima N. S. de Medeiros, Rodrigo
C. S. Costa, R´egis C. P. Marques, Rafael B. Moreira, and Jilseph L. Silva. Locating oil spill in SAR images using wavelets and region growing. InIEA/AIE’2004: Proceed-ings of the 17th international conference on Innovations in applied artificial intelligence, pages 1184–1193. Springer Springer Verlag Inc, 2004.
[image:5.595.365.493.405.532.2]image quality.Int. J. Innovative Computing and Applica-tions, 1(2):138–145, 2007.
[4] Lena Chang, Z. S. Tang, S. H. Chang, and Yang-Lang Chang. A region-based GLRT detection of oil spills in SAR images.Pattern Recogn. Lett., 29(14):1915–1923, 2008. [5] I. El-Feghi, N. Adem, M. A. Sid-Ahmed, and M. Ahmadi.
Improved co-occurrence matrix as a feature space for rel-ative entropy-based image thresholding. InProceedings of IEEE Computer Society, pages 314–320. Computer Graph-ics, Imaging and Visualisation, 2007.
[6] F. D. Frate, A. Petrocchi, J. Lichtenegger, and G. Calabresi. Neural networks for oil spill detection using ERS SAR data.IEEE Transaction Geosc. Rem. Sens., 38:2282–2287, 2000.
[7] S. Galicia. Galicia (Spain), November 2002-April 2003. current URL is http://earth.esa.int/ew/oil slicks/galicia, 2008.
[8] R. Gonzalez and R. Woods. Digital Image Processing. Prentice Hall, 3rd Edition, 2008.
[9] R. Gonzalez, R. Woods, and S. Eddins.Digital Image Pro-cessing usingMATLAB. Prentice Hall,2nd Edition, Upper Saddle River, NJ Jensen, 2004.
[10] M. Jha, J. Levy, and Y. Gao. Advanced in remote sens-ing for oil spill disaster management: State of the art sen-sors technology for oil spill surveillance.Sensors Journal, 8(13):236 – 255, 2008.
[11] Iphigenia Keramitsoglou, Constantinos Cartalis, and Chris T. Kiranoudis. Automatic identification of oil spills on satellite images.Environ. Model. Softw., 21(5):640–652, May 2006.
[12] J. Li. Spill management for the toronto AOC. Technical re-port, 2002.
[13] Lin Li, Susan L. Ustin, and Mui Lay. Application of AVIRIS data in detection of oil-induced vegetation stress and cover change at jornada, new mexico.Remote Sensing of Environment, 94(1):1–16, January 2005.
[14] A. Montali, G. Giacinto, M. Migliaccio, and A. Gam-bardella. Supervised pattern classification techniques for oil spill classification in SAR images: Preliminary results. InEuropean Space Agency, pages 123–127. Advances in SAR Oceanography from Envisat and ERS Missions, 2006. [15] J.C. Prados. Chemical dispersants and bioremediation for
the treatment of oil spills. Technical report, 2003. [16] A. Solberg, C. Brekke, E. Volden, and P. Husoy. Oil spill
detection in radarsat and envisat SAR images.IEEE Trans-actions on Geoscience and remote Sensng, 45(3):746–755, 2007.
[17] A. Solberg, T. Dokken, and R. Solberg. Automatic detec-tion of oil spills in envisat, radarsat and ERS SAR im-ages.IEEE Geoscience and Remote Sensing Symposium, 4(3):2747–2749, 2003.
[18] A. H. Solberg, G. Storvik, R. Solberg, and E. Volden. Automatic detection of oil spills in ERS SAR images. In
IEEE Transactions on Geoscience and Remote Sensing, volume 37, pages 1916 – 1924, 1999.
[19] Konstantinos Topouzelis, Karathanassi Vassilia, Pavlakis Petros, and Rokos Demetrius. Potentiality of feed-forward neural networks for classifying dark formations to oil spills and look-alikes. Geocarto International, 24(3):179–191, 2009.
[20] Y. Tsai. A new approach for image thresholding under un-even lighting conditions. InProceedings of the IEEE/ACIS International Conference on Computer and Information Science, 11-13 July, pages 123 – 127. Computer and In-formation Science, 2007.
[21] V. Turkar. Polarimetric sar image classification by using ar-tificial neural network. InProceedings of the International Conference and Workshop on Emerging Trends in Technol-ogy, ICWET ’10, pages 48–52, New York, NY, USA, 2010. ACM.
![Table 1. Largest and recent oil spill [15]](https://thumb-us.123doks.com/thumbv2/123dok_us/8098383.786906/1.595.303.557.256.364/table-largest-and-recent-oil-spill.webp)