TaqMan HCV Test, Version 2.0, for Detection and Quantification of
Hepatitis C Virus RNA
S. Pas,aR. Molenkamp,bJ. Schinkel,bS. Rebers,bC. Copra,aS. Seven-Deniz,aD. Thamke,cR. J. de Knegt,dB. L. Haagmans,a M. Schuttena
Erasmus MC, Department of Virology, Rotterdam, the Netherlandsa; Academic Medical Center, Department of Medical Microbiology, Clinical Virology Laboratory,
Amsterdam, the Netherlandsb; Roche Molecular Diagnostics, Rotkreuz, Switzerlandc; Erasmus MC, Department of Gastroenterology & Hepatology, Rotterdam, the
Netherlandsd
To evaluate the analytical performance and explore the clinical applicability of the new Roche cobas AmpliPrep/cobas TaqMan HCV test, v2.0 (CAP/CTM v2.0), a platform comparison was performed on panels and diagnostic samples with the Roche cobas AmpliPrep/cobas TaqMan HCV test (CAP/CTM v1.0), the Siemens Versant HCV RNA 3.0 branched DNA (bDNA) test, the Ab-bottm2000 RealTime HCV assay (Realtimeassay), and the Siemens Versant HCV transcription-mediated amplification (TMA) test (TMA assay). The analytical performance of the CAP/CTM v2.0 on WHO and Acrometrix panels and clinical specimens of patients infected with HCV genotype 1, 2, 3, 4, 5, or 6 relative to that of the CAP/CTM v1.0 was significantly improved. In a quali-tative comparison of the CAP/CTM v2.0 relative to the TMA assay on genotype 1 to 4 samples, the two tests proved to be almost equally sensitive. Response-guided therapy in one of five HCV genotype 4-infected patients previously tested with the CAP/CTM v1.0 would have significantly changed if tested with the CAP/CTM v2.0. In conclusion, the Roche CAP/CTM v2.0 has signifi-cantly better performance characteristics than the former CAP/CTM HCV v1.0 and the bDNA assay and performance character-istics comparable to those of the Realtimeassay.
H
epatitis C virus (HCV) is a major public health problem and a leading cause of chronic liver disease. An estimated 170 million individuals are infected worldwide. Diagnostic assays for HCV include serological assays for the detection of HCV-specific antibodies and molecular assays aiming at sensitive detection of HCV RNA in plasma or serum. The detection of HCV RNA is important for distinguishing between acute, chronic, and resolved infections. Quantitative and qualitative detection of HCV RNA is furthermore used to determine treatment response.Decision points in the treatment of HCV require both qualita-tive results generated with an assay with a lower limit of detection (LLOD) of at least 15 IU/ml and quantitative results. Due to the increase of global availability of medication and changes of the epidemiology of HCV genotypes in the Western world, these as-says would preferably be equally sensitive for all HCV genotypes (1,2). Current methods for the quantitative detection of HCV RNA include endpoint reverse transcription-PCR (RT-PCR), real-time RT-PCR, the branched DNA (bDNA) method, and, for qualitative results, the transcription-mediated amplification (TMA) method (3–6). Quantitative endpoint RT-PCRs are in-creasingly displaced by real-time RT-PCRs because the latter in general have an increased dynamic range, are less prone to con-tamination, and are easier to automate (7). An alternative to real-time RT-PCR is a combination of testing with bDNA and TMA where the bDNA test is used for quantification before the start of treatment and at weeks 4 and 12 and TMA is used for sensitive qualitative detection at weeks 12 and beyond, although the testing algorithms are more complex than those used for testing with sensitive real-time RT-PCR.
After the introduction of the cobas AmpliPrep/cobas TaqMan HCV test v1.0 (CAP/CTM v1.0), it became apparent that this test, despite its good performance characteristics with most genotype 1
to 3 strains, underquantifies certain genotype 4 strains and a small percentage of patients infected with genotype 1 (5,6,8–10). Re-cently, results obtained with a prototype of a second version of the CAP/CTM HCV test have been described (11), demonstrating that, after the redesign of primers and addition of a second probe, the problem of underquantification of certain genotype 4 HCV strains was solved. This redesign was used for the development of the Roche cobas AmpliPrep/cobas TaqMan HCV test, v2.0 (CAP/ CTM v2.0). We set out to determine the quantitative and qualita-tive detection of HCV by the CAP/CTM HCV v2.0 test relaqualita-tive to its major commercially available competitors.
MATERIALS AND METHODS
Patient samples and test materials.Leftover EDTA plasma samples sent to the diagnostic units of the Department of Virology of the Erasmus MC and the Department of Clinical Microbiology of the Amsterdam Medical Center for HCV diagnostics were used in this study. Written informed consent was obtained from each patient, and the study was approved by the Medical Ethical Committee. In addition, plasma samples previously used in a study to validate the performance of the Siemens Versant HCV Genotype 2.0 Products (LiPA; Siemens Healthcare Diagnostics, Den Haag, the Netherlands) test on HCV genotypes 5 and 6 were included (12). Plasma samples were stored at⫺80°C until use. For platform
com-Received2 July 2012 Returned for modification1 August 2012
Accepted26 October 2012
Published ahead of print14 November 2012
Address correspondence to M. Schutten, [email protected].
S.P. and R.M. contributed equally to this article.
Copyright © 2013, American Society for Microbiology. All Rights Reserved.
doi:10.1128/JCM.01729-12
on May 16, 2020 by guest
http://jcm.asm.org/
parisons, plasma samples were diluted 10 to 200 times with a pool of HCV RNA-negative, RNase-free plasma using a CAS4200 system (Qiagen, Hilden, Germany). Diluted samples were aliquoted into sufficient ali-quots to allow testing on all platforms and stored at⫺80°C until use. Aliquots tested at the Academic Medical Center Amsterdam were sent on dry ice to prevent multiple freeze-thaw cycles. A separate aliquot was used for each test to prevent multiple freeze-thaw cycles. Plasma samples were selected to have an HCV RNA load of between 115 IU/ml and 100,000 IU/ml after dilution. Genotyping was performed with the Siemens Ver-sant HCV Genotype 2.0 Products (LiPA) (Siemens Healthcare Diagnos-tics, the Hague, the Netherlands) test on an Auto-LiPA 48 system (Inno-genetics, Ghent, Belgium) at the Erasmus MC and by sequencing part of NS5B at the Amsterdam Medical Center (13). In order to compare HCV RNA quantifications of the different platforms, internationally recog-nized standards were used: the 2nd WHO international standard (06-100; National Institute for Biological Standards and Control [NIBSC], Potters Bar, United Kingdom) and the Acrometrix HCV genotyping panel (Op-tiqual 1 to 4; Acrometrix, Benicia, CA). After primary analysis of the data, an outlier analysis was performed. Samples that, after retesting or dilu-tion, were below the lower limit of quantification (LLOQ) in all platforms tested were excluded from the analyses. Samples that differed by more than 0.5 log in one platform compared to the other two platforms tested were retested in the platform that differed from the other two. The result of the retest procedure was used in the study.
Quantitative and qualitative HCV RNA assays.In the present study, all testing procedures for the CAP/CTM HCV v1.0 and v2.0 tests (Roche Molecular Diagnostics, Almere, the Netherlands) were performed at the Erasmus MC. The Siemens Versant HCV RNA 3.0 assay (bDNA) (Sie-mens Healthcare Diagnostics, the Hague, the Netherlands), Abbott m2000 RealTime HCV assay (Realtime assay) (Abbott Diagnostics, Hoofddorp, the Netherlands), and Siemens Versant HCV qualitative as-say were performed at the Amsterdam Medical Center. During routine diagnostics, quantitative detection of HCV was performed with the cobas Amplicor HCV Monitor test using the manual High Pure system (HPS/ CA) and qualitative detection was performed with the cobas AmpliPrep/ cobas Amplicor HCV test, version 2.0 (CAP/CA) (Roche Molecular Di-agnostics, Almere, the Netherlands). All assays were performed according to the manufacturer’s instructions as described in the respective package inserts.
Data analysis.Data were analyzed using Microsoft Office Excel 2003 and SigmaPlot for Windows, version 10.0.
RESULTS
Validity of testing procedure.To study whether the dilution pro-cedure and the matrix used to dilute the plasma samples might influence the results of the study, a selection of genotype 1 to 4 samples (10 samples for each genotype) was tested in the CAP/
CTM v2.0 neat and diluted and results were compared. None of the tested samples differed by more than 0.5 log, and the regres-sion coefficient was close to 1 (R2⫽0.9925), validating the
[image:2.585.298.541.66.600.2]dilu-tion procedure used in this study (data not shown).
TABLE 1Panels tested with the respective platforms for quantitative HCV load testing
Panel sample (dilution)
Result (IU/ml)
Expected
CAP/CTM
v2.0 Realtime bDNA
WHO (1/10) 1.55E⫹04 1.08E⫹04 5.71E⫹03 7.40E⫹03
WHO (1/100) 1.55E⫹03 1.20E⫹03 6.26E⫹02 9.83E⫹02
WHO (1/1,000) 1.55E⫹02 2.72E⫹02 9.40E⫹01 ⬍6.15E⫹02 WHO (1/10,000) 1.55E⫹01 ⬍1.50E⫹01 ⬍1.20E⫹01 ⬍6.15E⫹02 Optiqual GT1 3.18E⫹04 2.67E⫹04 1.31E⫹04 2.31E⫹04 Optiqual GT2 4.04E⫹04 2.20E⫹04 7.38E⫹03 1.94E⫹04 Optiqual GT3 3.99E⫹04 3.12E⫹04 1.25E⫹04 1.41E⫹04 Optiqual GT4 4.86E⫹04 5.49E⫹04 1.78E⫹04 5.15E⫹04
FIG 1Bland-Altman analysis of the platform comparisons. In each plot, the CAP/CTM HCV v2.0 is compared with the CAP/CTM HCV v1.0 (A), Realtime assay (B), and bDNA assay (C). The mean of the results of comparison of CAP/ CTM HCV v2.0 with the comparator is plotted on thexaxis, and the CAP/CTM HCV v2.0 value minus the comparator value is plotted on theyaxis. The solid line indicates the regression line of the Bland-Altman data. The dashed line indicates samples with values that differ more than 0.7 log10from the regression line values.
on May 16, 2020 by guest
http://jcm.asm.org/
[image:2.585.41.289.87.210.2]Platform comparison.To test the standardization of the dif-ferent platforms with international standards, the Acrometrix ge-notype panel and a dilution series of the 2nd WHO international standard were tested once with the CAP/CTM v2.0, Realtime, and bDNA assays (Table 1). No major differences of more than 0.7 log10(14) from the expected value were observed
between the test platforms except for lower values of the Realtime
test on the WHO international standard and the Acrometrix Op-tiqual genotype 2 sample. The performance of the CAP/CTM v1.0, CAP/CTM v2.0, Realtimeassay, and bDNA assay on a panel of HCV RNA-positive samples of diverse genotypes was tested. Due to limited availability of samples, not all samples were tested in all platforms. As a result, 151, 190, 189, and 190 samples were tested in the CAP/CTM v1.0, CAP/CTM v2.0, Realtimeassay, and bDNA assay, respectively. For platform comparison, a regression analysis was performed on data plots generated similarly to Bland-Altman plots (plotting the mean of results from the two assays against the difference between results from the two assays) (Fig. 1). For the calculation of the average viral load per test and regression analy-sis, only samples tested on all platforms were used and samples recorded below the LLOQ of the CAP/CTM v1.0 (15 IU/ml), the CAP/CTM v2.0 (15 IU/ml), and the Realtimetest (12 IU/ml) or below the LLOD of the bDNA (615 IU/ml) were assigned the LLOQ and LLOD values, respectively (Table 2). The average viral loads for the CAP/CTM v1.0, CAP/CTM v2.0, Realtimetest, and bDNA assay were 5.25 log, 4.91 log, 4.90 log, and 4.74 log, respec-tively. The slopes of the regression curves in the Bland-Altman plots were close to zero (⫺0.07,⫺0.07, and⫺0.06) for compari-sons of the CAP/CTM v2.0 with the CAP/CTM 1.0, Realtime, and bDNA tests, respectively. They intercepts were slightly higher than 0 for all three comparisons (0.12, 0.40, and 0.46 for the CAP/ CTM 1.0, Realtime, and bDNA tests, respectively). The regression coefficients of the linear regression analysis were 0.8957, 0.9648, and 0.9372 for the CAP/CTM 1.0, Realtime, and bDNA tests, re-spectively. Samples recorded below the LLOQ by the Realtimetest
(1 sample) and the LLOD of the bDNA assay (18 samples) had a viral load around the LLOQ of the corresponding test, while sam-ples recorded below the LLOQ by the CAP/CTM v1.0 (4 samsam-ples) had a significantly higher viral load (mean, 3.10E4 IU/ml). The 5=
untranslated regions (5=UTR) of the latter 4 samples were se-quenced, and all four sequences obtained proved to have the pre-viously reported G145A in combination with A165T mutation in the probe region (data not shown) (11). None of these four sam-ples were recorded below the LLOQ by the CAP/CTM v2.0 or in any of the other test platforms. The Realtimeassay and the CAP/ CTM v2.0 proved to have similar averages for different genotypes (Table 2). The CAP/CTM v1.0 proved to have higher averages for genotypes 1, 3, 5, and 6, while lower average viral loads were re-corded for genotypes 2 and 4. The bDNA test rere-corded on average similar viral loads for genotypes 1 and 5, while lower averages were observed for genotypes 2, 3, 4, and 6.
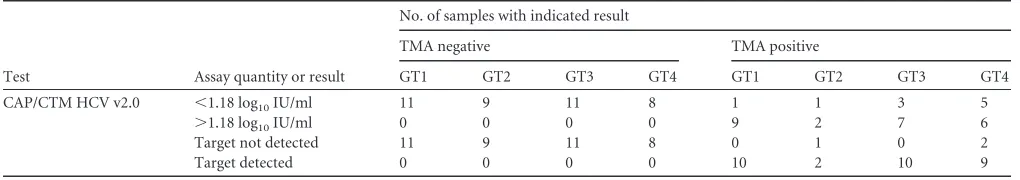
[image:3.585.39.548.80.304.2]Qualitative analysis and genotype 4 response-guided ther-apy.To determine the sensitivity of the CAP/CTM v2.0 test for the qualitative detection of HCV RNA, samples from patients infected with genotype 1, 2, 3, or 4 who were receiving therapy were pro-cessed with the TMA assay and the CAP/CTM v2.0 (Table 3). Samples were selected that were below the LLOD of the bDNA and either TMA negative or TMA positive in our routine diagnostic procedure and subsequently retested with the CAP/CTM v2.0. Equal distributions of patients infected with genotype 1, 2, 3, or 4 were selected in both groups, although, due to limited availability of samples, only a few TMA-positive samples from genotype 2-in-fected patients could be tested. Samples may be positive or nega-tive for HCV RNA but below the LLOQ and thus unquantified by the CAP/CTM v2.0. Those results are reported as⬍15 IU/ml. Qualitative results are reported as “target detected” or “target not detected” by the CAP/CTM v2.0 for samples below the LLOQ. The TMA result was compared with the CAP/CTM v2.0 qualitative result (target detected or target not detected) and the quantitative result (⬍15 IU/ml or⬎15 IU/ml). The negative predictive value of
TABLE 2Number of samples and average viral load per genotype
Genotype(s) Parameter
Valuea
CAP/CTM v1.0 CAP/CTM v2.0 Realtime bDNA
GT1 to -6 No. of samples tested 150 150 150 150
Avg viral load 5.25 4.91 4.90 4.74
GT1 No. of samples tested 25 25 25 25
Avg viral load 5.57 5.01 5.03 4.95
GT2 No. of samples tested 23 23 23 23
Avg viral load 4.62 4.29 4.34 4.16
GT3 No. of samples tested 25 25 25 25
Avg viral load 5.50 5.25 5.26 4.98
GT4 No. of samples tested 25 25 25 25
Avg viral load 4.43 4.63 4.62 4.54
GT5 No. of samples tested 17 17 17 17
Avg viral load 5.27 5.03 4.93 4.95
GT6 No. of samples tested 35 35 35 35
Avg viral load 5.10 4.76 4.70 4.43
aAverage viral load values are expressed as log
10HCV RNA international units per milliliter.
on May 16, 2020 by guest
http://jcm.asm.org/
the CAP/CTM v2.0 results on the TMA-negative samples was 100% for all genotype samples. The positive predictive values of the quantitative and qualitative results were 70% and 91%, respec-tively, with a level of performance for genotype 4 samples that was lower than that seen with genotypes 1 and 3.
Longitudinal samples from 21 HCV genotype 4-infected pa-tients who were started on treatment with polyethylene glycol-interferon (PEG-IFN) plus ribavirin were reanalyzed with the CAP/CTM v2.0. Samples from 16 patients had previously been tested with the CAP/CA and HPS/CA and samples from five pa-tients with the CAP/CTM v1.0. Retesting resulted in three changes in response interpretations relative to the previous performed test. One week 4 sample from a patient with a high baseline viral load (6.9 log IU/ml) and a complete early virological response (cEVR), previously tested and found to be HCV RNA positive with the CAP/CA (interpretation, no rapid virological response [RVR]), tested negative in the CAP/CTM v2.0 (interpretation, RVR). Both results would have resulted in a recommendation of 48 weeks of treatment according to the treatment guideline (15). Another week 4 sample from another patient with a high baseline viral load (6.2 log IU/ml) that was previously tested and found to be negative with the CAP/CA retested positive (1.17⫻103IU/ml) in the CAP/ CTM v2.0. In this case also, both results would have indicated 48 weeks of treatment. The result of a third sample that was discrep-ant after retesting would have had a significdiscrep-ant effect on therapy duration. The week 24 sample of a patient with no RVR and an EVR was previously tested and found to be negative with the CAP/ CTM v1.0 and therefore was advised 72 weeks therapy, under which the patient experienced a relapse. The week 24 sample tested positive after retesting with the CAP/CTM v2.0 and would therefore have resulted in a recommendation to stop treatment after 24 weeks according to treatment guidelines.
DISCUSSION
In the present article, we show that the CAP/CTM v2.0 has signif-icantly improved analytical and clinical performance characteris-tics compared to the previous version. Furthermore, the sensitiv-ity of the CAP/CTM v2.0 was close to that of the TMA on genotypes 1 to 4. Good precision and high sensitivity for HCV genotypes 1 to 6 indicate that CAP/CTM v2.0 is a good test for monitoring the HCV load during treatment.
Recently, an improved prototype version of the CAP/CTM HCV real-time quantitative RT-PCR was described (11). CAP/ CTM v1.0 has been shown to underquantify certain genotype 4 samples while overestimating the viral load of other genotypes (8). In addition, two polymorphisms in the region where the probe anneals could also result in false-negative results (11). In the pres-ent article, we set out to analyze the quantitative analytical perfor-mance of the CAP/CTM v2.0 test relative to the Realtimetest and
the bDNA assay. In addition, the qualitative performance relative to the TMA test and the clinical performance in a small cohort of genotype 4-infected individuals treated with PEG-IFN plus riba-virin were analyzed.
No significant differences in quantification were observed rel-ative to the Realtimetest for any of the six genotypes. The genotype quantification of the bDNA assay relative to the Realtimeand the CAP/CTM v2.0 was variable; the bDNA test seemed to under-quantify genotypes 2, 3, and 6, while similar results relative to its comparators were obtained for genotypes 1, 4, and 5. Similar to previously published data, the CAP/CTM v1.0 overestimated HCV loads in samples with genotypes 1, 3, 5, and 6 while under-estimating viral loads in genotype 2 and 4 samples (8). Also, in our analysis, 4 samples (1 genotype 1 and 3 genotype 4) that carried the mutation G145A in combination with A165T in the 5=UTR were identified, which seriously compromised the quantitation by the CAP/CTM v1.0. The CAP/CTM v2.0 correctly quantified these samples relative to the Realtimeand bDNA tests.
Currently, the most sensitive test for the detection of HCV RNA is the qualitative TMA, with a LLOD of approximately 5 IU/ml, although a head-to-head comparison with the Realtime
assay and CAP/CTM v1.0 and v2.0 has not yet been published (3,
[image:4.585.39.549.77.167.2]16). In our analysis, only 3 of the 34 bDNA-negative, TMA-posi-tive samples from patients on treatment who were infected with genotype 1, 2, 3, or 4 were not detected by the CAP/CTM v2.0 in the qualitative data set. In our qualitative data set, the CAP/CTM v2.0 had a slightly lower sensitivity for genotype 4 relative to the TMA whereas the performance for genotypes 1 and 3 was similar to that of the TMA test. Given the fact that the results of quanti-tative and qualiquanti-tative detection of genotype 4 HCV RNA are com-parable to the Realtimeassay results, it seems unlikely that the slightly lower sensitivity below the LLOQ of the CAP/CTM v2.0 (15 IU/ml) relative to the TMA for genotype 4 would have a sig-nificant impact on clinical performance characteristics. Current guidelines for the treatment of HCV recommend response-guided therapy monitored with a sensitive real-time RT-PCR-based as-say. Given the sensitivity of the qualitative results and the good genotype inclusivity of the quantitative results, it may be assumed that the CAP/CTM v2.0 can be used worldwide for response-guided treatment of HCV. The robustness of the assay in diverse laboratory settings and for genotypes encountered worldwide still needs to be elucidated, however. In a small cohort of genotype 4 HCV-infected patients on treatment with PEG-IFN plus ribavirin, 16 of whom had previously been monitored with the CAP/CA and 5 with the CAP/CTM v1.0, the CAP/CTM v2.0 performed com-parably to the CAP/CA but better than the CAP/CTM v1.0. In one patient, monitoring with the CAP/CTM v2.0 instead of the CAP/
TABLE 3Qualitative analysis of HCV RNA testing with the CAP/CTM HCV v2.0 versus the TMA test
Test Assay quantity or result
No. of samples with indicated result
TMA negative TMA positive
GT1 GT2 GT3 GT4 GT1 GT2 GT3 GT4
CAP/CTM HCV v2.0 ⬍1.18 log10IU/ml 11 9 11 8 1 1 3 5
⬎1.18 log10IU/ml 0 0 0 0 9 2 7 6
Target not detected 11 9 11 8 0 1 0 2
Target detected 0 0 0 0 10 2 10 9
on May 16, 2020 by guest
http://jcm.asm.org/
CTM v1.0 would have led to an earlier prediction of therapy fail-ure and thus to shortening of therapy.
ACKNOWLEDGMENTS
Part of this study was financially supported by Roche Molecular Diagnos-tics Ltd. Switzerland.
We thank B. Cobb and H. Stockinger from Roche Molecular Diagnos-tics Ltd. for carefully reading the manuscript. cobas, Amplicor, and Taq-Man are trademarks of Hoffmann-La Roche Ltd.
M. Schutten has received research grants from Hoffmann-La Roche Ltd. and is a consultant to Viroclinics Biosciences B.V.
REFERENCES
1.de Bruijne J, Schinkel J, Prins M, Koekkoek SM, Aronson SJ, van Ballegooijen MW, Reesink HW, Molenkamp R, van de Laar TJ.2009. Emergence of hepatitis C virus genotype 4: phylogenetic analysis reveals three distinct epidemiological profiles. J. Clin. Microbiol.47:3832–3838. 2.Sievert W, Altraif I, Razavi HA, Abdo A, Ahmed EA, Alomair A, Amarapurkar D, Chen CH, Dou X, El Khayat H, Elshazly M, Esmat G, Guan R, Han KH, Koike K, Largen A, McCaughan G, Mogawer S, Monis A, Nawaz A, Piratvisuth T, Sanai FM, Sharara AI, Sibbel S, Sood A, Suh DJ, Wallace C, Young K, Negro F.2011. A systematic review of hepatitis C virus epidemiology in Asia, Australia and Egypt. Liver Int. 31:61– 80.
3.Gorrin G, Friesenhahn M, Lin P, Sanders M, Pollner R, Eguchi B, Pham J, Roma G, Spidle J, Nicol S, Wong C, Bhade S, Comanor L. 2003. Performance evaluation of the VERSANT HCV RNA qualitative assay by using transcription-mediated amplification. J. Clin. Micro-biol.41:310 –317.
4.Hendricks DA, Friesenhahn M, Tanimoto L, Goergen B, Dodge D, Comanor L.2003. Multicenter evaluation of the VERSANT HCV RNA qualitative assay for detection of hepatitis C virus RNA. J. Clin. Microbiol. 41:651– 656.
5.Sarrazin C, Dragan A, Gartner BC, Forman MS, Traver S, Zeuzem S, Valsamakis A.2008. Evaluation of an automated, highly sensitive, real-time PCR-based assay (COBAS Ampliprep/COBAS TaqMan) for quanti-fication of HCV RNA. J. Clin. Virol.43:162–168.
6.Sizmann D, Boeck C, Boelter J, Fischer D, Miethke M, Nicolaus S, Zadak M, Babiel R.2007. Fully automated quantification of hepatitis C virus (HCV) RNA in human plasma and human serum by the COBAS AmpliPrep/COBAS TaqMan system. J. Clin. Virol.38:326 –333.
7.Schutten M, Niesters HG.2001. Clinical utility of viral quantification as a tool for disease monitoring. Expert Rev. Mol. Diagn.1:153–162. 8.Chevaliez S, Bouvier-Alias M, Brillet R, Pawlotsky JM.2007.
Overesti-mation and underestiOveresti-mation of hepatitis C virus RNA levels in a widely used real-time polymerase chain reaction-based method. Hepatology46: 22–31.
9.Colucci G, Ferguson J, Harkleroad C, Lee S, Romo D, Soviero S, Thompson J, Velez M, Wang A, Miyahara Y, Young S, Sarrazin C.2007. Improved COBAS TaqMan hepatitis C virus test (version 2.0) for use with the High Pure system: enhanced genotype inclusivity and performance characteristics in a multisite study. J. Clin. Microbiol.45:3595–3600. 10. Kleiber J, Walter T, Haberhausen G, Tsang S, Babiel R, Rosenstraus M.
2000. Performance characteristics of a quantitative, homogeneous Taq-Man RT-PCR test for HCV RNA. J. Mol. Diagn.2:158 –166.
11. Vermehren J, Colucci G, Gohl P, Hamdi N, Abdelaziz AI, Karey U, Thamke D, Zitzer H, Zeuzem S, Sarrazin C.2011. Development of a second version of the Cobas AmpliPrep/Cobas TaqMan hepatitis C virus quantitative test with improved genotype inclusivity. J. Clin. Microbiol. 49:3309 –3315.
12. Noppornpanth S, Sablon E, De Nys K, Truong XL, Brouwer J, Van Brussel M, Smits SL, Poovorawan Y, Osterhaus AD, Haagmans BL. 2006. Genotyping hepatitis C viruses from Southeast Asia by a novel line probe assay that simultaneously detects core and 5=untranslated regions. J. Clin. Microbiol.44:3969 –3974.
13. Murphy DG, Willems B, Deschenes M, Hilzenrat N, Mousseau R, Sabbah S.2007. Use of sequence analysis of the NS5B region for routine genotyping of hepatitis C virus with reference to C/E1 and 5=untranslated region sequences. J. Clin. Microbiol.45:1102–1112.
14. Jennings C, Harty B, Granger S, Wager C, Crump JA, Fiscus SA, Bremer JW.2012. Cross-platform analysis of HIV-1 RNA data generated by a multicenter assay validation study with wide geographic representa-tion. J. Clin. Microbiol.50:2737–2747.
15. Khattab MA, Ferenci P, Hadziyannis SJ, Colombo M, Manns MP, Almasio PL, Esteban R, Abdo AA, Harrison SA, Ibrahim N, Cacoub P, Eslam M, Lee SS.2011. Management of hepatitis C virus genotype 4: recommendations of an international expert panel. J. Hepatol.54: 1250 –1262.
16. Ross RS, Viazov SO, Hoffmann S, Roggendorf M.2001. Performance characteristics of a transcription-mediated nucleic acid amplification as-say for qualitative detection of hepatitis C virus RNA. J. Clin. Lab. Anal. 15:308 –313.