Active Labour Market Programmes and
Poverty Dynamics in Ireland: 1994-2001
Halpin, Brendan and Hill, John
University of Limerick
June 2007
Online at
https://mpra.ub.uni-muenchen.de/10340/
UNIVERSITYOFLIMERICK
ATUNIVERSITYOFLIMERICK
ATUNIVERSITYOFLIMERICK
UNIVERSITYOFLIMERICK
sociology
University of Limerick
Department of Sociology Working Paper
Series
Working Paper WP2007-02
June 2007
Brendan Halpin
Department of Sociology
University of Limerick
John Hill
Department of Economics
University of Limerick
Active Labour Market Programmes and Poverty Dynamics in
Ireland
Dynamics in Ireland
Brendan Halpin and John Hill Dept of Sociology and Dept of Economics
University of Limerick∗ June 2007
Active Labour Market Policies, which provide training and subsidised employment to
the unemployed, are an important part of Ireland’s welfare state. While a good deal
of existing research is concerned with the effect of these policies on employment chances
and on wage rates, none addresses the connection between poverty and ALMPs: do these
policies have an effect on poverty? That is, first, to what extent do these policies serve
the low-income population, as a consequence of and in addition to their focus on those
in precarious labour market situations? Second, to what extent do these policies function
to lift people out of poverty in the medium term? To address these issues we use
longitu-dinal data from the Living in Ireland survey (1994–2001) and examine how respondents’
situation in one year predicts participation in employment and training schemes in the
next year, and then how participation in these schemes affects poverty status in the
fol-lowing year. Participants on both sorts of schemes are much poorer than the population
average, and those on employment schemes (but not training schemes) are even poorer
than one would expect given their observed characteristics. Employment schemes and
training schemes serve different purposes and different populations. A conventional
lo-gistic regression analysis seems to suggest that employment schemes (but not training
schemes) positively increase the risk of poverty in the following year. This finding is
not considered reliable, but rather it reflects the selection processes whereby those on
employment schemes are in particularly vulnerable situations, in respects that are not
picked up in the data set. A more rigorous analysis, using propensity score matching,
reveals that employment schemes are neutral on poverty risk. Training schemes have a
weak but insignificant protective effect.
Considering the risk of poverty approximately one year after participation begins,
employment schemes (and to a lesser extent, training schemes) do not seem to be good
value for money. We add the caveat that it may be desirable to consider outcomes two
or more years into the future, were data available, and that other outcome measures of
quality of life should also be taken into account. Ultimately, in the context of labour
Acknowledgements
We gratefully acknowledge the support of the Combat Poverty Agency, who funded this
work under their Research Initiative 2005. The paper has benefitted from comments of
participants in the CPA Research Seminar, May 2006, and from Philip O’Connell and
Richard Layte. Opinions, errors and omissions are the responsibility of the authors.
Contents
1 Introduction 1
2 Background 2
2.1 Origin of ALMP . . . 3
2.2 Emergence of ALMP in Ireland . . . 4
2.3 Flavours of ALMP. . . 4
2.4 Irish labour market in context . . . 6
2.5 Participation & throughput . . . 8
2.6 Expenditure commitment & intensity . . . 9
3 Existing research on ALMPs 11 3.1 Previous evaluations of micro effects . . . 12
3.2 Evaluations of supply-side measures . . . 14
3.3 Evaluations of demand-side measures . . . 14
4 Methodology 14 4.1 Living in Ireland Survey . . . 15
4.1.1 Longitudinal perspective . . . 15
4.1.2 Poverty dynamics from LII . . . 15
4.1.3 Observing exposure to ALMPs . . . 19
4.2 Medium-term outcome focus . . . 20
4.3 Two analytical passes – descriptive and “pseudo-experimental” . . . 21
4.4 Propensity Score analysis . . . 22
5 Descriptive analysis 26 5.1 Poverty and participation rates . . . 26
5.2 Do schemes “target” the poor? . . . 28
5.2.1 Targetting the poor? A summary . . . 32
5.3 Do schemes have an effect on medium term risk of poverty? . . . 32
6 Propensity score matching analysis 35 6.1 Carrying out the matching . . . 35
1
Introduction
Ireland is usually characterised as aliberal welfare state in the Esping-Andersen sense,
aligned with the United Kingdom and (at the end of the continuum) the United States,
providing a minimalist and means-tested safety net (Esping-Andersen, 1990,1999). In many respects this is fair, but in certain respects Ireland deviates significantly from the
liberal model. One respect is the relative importance of Active Labour Market Policies
(ALMPs), that is, policies that focus on improving the situation of the unemployed and
lower-skilled workers by training and subsidy. In both levels of expenditure and
insti-tutional commitment to ALMPs, Irish practice has tended towards the higher end of the
scale, average to above average in OECD and EU contexts, and substantially higher than
the UK.
ALMPs are intended to have effects at a number of levels, including macro-economic,
re-distributional and individual. Existing research has focused largely on the effects of
programmes on medium-term employment status, a justifiable concern with the
indi-vidual labour market outcome. If beneficial labour market effects cannot be observed at
the individual level, it is hard to argue that programmes could have macro-economic or
redistributional effects. In this research we retain the focus on individual outcomes but
rather than assess direct labour market effects, we take a redistributional perspective. We
ask two distinct but closely related questions:
• To what extent do ALMPs target “poor” households?
• To what extent do ALMPs have positive consequences for household poverty status
in the medium term?
While the direct effects of ALMPs should lie in improving the productivity and
em-ployability of workers, it is also the case that their social consequences should be to
ame-liorate the situation of some of the more vulnerable members of society. It is therefore
an important question to ask, whether those to whom ALMP opportunities are made
available are indeed among the more deprived. Can we consider ALMPs to bede facto
anti-poverty policies, or is it the case that those that benefit from them are not those most
in need, but rather those most in a position to benefit, or those best equipped to benefit
from the system?
The second question is closely related but looks at consequences rather than selection:
medium term? This is closely related to the issue of beneficial labour market effects, but
imposes an additional condition that such changes also have the effect of reducing the
risk of poverty below what it would otherwise be.
In what follows we first outline the background to active labour market policy and the
history of its development in Ireland (section2), and then present a summary of aspects
of the literature on ALMPs in Ireland (section3). We go on to conduct a series of empirical analyses using the Living in Ireland household panel survey, to address our twin research
questions (sections 4 through 6). The empirical analysis combines more conventional descriptive methods with a pseudo-experimental “propensity score matching” technique
which is intended to give a less biased estimate of the effect of participation in ALMP
schemes on the subsequent risk of poverty.
2
Background
Active labour market policy is a heterogeneous mix of supply and demand-side policy.
On the supply side ALMP are responsible for training and retraining the unemployed,
and may assist in matching candidates to vacancies through the public employment
ser-vice. On the demand side, ALMP may involve employment subsidies to firms or even
direct employment creation.
The fundamental goal of all active labour market policy is to reduce the number
of people in open/passive unemployment. If training authorities respond quickly to
changes in the composition of the labour market and tailor programmes to meet
em-ployer needs, then specific-skills training may address structural unemployment.
Simi-larly, general training may bring into the labour force those who, for a variety of reasons,
maintained only a tangential connection to the formal education system. Without the
intervention of adult education, even in the form of general skills training, these people
may be at risk of entering long term unemployment.
The OECD (2000, p. 176) have set out seven distinct objectives of an active labour
market policy:
1. Job creation, either to reduce the number of registered unemployed in the short-run
or to generate jobs persisting beyond the period of intervention, such as jobs in the
social economy.
the long-term employed a chance to enter into jobs which would otherwise be
of-fered to others, and thereby maintain an attachment to the labour market for groups
at risk.
3. Skill and human capital acquisition, which may not lead to a job immediately but
enhances the employability and productivity of the unemployed, whose skills are
otherwise eroded by long spells of inactivity.
4. Attitudinal changes, combating the discouragement and alienation of job seekers,
enhancing their motivation and willingness to work; but also encouraging
employ-ers to recruit and overcome prejudices and stigmatisation.
5. Increase of earnings, either in the long- or short-run; combating poverty and
un-employment traps, particularly in low wage and low skill segments of the labour
market.
6. Macroeconomic objectives, such as increasing the potential labour supply, and
re-ducing structural unemployment without increasing wage push inflation.
7. Addressing wider social objectives, such as promoting health, combating
criminal-ity and enhancing the social cohesiveness of communities.
2.1 Origin of ALMP
The notion of an “active” labour market policy came to fore in the 1970s as high
infla-tion beset many of the world’s industrial economies, including Ireland. Two Swedish
economists, G ¨osta Rehn and Rudolf Meidner, had successfully brought inflation under
control in Sweden using a double-edged approach of labour retraining and solidaristic
wage bargaining. The former ensured a ready supply of skilled labour, while the
lat-ter forced inefficient and under-performing firms out of business. Rehn & Meidner’s
work influenced OECD thinking and was formalised as “manpower planning” by the
late 1970s. WhileEsping-Anderson(1985) classifies these measures as macroeconomic tools to counter rising inflation (and not as a response to widespread unemployment),
both inflation and unemployment are known to be heavily interdependant.
In essence, manpower planning ensured that firms had an adequate pool of skilled
It followed that retraining would facilitate structural change and ultimately achieve full
employment.
Outside of Sweden, ALMP was embraced as a possible solution to high levels of
un-employment and coincided with the recognition of long-term unun-employment as a distinct
focus for concern. The shift from passively supporting the unemployed (i.e. through
so-cial welfare) to activation reflected an extension of the strongly interventionist Keynesian
paradigm of the time.
2.2 Emergence of ALMP in Ireland
O’Connell and McGinnity (1997b) characterise Irish labour market policy during the 1960s and 1970s as mainly confined to the organisation of apprenticeship training and
to matching supply and demand for labour. These policies were in-line with the OECD’s
“manpower policy” aimed at achieving full employment and strong growth. However,
with the onset of high unemployment and low growth in the 1970s, governments
em-braced the Swedish example by adopting a variety of active labour policies. These
included employment subsidies, training schemes and temporary public job creation
schemes. From 1975, the Youth Training Programme, Premium Employment Programme
and Employment Incentive Schemes were all introduced. In 1976, the Environment
Im-provement Scheme, Temporary Grant Scheme for Youth Employment (Teamwork) and
Community Workshops, all targeted the phenomenon of youth unemployment.
Accord-ing toO’Connell and McGinnity (1997b), by the 1980s, active labour policies had taken
centre-stage in the government’s response to mass unemployment.
However, it was a commonly held view that unemployment was a transitory
phe-nomenon. Emphasis was placed on demand-side measures to generate new employment
places, while retraining schemes frequently focused on finding employment for the
(rel-atively) most employable candidates – to the neglect of the most disadvantaged (NESC,
1996).
2.3 Flavours of ALMP
ALMP’s constituency is diverse. Skills-specific training and apprenticeships may help
those who received a formal school education and who now wish to specialise; whereas
general training provides basic workplace skills to those who have been out of the labour
Table 1: Typology of ALMP Market Orientation
Labour Market Leverage Weak Strong
Supply General Training Specific Skills Training
Demand Direct Employment Schemes Employment Subsidies
level. Finally, direct employment schemes and employment subsidies, may redress skills
and human capital depreciation incurred by the long term unemployed during their
ab-sence from the labour market. A summary table of training and employment schemes is
included in AppendixA. ALMPs are conventionally classified into five broad categories:
1. Public employment services: including information, placement and counselling
services for the unemployed.
2. Labour market training: including measures to enhance the skills of both employed
and unemployed.
3. Youth measures: including training, work experience and apprenticeships.
4. Subsidised employment: including direct job creation measures as well as subsidies
towards private sector recruitment and/or self-employment.
5. Training and employment measures targeted specifically at the disabled.
O’Connell and McGinnity(1997b) derive the following typology of ALMPs based on
the conventional classifications (see Table1):
General Training Programmes in this category provide basic/foundational skills and
are designed for those with poor educational qualifications. It includes programmes
for second chance education, for women returning to work after child rearing, for
long-term unemployed males, for young school-leavers, for people with
disabili-ties and may also offer training to develop community resources. Unlike vocational
training which enhances employability by teaching specific skills, general training
teaches general subjects often covered during second level schooling.
Skills Specific Training The courses are designed to meet specific skills needs in the
economy and are usually targeted at specific industries and occupations. An
ex-ample is specific skills training as operated by F ´AS, where the level of training is
Direct Employment Schemes These programmes consist of subsidised temporary em-ployment in the public or voluntary sectors – which O’Connell and McGinnity
(1997b, p.20) term a “variant of conventional public works programmes.” While
di-rect employment schemes may indeed lead to the provision of public goods/services,
their over-riding purpose is that of employment generation. In Ireland, Community
Employment (CE) is the largest direct employment scheme. CE, which replaced the
Social Employment Scheme in 1994, is targeted at the long-term unemployed.
Employment Subsidies These are subsidies to the recruitment or self-employment of
unemployed workers in the private sector. They may be paid to either employer or
employee; and are designed to, “offset the relative unattractiveness,” of a long-term
unemployed candidate (O’Connell and McGinnity,1997b, p.21). The subsidy may be seen as compensation for the greater costs of recruiting and training the
long-term unemployed. The subsidy comprises a lump-sum payable on recruitment, and
continuing payment and/or exemptions from social insurance contributions. The
Back to Work Allowance, launched in 1993, is paid directly to employees. Among
those paid to employers are the Employment Incentive Scheme (1977-1994) and the
Employment Subsidy Scheme (1992-1993).
2.4 Irish labour market in context
Large-scale unemployment beset the Irish economy in the early 1980s. In the first half
of that decade unemployment more than doubled, rising from 7 to 17% in five years.
Some 226,000 people were registered unemployed in 1985 and in receipt of social welfare
payments. Subsequent analysis would place the blame for Ireland’s (un)employment
crisis directly at the door of the government. In particular, high levels of personal taxation
raised the reservation wage of jobseekers as the reward for work was eroded through
taxation.
High unemployment was far from a passing phenomenon, and levels of
unemploy-ment twice the OECD persisted for another ten years after 1985. With an average of 15%
of the labour force out of work during this decade, the corresponding problem of
long-term unemployment also worsened. Long-long-term unemployment (LTU) refers to a cohort
of the unemployed who have been out of work for one year or more. Rates of long-term
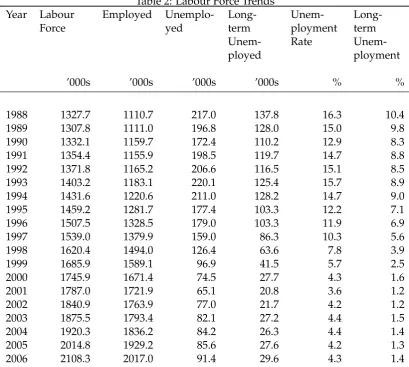
Table 2: Labour Force Trends Year Labour Force Employed Unemplo-yed Long-term Unem-ployed Unem-ployment Rate Long-term Unem-ployment
’000s ’000s ’000s ’000s % %
1988 1327.7 1110.7 217.0 137.8 16.3 10.4 1989 1307.8 1111.0 196.8 128.0 15.0 9.8 1990 1332.1 1159.7 172.4 110.2 12.9 8.3 1991 1354.4 1155.9 198.5 119.7 14.7 8.8 1992 1371.8 1165.2 206.6 116.5 15.1 8.5 1993 1403.2 1183.1 220.1 125.4 15.7 8.9 1994 1431.6 1220.6 211.0 128.2 14.7 9.0 1995 1459.2 1281.7 177.4 103.3 12.2 7.1 1996 1507.5 1328.5 179.0 103.3 11.9 6.9 1997 1539.0 1379.9 159.0 86.3 10.3 5.6 1998 1620.4 1494.0 126.4 63.6 7.8 3.9 1999 1685.9 1589.1 96.9 41.5 5.7 2.5 2000 1745.9 1671.4 74.5 27.7 4.3 1.6 2001 1787.0 1721.9 65.1 20.8 3.6 1.2 2002 1840.9 1763.9 77.0 21.7 4.2 1.2 2003 1875.5 1793.4 82.1 27.2 4.4 1.5 2004 1920.3 1836.2 84.2 26.3 4.4 1.4 2005 2014.8 1929.2 85.6 27.6 4.2 1.3 2006 2108.3 2017.0 91.4 29.6 4.3 1.4 Sources:Labour Force Survey(Central Statistics Office, various years);Quarterly National
Household Survey(Central Statistics Office, various years).
1985 having been out of work for more than a year. Combined with an increasing
num-ber of lay-offs as the macroeconomic context deteriorated, levels of LTU peaked at 11%
of the labour force by the mid to late 1980s (see Table2).
By any measure, Ireland’s problem was significant. Not only were levels of
unem-ployment high, but outflows to new jobs (exits from unemunem-ployment) were low. Because
of this, people’s attachment to the labour force became weakened as they spent long
periods out of work. Tackling LTU became a priority for government. While
govern-ment may hope to remedy unemploygovern-ment though sound macroeconomic managegovern-ment
and economic growth, the profile of those long-term unemployed was complicated by
inertia. It was widely recognised that the paralysis associated with long-term
unemploy-ment was complex, potentially independent of improveunemploy-ments in the macroeconomy and
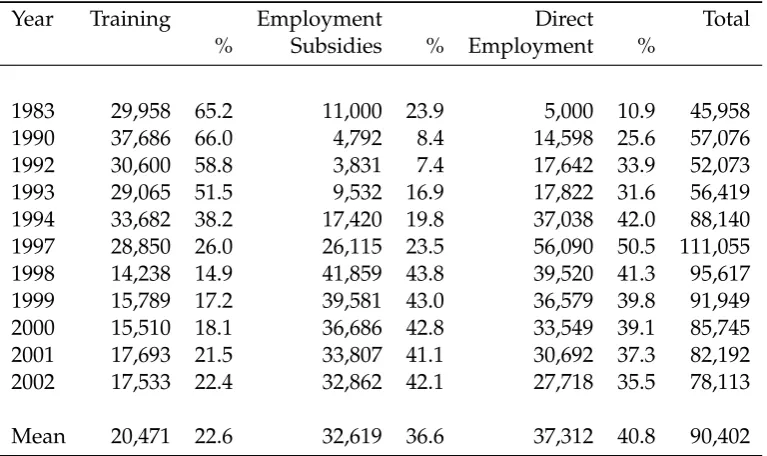
Table 3: Indicative Table of ALMP Participation, 1983–2002
Year Training Employment Direct Total % Subsidies % Employment %
1983 29,958 65.2 11,000 23.9 5,000 10.9 45,958 1990 37,686 66.0 4,792 8.4 14,598 25.6 57,076 1992 30,600 58.8 3,831 7.4 17,642 33.9 52,073 1993 29,065 51.5 9,532 16.9 17,822 31.6 56,419 1994 33,682 38.2 17,420 19.8 37,038 42.0 88,140 1997 28,850 26.0 26,115 23.5 56,090 50.5 111,055 1998 14,238 14.9 41,859 43.8 39,520 41.3 95,617 1999 15,789 17.2 39,581 43.0 36,579 39.8 91,949 2000 15,510 18.1 36,686 42.8 33,549 39.1 85,745 2001 17,693 21.5 33,807 41.1 30,692 37.3 82,192 2002 17,533 22.4 32,862 42.1 27,718 35.5 78,113
Mean 20,471 22.6 32,619 36.6 37,312 40.8 90,402 Note: Direct Employment = Community Employment (all years), Teamwork (pre 1997),
Part-time Job Opportunities Programme (pre 1997).
Sources:O’Connell and McGinnity(1997b),Indecon(2002), ILO Laborsta Database.
the expansion of ALMP, and in particular subsidised employment, became a priority for
public policy.
2.5 Participation & throughput
The pattern of expansion in ALMP participation (or throughput) is broadly responsive to
changes in the unemployment rate over time (see Table3). In 1983 overall participation stood at almost 46,000 – comprising 65% training, 24% employment subsidies and 11%
direct employment. Within seven years, overall numbers rose some 11,000, but more
dra-matic was the change in the composition of ALMP. Participation in training remained a
constant 66%, but employment subsidy schemes lost significant ground to direct
employ-ment. Following the birth of Community Employment in 1994, the numbers engaged in
direct employment schemes continued to grow until it peaked at 56,090 in 1997.
Employ-ment subsidy schemes, on the other hand, peaked at 41,859 (or 44% of total participation)
in 1999, and remained only slightly below this level thereafter.
Overall provision, which peaked at 111,055 in 1997, has fallen in response to a
gen-eral tightening of the labour market. In a visible reorientation of public policy regarding
ALMP in 1998, participation in training was halved and direct employment fell by some
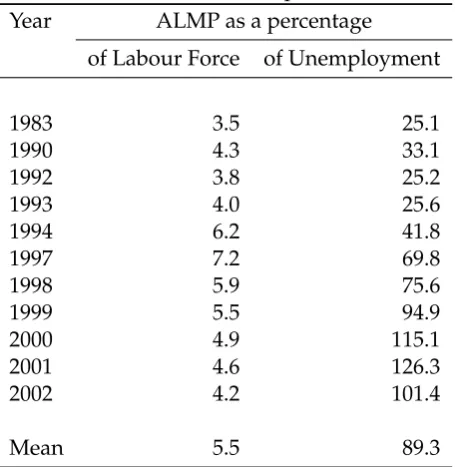
Table 4: Scale of ALMP Participation, 1983–2002 Year ALMP as a percentage
of Labour Force of Unemployment
1983 3.5 25.1
1990 4.3 33.1
1992 3.8 25.2
1993 4.0 25.6
1994 6.2 41.8
1997 7.2 69.8
1998 5.9 75.6
1999 5.5 94.9
2000 4.9 115.1
2001 4.6 126.3
2002 4.2 101.4
Mean 5.5 89.3
Sources:O’Connell and McGinnity(1997b),Indecon(2002), ILO Laborsta Database.
to 2002, with direct employment schemes such as Community Employment shrinking to
pre-1994 levels. By 2002, training accounted for just one-fifth of all ALMP participation.
The die has clearly been cast in favour of subsidised employment schemes with a
sup-porting role for training and an ever-decreasing allocation of places to direct-employment
schemes.
2.6 Expenditure commitment & intensity
When measured as a portion of GDP Ireland has always made a generous commitment
to ALMP. In the period where data is available from the OECD’s Social Expenditure
Database (1985-2001), Ireland typically spent 1.4% of GDP on labour market programmes
– consistently above our European neighbours. The ratio of ALMP expenditure to GDP
in these countries has been a remarkably constant 0.9%. The turnaround in Ireland’s
eco-nomic fortunes from the mid-1990s explains the dramatic decline in the ratio of ALMP to
GDP, as the latter began to soar with the contribution of multi-national firms.
Even more remarkable has been the ratio of ALMP to Public Social Expenditure
(health, education etc), which has consistently been twice the European average. The
ratio peaked at 8% of total public social expenditure in 1995 (reflecting the expansion
of places in subsidised employment schemes such as Community Employment) but fell
.6 .8 1 1.2 1.4 1.6
1985 1990 1995 2000
year
Ireland EU15 Mean
4 6 8 10
1985 1990 1995 2000
year
Ireland EU15 Mean
10 20 30 40 50
%
1985 1990 1995 2000
Year
Ireland EU15 Mean
[image:17.595.158.442.86.681.2]steady reduction in subsidised employment places.
The intensity of ALMP expenditure relative to European norms is highlighted by
Fig-ure1c. Here we show gross government expenditure on ALMP per head of registered
unemployed1. We then express expenditure per head as a ratio of the Average Production
Wage, which approximates the earnings of a single male production worker2. During the
dark days of double-digit unemployment (mid-1980s to mid-1990s), government
spend-ing on ALMPper capita unemployedwas just half of the European average. Expenditure
intensity did not meet (or exceed) the EU15 average until the reversal of fortune in the
Irish labour market and the ensuing fall in unemployment post 1998. The purpose of this
illustration is to demonstrate that while Ireland is often cited has having devoted
signif-icant resources to ALMP (relative to both GDP and public social expenditure), in reality
the intensity of this expenditure when expressed per capita unemployed, and relative to
the average production wage, falls far short of the European average for the same period.
3
Existing research on ALMPs
While the social sciences offer a menu of ex-post theories justifying intervention in the
labour market,Webster(1997, p. 4) dutifully reminds us that, “as a remedy for idleness,
labour market programmes have a longer tradition than formal economic theory.” She
dates the emergence of “modern” unemployment to the transition from agrarian
feudal-ism to industrial capitalfeudal-ism; and points out that sixteenth-century workhouses sought to
achieve many of the same basic aims as modern labour market policy (training,
employ-ment and a “moderated” wage) – albeit with more coercion.
Two main schools of thought exist regarding labour market programmes. The first
school believe a laissez-faire/unchecked market is characterised by myopia, uncertainty
and imperfect information, and is incapable of producing efficient/equitable outcomes
in the absence of intervention. A cycle of poverty may arise if individuals or groups are
allowed to fall too far below socially acceptable standards. In the words ofWebster(1997, p. 9), “failure breeds failure.”
A second school – while acknowledging the desirability of a laissez-faire self-clearing
1A composite series of the total number unemployed, generated from Labour Force Surveys and
aug-mented with local Employment Office Register data where LFS is missing (France: 1985-90, Official Esti-mates; Germany: no LFS data pre 1991; Luxembourg: Register Data Only; Netherlands: 1996 LFS missing; Portugal: 1998 LFS missing; UK: 1985/86 LFS taken from World Development Indicators.)
2Denominated in “national euro”: an OECD term for the retrospective conversion of historical time-series
approach to labour market management – also accepts that for reasons of equity or social
justice, the achievement of a purely laissez-faire solution may not possible. Instead,
inter-ventions are justified where they reduce the disincentives to work or train. In this liberal
perspective, high taxes on labour, high replacement rates and a high minimum wage are
distortionary and act to disincentivise work.
The theoretical pedigree of active labour market policies has often been questioned,
as many of its advocates focus on policy objectives before ever advancing a textbook
case for labour market failure. In fact ALMP has rarely made headway into mainstream
macroeconomic debate. Demand-side macroeconomics tends to view the unemployed
as the tail-end of a homogenous labour queue; while labour market programmes may
rearrange this queue, but they will not resolve the basic causes of unemployment (
Web-ster,1997). Supply-side macroeconomists argue that government intervention itself con-tributes to unemployment and should be avoided. Not withstanding this, ALMP has
received rigorous attention in the work ofLayard et al. (1991) andCalmfors and Lang
(1995), and is summarised inHill and Halpin(forthcoming).
Evaluations of the microeconomic (individual level) impact of labour market
pol-icy typically examine supply- and demand-orientated policies separately. Supply
pro-grammes aim to enhance the human capital (skills, employment chances and potentially
the earnings of participants); whereas demand-side programmes act to reduce the price
of labour by offering subsidies to employers theory making it more attractive to hire
el-igible job-seekers. Demand-side measures effectively “create” new demand for labour
through direct public employment schemes.
3.1 Previous evaluations of micro effects
Denny et al.(2000) evaluated the employment and earnings outcomes of ALMP partici-pants against a group of non-participartici-pants over the period 1994-96. A treatment group of
1,473 respondents from a stratified sample of the 1996 F ´AS Follow-up Survey was
iden-tified3. A corresponding control group was drawn from the first two waves (1994/5)
of the Living in Ireland Survey. Only persons who were unemployed during the first
wave of the LIS, and at risk of participating in ALMP, were admitted to the final control
group of 558. Denny et al’s methodology involved a comparison of ALMP participants
from the time they left their programmes with a control group who remained in
unemployment and chose not to participate in ALMP. This first-step in establishing a
control group is based on employment status alone and does not take account of other
factors that may influence selection into labour market programmes. Specifically, the
control group in this study were (on average) older, more likely to hold no qualification
and more likely to have been unemployed for two years or more.
When outcomes in 1996 are compared, ALMP participants where twice as likely as
the control group to have obtained employment. The same is true of employment type,
where ALMP “graduates” are more than twice as likely to have secured fulltime
employ-ment. Their report cautions of significant deviation in employment outcomes between
the varieties of ALMP: recipients of specific training were the most likely to secure
em-ployment (75%), followed closely by those whose emem-ployment was subsidised (70%).
The progression to employment from general training was less significant (47%); while
only 36% of those engaged in direct employment progressed to mainstream employment.
To obtain a more robust estimate of the differences accruing to both groups it is
nec-essary to control for observable differences between them. Obvious candidates are age,
sex, education and employment history. Denny et al fit a logistic model of employment
probabilities using the LIS control group as a reference category. After controlling for
observed differences, they report the employment probabilities for participants in three
flavours of ALMP (employment subsidy, specific training, general training) are
signifi-cant and positive (compared to the reference category, or openly unemployed
compari-son group). Only those who completed direct employment schemes show no significant
increase in employment probabilities compared to the reference category. The effects of
having a secondary or tertiary education are positive and significant; while conversely,
the effects of being out of work for>1or>2years are negative and significant.
Denny et al conduct a final robustness test on their model to ensure unobserved
la-tent characteristics (for example: motivation, social networks) are not influencing the
selection process. For example, if those engaging in ALMP had stronger social networks
or better personal motivation at the outset, this would lead us to seriously overestimate
the positive contribution of ALMP to employment chances. Implementing a two-stage
procedure to model selection and outcomes and separately, they report no significant
correlation in the residuals of either model.O’Connell(2002) summarises: “specific skills
training are shown to have substantially greater employment chances than the
programme.”
Applying the same methodology to estimate the earnings effect of participation, Denny
et al repeat their finding of a significant positive effect of specific skills training (SST)
on earnings – though the effect on wages is overall weaker than that reported for the
probability of re-employment. Furthermore, by interacting SST with sex, age and
unem-ployment duration, they find that SST is most effective at raising the earnings of women
and those over 25 (though neither is strongly significant). The authors find the principal
impact of ALMP is to raise the probability of employment (particularly for ALMP with
strong labour market linkages, such as specific skills training), rather than to enhance the
earnings of participants. These findings were later confirmed in the published analysis
ofO’Connell(2002).
3.2 Evaluations of supply-side measures
Breen(1991) analysed the effectiveness of training and employment schemes using a five-year follow-up survey of 1981/2 school-leavers. The cohort included ALMP participants
and non-participants. Breen found labour market training schemes increased the
short-term employment probabilities of young people, but it is unclear if reported long-short-term
effects are due to selection basis.
3.3 Evaluations of demand-side measures
Breen and Halpin(1989) surveyed 400 firms to evaluate the impact of a wage subsidy scheme. Importantly, they found 68% of hirings weredeadweight(i.e. hirings what would
have been made even in the absence of the subsidy), while 21% represented a
substitu-tion effectto avail of the subsidy. Displacement was found to be low, with only 8% of
subsidised hirings removing an existing employee.
4
Methodology
The empirical exercise this paper presents uses longitudinal data to address the two
re-search questions: Who participate in schemes? What happens to their poverty risk
after-wards? Longitudinal data lets us look at the antecedents of participation a year before,
and the outcome a year after. We use a relatively conventional approach, based on
intended to give a better estimate of the causal effect of participation (see section4.4).
4.1 Living in Ireland Survey
The Living in Ireland Survey (LII) is a particularly important resource for understanding
the dynamics of Irish society through the second half of the 1990s. It was a household
panel survey and ran from 1994 to 2001, following a panel of respondents and
interview-ing all adult members of their households. It has good information on income and
there-fore necessarily on the dynamics of household income and of poverty. It has extensive
labour market information, which allows us to track, with some restrictions, individuals’
participation in training and employment schemes.
4.1.1 Longitudinal perspective
The longitudinal perspective that panel data provides has a number of advantages. First
we can track individuals over time and assess theirexposureto factors such as poverty
or unemployment, rather than simply observing their state at one timepoint. Second,
we can observe “dynamics”: movements in and out of states. Third, the temporal order
gives us a greater ability to discriminate between correlation and cause, giving us more
power to distinguish between selection effects (where the individual’s prior
characteris-tics have effects both on the likelihood of experiencing the “treatment” and on the nature
of the outcome) and causal effects (where the “treatment” has effects on the outcome
that are separate from those arising from the individual’s characteristics). In practical
terms, the longitudinal structure allows us to observe individuals as they enter,
partic-ipate in and leave ALMP-type schemes, and to observe their medium-term outcomes.
This before-and-after perspective gives us much greater power to assess the true effects
of participation in ALMP schemes, compared with looking at cross-sectional outcomes.
4.1.2 Poverty dynamics from LII
The LII has been used extensively to assess poverty dynamics (Callan,1996;Nolan,2002;
Layte,2001;Layte et al.,2001;Whelan et al.,2003;Callan et al.,2004, inter alia) over the 1990s, and has been superseded more recently by the EU-SILC. In this research we use
household poverty as our primary outcome variable, and define it in a manner as close
Table 5: Equivalised household income and poverty by wave, 1994–2001 (weighted LII data)
Wave Equivalised net income (IE£/month)
% poor
Mean Median
1994 138.01 115.23 14.7 1995 148.58 125.00 17.4 1996 155.76 128.19 17.5 1997 166.11 142.81 17.5 1998 186.72 159.47 18.0 1999 200.70 181.32 20.3 2000 227.43 200.89 18.8 2001 255.85 234.03 20.2
Note: Poverty is defined as below 60% of the median median
of living, rather than the more direct effect on labour market outcomes, the focus is
ap-propriately on equivalised household income, rather than individual labour income. We
take household net income as reported by the LII, and equivalise it using the ESRI “A”
equivalence scale which treats the first adult in the household as one unit, subsequent
adults as 0.66 units and children as 0.33 units. We take 60 percent of median equivalised
income as the default poverty line throughout this paper, where the median is calculated
within years across households, weighted according to the LII household weight. The
use of wave-specific medians removes the need for deflating with a price index.
Table 5summarises mean and median equivalised household income, and the
per-cent poor at the 60%-median rate, across the eight years of the survey. The strong income
growth over the period is reflected in the rising mean and median income, with the
me-dian more than doubling over the period. However, the proportion falling below the
poverty line also rises over the period, from under 15 percent to over 20. It is of course
probable that some of these people are becoming “poor” while experiencing rising
in-comes, or at least without experiencing income decline, since the poverty line is rising so
sharply through the period.
These poverty rates are slightly higher than those reported by the ESRI, but the trend
across the eight years is in accord with their figures.
We can get a fuller picture of the evolution of relative poverty, and the sensitivity to
the precise relative poverty line by reference to Figure2. While the proportion below 75 percent of median household income shows no particular trend, the 60 percent and
0 5 10 15 20 25 30 35
1 2 3 4 5 6 7 8
[image:24.595.99.497.93.383.2]75% median 60% median 50% median 30% median
Figure 2: Percent under a variety of percentages of median income
tonic. The rate of extreme relative poverty, falling below 30 percent of median household
income, is very low, rarely rising above 1 percent of the sample.generally
Moving in and out of poverty The advantage of the longitudinality of the LII is the
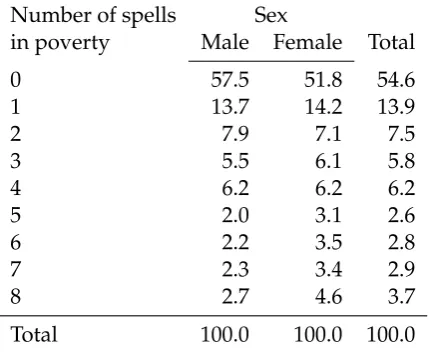
view on poverty dynamicsper se. How stable is poverty status? As Table6shows, ap-proximately 45 percent of respondents experience at least one spell of poverty over the
eight waves, but less than 4 percent are poor the whole time – there is a great deal of
movement. Table7 summarises this mobility in terms of the year-to-year turnover
be-tween income bands. Respondents with less than 30 percent of median income in one
year have a one-in-five chance of staying there the next year, compared to a one-in-three
chance of moving above median income. Less severely poor low-income individuals
seem to have a somewhat lower chance of improving their situation: those between 30
and 50 percent of median income have a less than 50:50 chance of being above 50 percent
of the median the following year, and those between 50 and 60 percent of the median
have only a 35 percent chance of relative improvement. This is a picture of some
move-ment, down as well as up: chances of getting out of severe poverty are good, but there is
Table 6: Exposure to poverty over eight waves: number of times below 60% of median Number of spells Sex
in poverty Male Female Total
0 57.5 51.8 54.6
1 13.7 14.2 13.9
2 7.9 7.1 7.5
3 5.5 6.1 5.8
4 6.2 6.2 6.2
5 2.0 3.1 2.6
6 2.2 3.5 2.8
7 2.3 3.4 2.9
8 2.7 4.6 3.7
Total 100.0 100.0 100.0
Note: weighted data, restricted to respondents present at all waves
Table 7: Year-on-year relative income transitions
Previous year Percentage of median household income, current year Person –years Under 30% 30-50% 50-60% 60-100% Above
Under 30% median 19.4 13.1 11.7 22.5 33.3 299 30-50% median 2.6 53.2 17.8 19.7 6.7 3,167 50-60% median 1.3 20.6 43.8 29.3 5.1 4,157 60-100% median 0.5 5.4 12.0 59.5 22.6 12,994 Above median 0.4 0.9 1.0 11.7 86.0 22,689
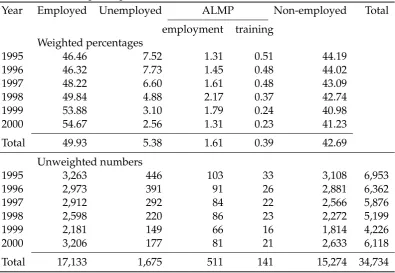
[image:25.595.93.508.557.684.2]Table 8: Observed participation in ALMP schemes at time of interview, 1995–2000 Year Employed Unemployed ALMP Non-employed Total
employment training Weighted percentages
1995 46.46 7.52 1.31 0.51 44.19 1996 46.32 7.73 1.45 0.48 44.02 1997 48.22 6.60 1.61 0.48 43.09 1998 49.84 4.88 2.17 0.37 42.74 1999 53.88 3.10 1.79 0.24 40.98 2000 54.67 2.56 1.31 0.23 41.23 Total 49.93 5.38 1.61 0.39 42.69
Unweighted numbers
1995 3,263 446 103 33 3,108 6,953
1996 2,973 391 91 26 2,881 6,362
1997 2,912 292 84 22 2,566 5,876
1998 2,598 220 86 23 2,272 5,199
1999 2,181 149 66 16 1,814 4,226
2000 3,206 177 81 21 2,633 6,118
Total 17,133 1,675 511 141 15,274 34,734
4.1.3 Observing exposure to ALMPs
The LII contains extensive information on labour market participation, and it is this
we use to observe participation in ALMP schemes. The labour market information is
recorded in two principal ways, with monthly status calendars as well as more detailed
information about the state at interview. While the more-or-less continuous monthly
information is attractive, and would in theory permit a broader range of analyses, the
level of detail is less than for the state at the time of interview and as a result it is less
satisfactory for identifying spells in ALMP schemes. In particular, it distinguishes
inad-equately between education and ALMP-related training, whereas the variables relating
to the state at interview are better at identifying participation in either state-sponsored
training or subsidised employment. Unfortunately, even then the amount of detail is
sub-stantially less that that available toO’Connell and McGinnity(1997b), with the result the
we cannot replicate their detailed classification of ALMP schemes, and can do no more
than distinguish between employment schemes and training schemes. The analysis that
follows, therefore, uses data from the time of interview only (and thus up to eight
consec-utive observations per individual), and can distinguish between participation in training
Table8summarises the pattern of participation in ALMP schemes between 1995 and
2000, the period of coverage where we have at least one prior year (to provide
infor-mation on status prior to participation) and one subsequent year (for inforinfor-mation on
medium-term outcome). Training schemes show a steady pattern of decline from about
0.5 percent to less than 0.25 percent of adults in the sample (weighted). Participation in
subsidised employment schemes, however, rises to a peak of over two percent in 1998,
falling back to 1.3 percent in 2000. The second panel gives unweighted numbers, which
are key to the suitability of this data set for evaluation of the effects of ALMP schemes – it
shows that we have about 650 person–wave observations of participation. Allowing for
some losses due to missing data, this represents an adequate number of cases to support
the statistical analysis reported below, though the numbers on training schemes suggest
that we may have less power to detect effects relating to them.
4.2 Medium-term outcome focus
Our focus for both research questions is on the medium term. This is true of the first
question to the extent that we are interested in the effect of prior poverty on the chance
of participation in an ALMP scheme the following year, and it is even more true of the
second question, where we are concerned with the consequences of participation for
ex-posure to poverty in the following years.
What we attempt to determine is to what extent participation in schemes has
con-sequences “down the line”, that is, after the scheme has completed. The main policy
justification for interventions of this nature is that they should have beneficial
conse-quences which persist after their completion, both at the individual and at the societal
or market level. We therefore look at the individual’s household poverty status in the
year after participation as our main outcome variable. Without data limitation, we might
like to look at longer periods, say two to three years after participation, and to insist that
the outcome was measured only if the individual was no longer a scheme participant4.
However, with only eight waves of data, we do not have sufficient observations of
per-sons entering and completing schemes to look at outcomes further in the future than one
year after participation.
4In theory, persons are not permitted to participate in successive schemes, but this is not always observed
4.3 Two analytical passes – descriptive and “pseudo-experimental”
The analysis reported below can be divided into two main sections: a primarily
descrip-tive exercise which addresses both questions, outlining the characteristics of those who
participate in schemes and their experiences after participation, using direct summaries
and logistic regression; and a more formal attempt to judge the true effect of
participa-tion, using propensity score analysis (see section4.4).
The aim of the descriptive analysis is multiple. First, and most generally, what are the
observed characteristics of those participating in schemes? These should correspond to
the formal recruitment requirements, but will also reflect the broader social context.
Sec-ond, to address our first research question, we investigate what role poverty might have
in predicting participation, once we account for characteristics such as unemployment
history, household structure and so on. Schemes will naturally have a target client`ele
which is poorer than the average by virtue of their weaker labour market positions, but
there are a number of potential mechanisms by which the population actually served may
be more or less poor than one would expect on the basis of their characteristics. On the
one hand, clients could be poorer than their observed characteristics would suggest, if
recruitment takes account of unmeasured characteristics, for instance, by selecting those
most in need of assistance. On the other hand, participants may have unobserved
charac-teristics that make them more likely to seek out advantageous opportunities, through for
example being “better” at interacting with the welfare system, or having other
character-istics that make them more likely to benefit from participation. We use logistic models of
participation to address these questions.
The descriptive analysis also makes a first pass at answering the second question:
once we control for their observed characteristics (which will make ex-participants much
poorer than the population average), do we see an effect on later poverty exposure? We
again use logistic regression, to assess the effect of participation on the odds of poverty,
controlling for observed characteristics. Insofar as the observed characteristics adequately
capture the difference between participants and non-participants, the parameter estimate
for participation can be regarded as an estimate of its net causal effect. However, if
participants are systematically different from non-participants in ways that are not
cap-tured by the variables in the model, this estimate will be seriously biased. If participants
carry some negative characteristics that we do not observe, such as poorer labour market
need, then they are also likely to perform less well in poverty terms afterwards than
non-participants with the same observed characteristics. This will lead to an estimate of the
effect of participation that is biased downwards. If on the other hand, they carry
unob-served positive characteristics, like a greater ability to work the system, better social
net-works, and so on, they are likely to have better poverty outcomes than non-participants.
In this case the estimate of the effect of participation will be unduly positive. Because
of this problem, the remainder of the analysis uses the pseudo-experimental approach of
propensity score matching.
4.4 Propensity Score analysis
Propensity score analysis is at heart a “pseudo-experimental” method. That is, it uses
ob-servational data – data collected from the world “as it is”, rather than generated through
manipulating the world in an experiment – to draw conclusions about causal
relation-ships in a manner as close as possible to the experimental method. True experiments will
typically take two groups, effectively identical through matching or randomisation, and
expose one to a “treatment”. Insofar as the groups are identical in all relevant respects,
and as their experience differs only in respect of exposure to the treatment, there is a very
strong rationale for identifying any difference in outcome as caused by the treatment.
By contrast, conventional use of observational data to assess the causal effects of
“treat-ments” such as ALMP schemes has a difficult problem: how to we compare the outcome
of the “treated” group with the outcome an identical but untreated group would have
had. This so-called “counterfactual” comparison is what experiments achieve by
match-ing groups prior to treatmatch-ing one of them. It is clear that a simple comparison of, say,
scheme participants with the population at large is not an adequate way of assessing this,
as participants have characteristics that will make them poorer than average even after
a beneficial scheme, so the usual strategy is to measure the difference in risk of poverty
between participants and non-participants, controlling for measured characteristics such
as age, gender, education, labour market history and so on. This is unsatisfactory in
two respects. First it involves assessing the effect of participation comparing participants
with the population at large, most of whom are not likely to benefit from or participate
in the schemes. A more relevant comparison would be between participants and
non-participants drawn from a population “eligible” for participation. The second way in
the outcome, resulting in a biased estimate of the effect of participation. A particularly
important mechanism by which this can take effect is selection, whereby unobserved
characteristics of individuals which predispose them to participation, also have an effect
on the outcome. Thus, for instance, welfare officers might be more likely to offer schemes
to persons they feel are more likely to benefit from them, on the basis of characteristics
(such as energy, initiative and so on) which are not captured in our data sets and which
will also raise the individuals’ labour market prospects in the medium term.
Correspond-ingly, if schemes are a “last resort” participation may tend to be more common among
those with the poorest labour market prospects. In the former case conventional
analy-sis will over-estimate the benefit of participation, confusing the effect of the selection of
slightly more able persons into schemes with the concrete effect of participation, while
in the latter it will under-estimate it. An excellent overview of the evaluation problem is
given inO’Neill(2000).
The propensity score approach attempts to solve both problems in a
pseudo-expe-rimental framework. It does this by matching participants in the sample with
non-participants who are as like them as possible, thus matching a treatment group with a
“control” group. Differences between them in outcome can thus be considered an
es-timate of the causal effect of treatment, as long as the matching process is adequate.
Matching can in principle be done across a range of variables – gender, age, labour
market experience and so on – but the more variables available the more difficult it is
to find a matching individual. What is novel about propensity score matching is not
the pseudo-experimental comparison but the means of matching individuals. Rubin has
demonstrated that it is in principle sufficient to match participants with individuals with
the same estimated probability of participation, but who did not in fact participate. This
estimated probability is calculated on the basis of a probit or logistic regression model
of participation. The use of this estimated probability or “propensity” is what gives the
method its name.
independent of program participation conditional on a set of observable
characteris-tics. It assumes there is a set of observable non-participation outcomeY0is independent
of participation status conditional onZ:
When we are concerned with estimating the effect of participation on participants
(“of treatment on the treated”), matching requires the assumption that once we condition
non-participation,Y0(which, critically, is not observed for programme participants, and
is thus the “counter-factual”), is independent of whether participation occurs (D):
E(Y0|Z,D =1) =E(Y0|Z,D =0) =E(Y0|Z)
(Smith and Todd,2005, equation 8).
In other words, once we control adequately for variables predicting participation, the
fact that someone did or did not actually participate does not give us any more
informa-tion about their probable outcome. Smith and Todd(2005, p. 313) further caution that matching is only justified when performed over thecommon support region. Observations
where the support ofZ does not overlap falloutsidethis area. In other words, matching
is valid only for those participants whose predicted probabilty of participation is
over-lapped by the distribution of predicted probability of non-participants.
When these assumptions hold, we can calculate the “effect of treatment on the treated”
as
TT =E(Y1−Y0|D =1) =E(Y1|D =1)−EZ|D=1{E(Y0|D =0,Z)}
The first term can be calculated from the observed outcomes for participants, and the
second from the matched non-participants (Smith and Todd,2005).
Matching is concerned solely with selection on observables. Propensity score
match-ing is an innovation ofRosenbaum and Rubin(1983) concerned with matching partici-pants and non-participartici-pants on their estimated probability of participation, P(X).They
show that when matching onX produces consistent estimates, so too does matching on
P(X), and matching onP(X)is much more efficient than matching on X, ifX contains
many variables.
The conditional independence assumption requires that all variables affecting both
participation and outcomes in the absence of participation be included in the matching.
Smith(2000) notes this requires careful thought as to what variables do and do not
af-fect participation and outcomes. It has been shown that matching reduced the raw bias
in earnings between participants and eligible non-participants – drawn from same local
labour market and with earnings information collected in the same way (Heckman et al.,
1997,1998). They further show remaining bias to be of the same magnitude as that of ex-perimental techniques.Dehejia and Wahba(1999) employ propensity scores to match on
However, this finding is contested bySmith and Todd(2005) who claim it is sensitive to
their choice of sample andX variables.
Smith(2000, p. 12) identifies important differences between matching and the
regres-sion approach to evaluation:
1. Matching is non-parametric, thereby avoiding functional form restrictions implicit
in linear regression
2. Evidence suggests avoiding these functional form restrictions can be important in
reducing bias (Dehejia and Wahba,1999;Smith and Todd,2005).
3. Importantly, matching highlights the “support” problem5. Since it may not always
be possible to match every value ofP(X)appearing in the participant group with
P(X)values from non-participants, the area of “common support” of matched
val-ues ofP(X)may not include all cases from the participant group (Heckman et al.,
1997;Dehejia and Wahba,1999). In contrast, impact estimates based on simple
re-gressions onX often ignore this problem.
We are also mindful of some caveats relating to matching. Specifically:
1. Matching does not remove the problem of variable selection.Heckman et al.(1997) have shown estimates produced by matching to be sensitive to the choice of
vari-ables used to constructP(X).
2. The “balancing test” ofRosenbaum and Rubin(1983), as implemented byDehejia and Wahba (1999) and Lechner (1999), will help to determine whether or not to
include higher-order interaction terms for a givenX. But it does not aid in selecting
variables to include inX to start with (Smith and Todd,2005).
3. The choice of matching method may make a difference in small samples. The
avail-able choices are discussed in Heckman et al. (1997). In this study we implement Nearest Neighbour matching to approximate a counterfactual for the treated. NN
may be implemented with or without replacement – where a non-participant may
be matched/used more than once.
5The support of a distribution is the set of values for which it has a positive density (or non-zero
4. The estimation of propensity scores adds variation beyond the normal sampling
variation. According toSmith and Todd(2005, p. 13), nearest neighbour matching with one matched comparison may result in understated standard errors.
5
Descriptive analysis
5.1 Poverty and participation rates
Our first research question concerns the nature of the population that ALMP programmes
target. The programmes are designed to target the long-term unemployed, those with
poor skills, those with poor labour market histories. This will clearly involve ade facto
focus on low-income groups, but it remains an empirical question the extent to which
participation is linked to, say, unobserved advantage (e.g., a better understanding of how
the welfare system works) or disadvantage (e.g., unobserved labour market difficulties
which make recruitment more likely).
Table 9reports the percentage participation in schemes, broken down by a number
of factors (measured the year before). The data are weighted cross-sectionally and all
available observations are used, so the numbers represent person–years rather than
in-dividuals. Almost 2 percent of observations are in schemes, with more than four fifths
being in employment as distinct from training schemes. The bivariate relationships may
well be misleading but it is interesting to examine the effect of gender, age, household
structure and employment status as well as of poverty on participation. Gender has a
small but significant effect, males being more likely to participate overall but females
more likely to take training courses. Marital status has interesting effects, with the
sep-arated and divorced having quite high participation in employment schemes (though,
particularly for divorce, the number of observations is quite small). The widowed have
low participation overall and the never-married have high rates of training – both effects
most likely explained by age. Having a pre-school age child in the house, and having
children in general, raise the rate of participation in employment schemes and
gener-ally speaking depress participation in training, though the effects by number of children
are somewhat unstable. Age shows interesting patterns: the youngest and oldest are least
likely to participate in employment schemes, while training schemes are strongly skewed
to the young, being dominated by the under-30s. This is unsurprising since the
Table 9: Predictors of participation in employment schemes, training schemes and all schemes, weighted data, pooled across years
Percent participating in scheme Person–years Employment Training All
Sex of respondent
Male 1.68 .28 1.96 20750
Female 1.53 .38 1.91 21861
Marital status
Married 1.51 .17 1.67 23675
Separate 2.91 .34 3.25 1006
Divorced 8.06 0 8.06 208
Widowed .04 .02 .06 3052
Never married 1.9 .67 2.57 14669 Preschool child in house
None present 1.49 .35 1.84 37349 Preschooler present 2.43 .19 2.61 5262 Number of children
None 1.02 .45 1.47 21029
1 2.35 .15 2.49 6970
2 2.1 .21 2.31 7097
3 1.99 .24 2.23 4469
4 2.13 .46 2.59 1786
5 2.79 .18 2.97 652
6 1.11 .32 1.43 377
7 .62 .85 1.47 183
8+ 9.44 0 9.44 48
Age group
Under 20 .31 1.44 1.75 3221
20–29 1.76 .56 2.32 8338
30–39 2.28 .21 2.5 8657
40–49 2.42 .27 2.68 7687
50–59 2.03 .14 2.17 5869
60–69 .54 .04 .58 4455
70 plus 0 0 0 4384
Educational achievement
Minimal 1.77 .17 1.95 9550
Incomplete secondary 2.24 .45 2.69 14458 Complete secondary 1.48 .43 1.9 12008 Diploma/Degree .18 .15 .33 6596 Employment status (t−1)
Employed .25 .09 .33 21001
Unemployed 5.9 1.39 7.29 2466
Employment scheme 54.85 .47 55.32 645 Training scheme 8.74 9.06 17.8 185 Non-employed .63 .38 1.01 18313 Poor att−1
Not poor 1.32 .28 1.6 34931
Poor 2.88 .57 3.45 7680
apprenticeships, vocational training, Youth Reach and the Vocational Training
Oppor-tunity Scheme. When we look at education we find that the only group to be above
average in participation in both types of scheme are those with incomplete secondary
education. Those with the poorest qualifications have surprisingly lower participation,
especially in training schemes – this is most likely an age effect again, as this group will
be predominantly older. Interestingly, those with complete secondary education have a
disproportionately high takeup of training schemes, while predictably those with some
third level education have low take up overall.
Employment status is a problematic predictor. While employment and training
sch-emes are mostly of relatively short duration, and are not intended to be “chained”, we
find in practice that being observed in a scheme last year is very highly correlated with
being in one this year (some Community Employment schemes do have durations in
ex-cess of twelve months). To some extent this may be due to the survey mechanics, where
the gap between successive interviews is a year on average but some of the time can be
much less (a late interview one year followed by an early one in the next year’s
field-work). However, it is also due in large part to persons remaining in the system for
peri-ods well in excess of 12 months. Thus more than half of those observed on employment
schemes are still on employment schemes a year later, and those on training schemes
have about an 18 percent chance of being in a scheme the following year, approximately
half and half training and employment. Being employed or not in the labour market are
relatively stable states, with low rates of flow into schemes, but the unemployed have
high rates of entry to both types.
Finally, we look at poverty: how does one’s poverty status last year affect
participa-tion on a scheme this year? Not taking account of any other variables, those with less
than 60 percent of median income last year are approximately twice as likely to be on a
scheme as those above the line. On its own poverty is a predictor of participation, but
it is not clear whether this can be “explained away” in terms of gender, employment
status, age, household structure and so on. To address this issue we now move on to a
multivariate analysis.
5.2 Do schemes “target” the poor?
As we have seen, a range of factors, some of which are also correlates of poverty, are
poverty has an additional effect on top of the effects of these covariates, we fit a series of
logistic regressions. If the net effect of poverty on participation is zero, then we can say
that we have accounted for the apparent effect of poverty on participation. If it is positive,
that would suggest that schemes target or are more attractive to persons in poverty, over
and above the non-poor with the similar measured characteristics. If it is negative, it
would suggest that schemes preferentially target or are attractive to non-poor persons.
As is apparent from Table9, training schemes and employment schemes recruit
dif-ferent types of individual. We therefore model the two destinations separately. Indeed,
we would like to disaggregate further, ideally following the fourfold classification of
O’Connell and McGinnity(1997a,b) outlined in Table 1, but are constrained to distin-guishing between training and subsidised employment by the numbers and the level of
detail available in the data set. In what follows we present paired logistic models,
predict-ing participation at wavetusing characteristics measured at wavet−1(we use robust
standard errors that take account of the presence of repeated observations per
individ-ual). The variables we consider are largely the same as in Table9: gender, marital status,
age (in 10-year bands – for this analysis the age range is restricted to 16 to 59), whether
there is a preschool child present, the number of children in the household, highest
edu-cational qualification, employment status and poverty status. We additionally include an
index of occupational quality, the ISEI score, set to zero for those without an occupation
(Ganzeboom et al.,1992;Ganzeboom and Treiman,1996), and an index of recent labour market history6.
What is first evident from the table is that there are substantial differences between
employment schemes and training as destinations, and that the model pooling them is in
some respects an uninformative average. This is particularly evident in the age estimates,
where we see two distinctly different and significant profiles for the specific destinations
collapsing a much weaker pattern for the combined model.
Working through the table from the top, we see first that while females are estimated
to be more likely to participate, this effect is very far from significance. Compared with
those currently married, the never-married have enhanced rates of participation in both
types of schemes, and the divorced of participating in employment schemes. The age
profiles already referred to are particularly distinct: as seen in Table 9 recruitment to
6This is calculated as the proportion of the last 24 months spent unemployed. In order not to lose cases