FORMULATION AND OPTIMIZATION OF NANOSUSPENSION FOR IMPROVING SOLUBILITY
AND DISSOLUTION OF GEMFIBROZIL
SANJEEVANI S DESHKAR*, KIRAN G SONKAMBLE, JAYASHRI G MAHORE
Department of Pharmaceutics, Dr. D.Y. Patil Institute of Pharmaceutical Sciences and Research, Pimpri, Pune - 411 018, Maharashtra, India. Email: [email protected]
Received: 16 April 2018, Revised and Accepted: 10 September 2018 ABSTRACT
Objective: The study aims at the formulation and optimization of gemfibrozil (Gem) nanosuspension (NS) for improving its solubility and dissolution rate. Method: Gem NS was prepared by precipitation-ultrasonication method using ethanol as solvent, water as anti-solvent, and polyvinyl alcohol (PVA) as a stabilizer. A Box–Behnken design was employed to study the effect of the independent variables, Gem concentration in the organic phase (X1), PVA
concentration (X2) and sonication time (X3) on the dependent variable, drug release after 90 min (Y). The resulting data were statistically analyzed and
subjected to 3D response surface methodology to study the influence of variables on the response. NS was evaluated for particle size, zeta potential, solubility and in vitro drug release and characterized using Fourier transform infrared spectroscopy (FTIR), differential scanning calorimetry (DSC), and X-ray diffractometry (XRD).
Results: On the basis of the evaluation, NS4 formulation (with 80 mg/ml Gem, 0.5% PVA concentration, and 20 min of sonication time) demonstrated
highest drug content with a particle size of 191.0 nm and zeta potential of −12.0 mV. Dissolution profiles of NS indicated 2.5-fold increase in drug
release than pure drug. NS demonstrated 5- and 9-fold increase in solubility, in water, and phosphate buffer (pH 7.5), respectively, pure drug. DSC and XRD studies indicated changes in the crystallinity of Gem during NS formulation. No chemical change was evident in NS as indicated by FTIR. Conclusion: Gem NS formulation could serve as a promising approach for improving its solubility and dissolution rate.
Keywords: Gemfibrozil, Nanosuspension, Precipitation-ultrasonication method, Solubility enhancement, Dissolution.
INTRODUCTION
Oral delivery of drug entities is often limited due to poor drug solubility and lower bioavailability. More than 40% of newly discovered drugs are poorly soluble in water [1]. As solubility plays a crucial role in drug formulation, poor drug solubility has limited the commercialization of many drugs. Extensive efforts have been made to enhance the solubility of drugs by conventional methods, such as micronization [2], use of surfactants [3], and solubilizers [4], cosolvency [5], cocrystallization [6], solid dispersions [7], self micro emulsifying drug delivery systems [8], complexation [9], and polymorphism [10]. One of the most popular approaches being investigated presently is the formulation of nanocrystals or nanosuspension (NS). During the formulation of NS, a drug is reformulated and as per FDA is considered as a new drug that can be patented and is not considered as generic [11].
Considering the limitations of alternative approaches such as lack of universal applicability to all drugs as in inclusion complexes and microemulsion [12], nanoparticle engineering remains as a preferable choice for pharmaceutical application and may serve as an effective tool for “brick dust candidates” [13]. NS is formulated by two major approaches; top down and bottom up technology [14]. Top-down approach depends on a reduction in the size of large crystalline particles to the desired size range. Bottom-up approach involves solubilization of drug in a solvent and further addition of it to a nonsolvent to obtain precipitated nanocrystals under controlled conditions in the presence of stabilizer [15]. These technologies have been used to increase the solubility and bioavailability of nitrendipine [16], simvastatin [17], carvedilol [18], efavirenz [19], risperidone [20], etc.
Gemfibrozil (Gem) is a widely used antihyperlipidemic agent classified as fibric acid derivative. It increases the activity of extrahepatic lipoprotein
lipase, resulting in the lipolysis process [21]. Gem activates peroxisome proliferator-activated receptor-alpha transcriptor factor ligand, a receptor that is involved in the metabolism of carbohydrates and fats and also in adipose tissue distribution [22]. This results in increased synthesis of lipoprotein lipase thereby increasing the clearance of triglyceride. Gem belongs to BCS Class II (log P 3.6) with poor solubility and high permeability resulting in limited and variable bioavailability [23,24].
In the present study, an attempt has been made to formulate and evaluate the NS of Gem using nanoprecipitation-ultrasonication method for improved solubility. Gem NS was evaluated for particle size, drug content, drug release, zeta potential, morphology, solubility, and in vitro drug release. NS was characterized using Fourier transform infrared spectroscopy (FTIR), differential scanning calorimetry (DSC), and X-ray diffractometry (XRD).
MATERIALS AND METHODS Materials
Gem was obtained from Aurobindo Pharma, Hyderabad, as a gift sample. Tween 20 and polyvinyl alcohol (PVA) were purchased from Loba Chemie, Mumbai. All the solvents and other chemicals used in the study were of analytical grade.
Preparation of Gem NS
Gem NS was prepared by antisolvent precipitation-ultrasonication method [25]. Briefly, Gem was dissolved completely in ethanol (2 ml) to prepare the organic phase, and the solution was then filtered through
a 0.45 μm to remove the precipitated impurities. The antisolvent phase
was prepared separately by dispersing stabilizer PVA in distilled water. At 4°C, 2 ml of organic solution was injected dropwise by syringe into 20 ml of antisolvent using mechanical stirrer (Remi, RQ 126 D, © 2019 The Authors. Published by Innovare Academic Sciences Pvt Ltd. This is an open access article under the CC BY license (http://creativecommons. org/licenses/by/4. 0/) DOI: http://dx.doi.org/10.22159/ajpcr.2019.v12i1.26724
India) at 4000 rpm for 1 h. The resultant NS was ultrasonicated with a probe sonicator (PCI analytics, PKS 250 F, India) at 20–25 kHz for different time periods. During the ultrasonication, the temperature was controlled at 4–8°C using ice water bath.
Optimization of NS by Box–Behnken design
Box–Behnken design was employed with 17 trial runs to study the impact of three factors, each at three levels, on the key response variable. One independent variable (X1) was Gem concentration in organic phase
(mg/ml) at levels 20, 50, and 80 mg/ml. Second independent variable (X2) was PVA concentration at 0.1, 0.3, and 0.5% and third variable (X3)
was sonication time at 10, 20, and 30 min (Table 1). The effect of these variables on drug release after 90 min (Y) was evaluated. The resulting data were fitted into Design Expert software (Stat-Ease, version 9.0, USA) and analyzed statistically using analysis of variance (ANOVA). The data were also subjected to 3D response surface methodology to determine the influence on the dependent variable.
To perform solid-state characterization by FTIR, DSC, and XRD; NS was
lyophilized. Initially, and Gem NS was frozen at −20°C for 24 h followed
by lyophilization (Labconco, FreeZone 2.5, USA).
Evaluation of Gem NS
Percent transmittance
To determine the physical stability of NS, the optical transmittance was measured at 600 nm using a UV spectrophotometer (Shimadzu, 1700, Japan).
Particle size analysis and zeta potential
The particle size analysis of NS was performed using a particle size analyzer (Malvern, Nano Series ZS, UK) [26]. NS was diluted with water and placed in the ultrasonicator bath for 5 min to prevent the agglomeration. All the measurements were carried out in triplicate at a temperature of 25°C and a fixed angle of 90°. Mean particle size and particle size distribution curves were recorded.
Zeta potential of Gem NS was measured using Zetasizer (Malvern, Nano Series ZS, UK). NS samples (1 ml) were diluted with conducting solution before measurements.
FTIR
Gem, its physical mixture with PVA and lyophilized Gem NS was mixed with potassium bromide. The FTIR spectra of these mixtures were recorded using a FTIR spectrometer (Shimadzu, 8400S, Japan) with DRS attachment [27].
DSC
The physical state of Gem in lyophilized NS was characterized by DSC thermogram analysis. The DSC patterns of Gem, its physical mixture with PVA and NS was recorded (PerkinElmer, 4000, UK). Sample analysis was performed in an aluminum pan, under nitrogen Purging with a flow rate of 20 ml/min and heating range as 30–300°C with a rate of heating, 10°C/min [28].
Table 1: Data for independent variables and response for Box–Behnken design Batch
code Factor Xconcentration in organic 1: Gem phase (mg/ml)
content (%)* Stability after 24 h**
NS1 20 0.1 20 81.3±3.2 72.2±1.2 (+)
*Mean±SD (n=3), **Stability after 24 h, (−) high precipitation, (+) low precipitation, (++) opalescent and stable. SD: Standard deviation, PVA: Polyvinyl alcohol, NS: Nanosuspension
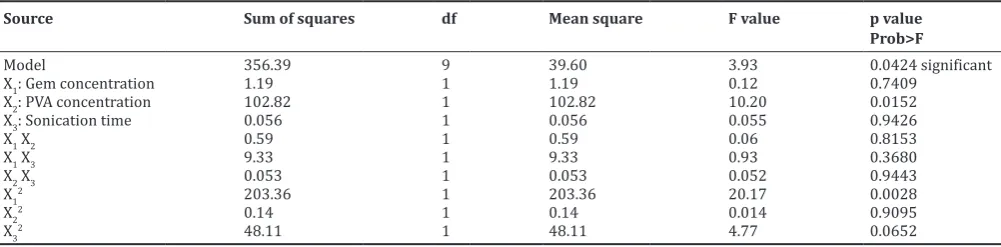
Table 2: Data of ANOVA analysis for Gem NS
Source Sum of squares df Mean square F value p value
Prob>F
Model 356.39 9 39.60 3.93 0.0424 significant
X1: Gem concentration 1.19 1 1.19 0.12 0.7409
X2: PVA concentration 102.82 1 102.82 10.20 0.0152
X3: Sonication time 0.056 1 0.056 0.055 0.9426
X1 X2 0.59 1 0.59 0.06 0.8153
XRD
XRD study was performed in X-ray diffractometer (Brucker, D 8
advanced, India) using Cu K 2α rays with a voltage of 40 kV and a
current of 25 mA to estimate the effect on the crystalline structure of
lyophilized NS. Samples were scanned for 2Ɵ from 10 to 80°. Diffraction
pattern for pure Gem, physical mixture and NS were analyzed [29].
Drug content
For determination of drug content, NS was centrifuged at 300 rpm for 5 to 10 min to remove the precipitated drug. After removal of precipitate, 1 mL of NS was taken and diluted with methanol. The absorbance was taken at 276 nm in a UV spectrophotometer (Shimadzu, 1700, Japan) and drug concentration was determined by a standard curve of the drug in methanol[30].
In vitro drug release
The dissolution of Gem from pure drug and NS was performed using modified dissolution assembly, USP apparatus type I (Veego, DT60, India) by dialysis method [31]. The dialysis bag (mol wt cutoff, 11 KDa) was soaked overnight in dissolution medium before dialysis to ensure thorough wetting of the membrane. Dissolution medium used was 7.5 pH phosphate buffer. Pure drug and equivalent quantity of NS were placed in dialysis bags, and the closed ends of bags were tied to basket shaft. The shaft with bag was then inserted into the dissolution medium containing 100 ml of 7.5 pH phosphate buffer at 37±0.5°C and dissolution was performed with stirring speed of 50 rpm for 90 min. An aliquot of 5 ml was withdrawn at an interval of 15 min, suitably diluted, filtered, and analyzed for the content of Gem by UV-spectrophotometer (Shimadzu, 1700, Japan) at 276.0 nm. Aliquot was replaced with an equivalent volume of fresh dissolution medium to compensate for the loss due to sampling. The cumulative drug release for pure drug and NS formulation was calculated and compared for 90 min.
Saturation solubility study
The saturation solubility of pure Gem and lyophilized Gem NS was determined in water and phosphate buffer pH 7.5 [32]. Excess amounts of samples were added into 10 ml solvent in a capped vial which was then placed in a controlled temperature shaking water bath at 37°C, leaving them to dissolve for 72 h. Then, samples (1 ml) were withdrawn and centrifuged at 3000 rpm for 20 min. The obtained supernatant sample was assayed using a UV-Visible spectrophotometer (Shimadzu, UV-1700, Japan) at 276 nm [33,34]. The experiment was conducted in triplicate.
RESULTS
Effect of independent variables on drug release
The results of the dependent variable, drug release after 90 min (Y) from 17 experiments is shown in Table 1. Equation 1 was obtained from multiple linear regression analysis of data.
Drug release after 90 min (Y)=81.26+0.39 X1+3.58 X2+0.084X3+ 0.39X1X2−1.53X1X3+0.12X2X3+6.95X12+0.18X22−3.38X32 (1)
To study the significance of regression coefficients, ANOVA was followed by student t-test. Table 2 indicates data of ANOVA analysis.
The drug content of NS formulation was found to be in the range of 43.7–96.2%. During optimization, formulations with high drug loading and low precipitation (+) or opalescent appearance (++) after 24 h were considered.
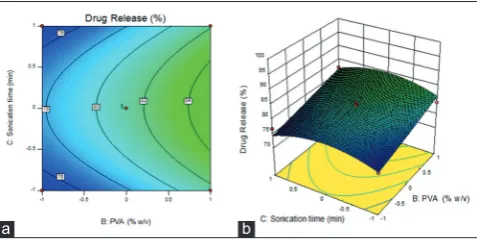
Fig. 1 shows the effect of PVA concentration and Gem concentration on drug release. Fig. 2 indicates the influence of Gem concentration and sonication time on the drug release from NS formulations. Fig. 3 indicates the effect of PVA concentration and sonication time on the drug release from NS formulation.
Particle size and zeta potential
The particle size of NS formulation (NS4) was found to be 191.0 nm with a polydispersity index (PDI) of 0.28 (Fig. 4). The zeta potential of
NS formulation was found to be −12.0 mV (Fig. 5).
Infrared spectroscopy
To observe any major chemical change after formulation of NS, FTIR analysis of Gem, its physical mixture with PVA as stabilizer and NS formulation was carried out and shown in Fig. 6.
DSC
Fig. 7 indicates DSC of Gem, its physical mixture with PVA and lyophilized NS formulation.
XRD
To study the changes occurred in crystallinity of Gem during formulation of NS, XRD study was carried out. Fig. 8 indicates a XRD pattern of Gem, physical mixture of Gem and PVA and lyophilized NS formulation.
In vitro drug release
The in vitro drug release studies of NS formulation and Gem pure drug was carried out in USP type I apparatus using dialysis bag method in
Fig. 1: (a) Counterplot (b) response surface plot showing the influence of gemfibrozil concentration and polyvinyl alcohol
concentration on the drug release from nanosuspension
Fig. 2: (a) Counterplot (b) response surface plot showing the influence of gemfibrozil concentration and sonication time on the
drug release from nanosuspension formulations
Fig. 3: (a) Counterplot (b) response surface plot showing the influence of polyvinyl alcohol concentration and sonication time
on the drug release from nanosuspension formulation
a b
a b
phosphate buffer pH 7.5. The drug release profile of the optimized Gem NS (NS4) and Gem pure drug is shown in Fig. 9.
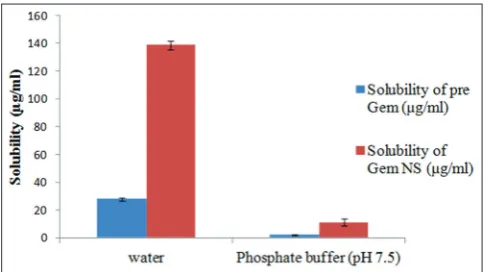
Saturation solubility
The solubility of optimized NS formulation, NS4, and pure Gem was carried out in water and in phosphate buffer pH 7.5 (Fig. 10).
DISCUSSION
Effect of independent variables on drug release
For optimization of formulation variables for Gem NS, Box–Behnken design was applied with 17 trial runs. The data from Table 1 were used to generate a quadratic equation from “Design Expert 9.0”. Mathematical relationship was generated using MLRA for the studied response variable (Equation 1).
The significant test for regression coefficients was carried out by applying a student t-test. If p>F values were >0.05, the coefficients were not considered as significant. The lower value of p>F (0.042) indicated the significance of applied model (Table 2). From ANOVA data, it was observed that the effect of PVA concentration was significant on drug release. This was evident from p>F value <0.05 and higher F value
Fig. 4: Particle size analysis of gemfibrozil nanosuspension
Fig. 5: Zeta potential analysis of gemfibrozil nanosuspension
Fig. 6: Infrared spectroscopy of (a) pure gemfibrozil (Gem), (b) physical mixture, and (c) Gem nanosuspension formulation
Fig. 7: Differential scanning calorimetry of (a) pure gemfibrozil (Gem), (b) physical mixture, and (c) Gem nanosuspension
formulation
(10.2). Higher values of p>F in case of independent variables, Gem concentration (X1) and sonication time (X3) indicated that the effect of
these variables on drug release was not significant. Higher values of p>F for interactive terms of variables (X1 X2, X1 X3, and X2 X3) indicated that
there was no interactive effect of independent variables. Lower value of p>F (0.0028) for the quadratic term (X12) indicated the nonlinear effect
Gem concentration.
Influence of Gem concentration and PVA concentration on the drug release
With the increase in drug concentration in organic phase from 20 to 50 mg/ml, drug release was found to be decreased (Fig. 1). This could be due to increase in particle size of NS with increase in the drug concentration leading to lower surface area and lower drug release. With further increase in drug concentration from 50 to 80 mg/ml, drug release was found to be increased. At higher drug concentration, the degree of supersaturation was high. This increased the rate of precipitation at a faster rate. The drug was precipitated out in amorphous form resulting in higher drug release.
Increase in PVA concentration was found to be increasing the drug release. This effect was pronounced at higher drug concentration. This could be attributed to the ability of PVA to form a coat around the crystal nuclei and retarding the excess growth of crystals. Gem has –COOH group that can form hydrogen bonds with hydrophilic PVA. This helps PVA to approach easily to growing crystal nuclei and thus controlling the size of drug crystal. Lower particle size could have resulted in an increase in drug release.
Influence of Gem concentration and sonication time on drug release
From Fig. 2, it is evident that with an increase in drug concentration from 20 to 50 mg/ml, at lower sonication time (10 min), drug release was found to be decreased. With further increase in drug concentration from 50 to 80 mg/ml, drug release was found to be increased.
It was observed that the increase in sonication time resulted in increased drug release from NS. This could be due to a decrease in particle size with increased sonication that might have led to increased surface area resulting in increased drug release. At higher drug concentration, the effect of sonication time was not significant, and lower particle size was not achieved.
Influence of PVA concentration and sonication time on drug release
From Fig. 3, it was observed that with an increase in PVA concentration, drug release was found to be increased at all levels of sonication time. At all levels of PVA concentration, increase in sonication time from 10 to 20 min, increased the drug release, however, with further increase in sonication time to 30 min, decreased the drug release. This could be due to the agglomeration of particles due to excessive sonication. Increase in sonication increases the free energy of the system drastically, thus, resulting in thermodynamic instability in NS.
Particle size and zeta potential
As the physical stability of NS depends on particle size, lower size (191.0 nm) may lead to greater stability of NS. PDI is a measure of particle size distribution. Lower values of PDI (0.28) indicated narrower particle size distribution resulting in greater physical stability.
Zeta potential is a measure of surface charge on particles. Higher zeta potential values indicate lower agglomeration and greater stability in a colloidal dispersion. Slightly lower values of the zeta potential of
NS (−12.0 mV) could be attributed to nonionic stabilizer PVA forming
a coat around nanoparticle of Gem. This nonionic coat is responsible for the formation of the solvent sheath around the particle rendering additional stability to NS.
Infrared spectroscopy
The characteristic absorption peak for Gem was observed as –C-H stretch at 3045.70/cm, -C=O stretch at 1836.28/cm, and -C-O stretch at 1049.31/cm, respectively (Fig. 6). FTIR of a physical mixture or NS revealed no major shift at the wavelengths when compared to FTIR of Gem. This indicated that no chemical change was occurred in the formulation during NS formulation.
DSC
DSC studies of drug exhibited a sharp peak at 60.8°C which indicates the melting point of Gem. The presence of a sharp peak indicates the crystalline nature of the drug. DSC of physical mixture and NS formulation showed an endothermic peak at 221.9°C indicating the presence of PVA. DSC of physical mixture retained the endotherm of the drug. DSC of formulation indicated a very small peak at 55.4°C representing a major change in crystallization of Gem during NS formulation. The presence of small and wide endothermic peak confirms conversion of Gem to amorphous form.
XRD
XRD pattern of pure Gem indicated intense peaks at 11.5, 11.6, and 11.9° which were characteristic of pure drug Gem. These intense peaks indicated the crystalline nature of the drug. XRD of physical mixture retained an intense peak of Gem and also showed additional intense peaks at 18.3, 24.2, and 24.30° representing the presence of PVA. XRD of formulation indicated a significant reduction in the intensity of Gem peaks at 11.5, 11.5, and 11.9°. This could be due to partial amorphization of the drug during the process of NS. As the intensity of peak was not completely masked, there was the possibility of the presence of drug in nanocrystalline form.
In vitro drug release
The drug release from NS formulation was found to follow biphasic release pattern; initial burst release followed by sustained drug release over 90 min of dissolution study. Initial burst release is due to small sized amorphous particles and crystal nuclei. Slow drug release could be due to agglomerated particles found during the process.
Fig. 9: Comparative in vitro drug release profile of nanosuspension and pure gemfibrozil. *Mean±standard deviation (n=3)
Drug release from NS4 formulation was found to be highest than other formulations. NS4 formulation released 57.2±1.5% after 15 min of dissolution and 96.2±1.72% after 90 min of dissolution. The drug content and physical stability of this formulation were high. When dissolution profile of pure drug was compared with NS4 formulation (Fig. 9), it was observed that there was 2.5-fold increase in drug release after 15 min of dissolution whereas after 90 min of dissolution there was 1.5-fold increase in drug release. This could be due to change in crystallinity of drug during NS process. During the NS preparation, Gem was dissolved in ethanol and was further precipitated out in antisolvent in the presence of stabilizer which could have changed the drug from crystalline to amorphous form. This was in agreement with the DSC and XRD results.
Saturation solubility
Formulated Gem NS showed high solubility in water as compared to the pure drug (Fig. 10). The increase in solubility was approximately 5- and 9-fold in water and phosphate buffer, respectively. This was attributed to a reduction in particle size and transition to an amorphous state of the drug during NS formulation.
CONCLUSION
Gem NS was successfully prepared by a precipitation-ultrasonication method with a lower particle size (191.0 nm) and narrow size distribution. A change in drug crystallinity during NS formulation was evident from DSC and XRD study. FTIR revealed no chemical change in NS formulation. Gem NS exhibited markedly enhanced solubility and dissolution rate compared to pure drug. The present study demonstrated NS as a potential drug delivery system for improving solubility and dissolution rate of the poorly soluble drug.
ACKNOWLEDGMENT
The authors are thankful to Aurobindo Pharma, Hyderabad, for providing the gift sample of Gemfibrozil. Authors are also thankful to the University of Pune for providing the facilities of DSC and XRD.
AUTHORS’ CONTRIBUTION
First author conceived the idea, second author carried out the experiments under the supervision of first author. First author drafted the manuscript with the help of second and third author.
CONFLICTS OF INTEREST
Authors declare no conflicts of interest.
REFERENCES
1. Patravale VB, Date AA, Kulkarni RM. Nanosuspensions: A promising drug delivery strategy. J Pharm Pharmacol 2004;56:827‑40.
2. Raju A, Reddy AJ, Satheesh J, Jithan AV. Preparation and characterisation of nevirapine oral nanosuspensions. Indian J Pharm Sci 2014;76:62‑71.
3. Thadkala K, Sailu C, Aukunuru J. Formulation, optimization and evaluation of oral nanosuspension tablets of nebivolol hydrochloride for enhancement of dissoluton rate. Der Pharm Lett 2015;7:71‑84. 4. Khadka P, Ro J, Kim H, Kim I, Kim J, Kim H. Pharmaceutical particle
technologies: An approach to improve drug solubility, dissolution and bioavailability. Asian J Pharm Sci 2014;9:304‑16.
5. Khan A, Iqbal Z, Shah Y, Ahmad L, Ismail, Ullah Z, et al. Enhancement of dissolution rate of class II drugs (Hydrochlorothiazide); A comparative study of the two novel approaches; solid dispersion and liqui‑solid techniques. Saudi Pharm J 2015;23:650‑7.
6. Krishna K, Kumar G. Nanosuspensions: The solution to deliver hydrophobic drugs. Int J Drug Deliv 2011;3:546‑57.
7. Kavitha V, Neethu C, Dineshkumar B, Krishnakumar K, John A. Nanosuspension formulation : An improved drug delivery system. Nanosci Nanotechnol Int J 2014;4:1‑5.
8. Singare D, Marella S, Gowthamrajan K, Kulkarni G, Vooturi R, Rao P. Optimization of formulation and process variable of nanosuspension: An industrial perspective. Int J Pharm 2010;402:213‑20.
9. Lakshmi P, Kumar G. Nanosuspension technology : A review. Int J
Pharm Pharm Sci 2010;2:35‑40.
10. Geetha G, Poojitha U, Arshad K, Khan A. Various techniques for preparation of nanosuspension‑a review. Int J Pharm Res Rev 2014;3:30‑7.
11. Sinha B, Muller R, Muschwitzer J. Bottom‑up approaches for preparing drug nanocrystals: Formulations and factors affecting particle size. Int J Pharm 2013;453:126‑41.
12. Bhalekar M, Upadhaya P, Reddy S, Kshirsagar S, Madgulkar A. Formulation and evaluation of acyclovir nanosuspension for enhancement of oral bioavailability. Asian J Pharm 2014;8:110‑8. 13. Yang J, Young A, Chiang P, Thurston A, Pretzer D. Fluticasone and
budesonide nanosuspensions for pulmonary delivery: Preparation, characterization, and pharmacokinetic studies. J Pharm Sci 2008;97:4869‑78.
14. Sun W, Mao S, Shi Y, Li L, Fang L. Nanonization of itraconazole by high pressure homogenization: Stabilizer optimization and effect of particle size on oral absorption. J Pharm Sci 2011;100:3365‑73. 15. Chattopadhyay P, Gupta R. Production of griseofulvin nanoparticles
using supercritical CO2 anti solvent with enhanced mass transfer. Int J
Pharm 2001;228:19‑31.
16. Pignatello R, Ricupero N, Bucolo C, Maugeri F, Maltese A, Puglisi G, et al. Preparation and characterization of eudragit retard nanosuspensions for the ocular delivery of cloricromene. AAPS PharmSciTech 2006;7:E27.
17. Xia D, Quan P, Piao H, Piao H, Sun S, Yin Y. Preparation of stable nitrendipine nanosuspensions using the precipitation‑ultrasonication method for enhancement of dissolution and oral bioavailability. Eur J Pharm Sci 2010;40:325‑34.
18. Pandya V, Patel J, Patel D. Formulation, optimization and characterization of simvastatin nanosuspension prepared by nanoprecipitation technique. Der Pharm Lett 2011;3:129‑40.
19. Liu D, Xu H, Tian B, Yuan K, Pan H, Ma S. Fabrication of carvedilol nanosuspensions through the anti‑solvent precipitation–ultrasonication method for the improvement of dissolution rate and oral bioavailability. AAPS PharmSciTech 2012;13:295‑304.
20. Salem HF, Kharshoum RM. Nanoprecipitation technique for preparation of sterically stabilized risperidone nanosuspension: In vitro and in vivo
study. Int J Pharm Pharm Sci 2016;8:136‑42.
21. Taneja S, Shilpi S, Khatri K. Formulation and optimization of efavirenz nanosuspensions using the precipitation‑ultrasonication technique for solubility enhancement. Artif Cells Nanomed Biotechnol 2016;44:978‑84.
22. Patel R, Baviskar T, Rajput A. Development and in-vivo characterization of SMEDDs (self‑microemulsifying drug delivery system) for gemfibrozil. Int J Pharm Pharm Sci 2013;5:793‑800.
23. Talib H, Watersa L, Gareth M, Parkes G. Microwave processed solid dispersions for enhanced dissolution ofgemfibrozil using non‑ ordered mesoporous silica. Colloids Surf A Physicochem Eng Asp 2017;520:428‑35.
24. Huang QP, Wang JX, Chen GZ, Shen ZG, Chen JF, Yun J. Micronization of gemfibrozil by reactive precipitation process. Int J Pharm 2008;360:58‑64.
25. Villar AM, Naveros BC, Campmany AC, Trenchs MA, Rocabert CB, Bellowa LH. Design and optimization of self‑nanoemulsifying drug delivery systems (SNEDDS) for enhanced dissolution of gemfibrozil. Int J Pharm 2012;431:161‑75.
26. Prakash S, Vidyadhara S, Sasidhar RL, Abhijit D, Akhilesh D. Development and characterization of ritonavir nanosuspension for oral use. Der Pharm Lett 2013;5:48‑55.
27. Agarwal V, Bajpai M. Preparation and optimization of esomeprazole nanosuspension using evaporative precipitation‑ultrasonication. Trop J Pharm Res 2014;13:497‑503.
28. Das S, Suresh PK. Nanosuspension: A new vehicle for the improvement of the delivery of drugs to the ocular surface. Application to amphotericin B. Nanomedicine 2011;7:242‑7.
29. Mishra B, Sahoo J, Dixit P. Formulation and process optimization of naproxen nanosuspensions stabilized by hydroxy propyl methyl cellulose. Carbohydr Polym 2015;127:300‑8.
30. He W, Lu Y, Qi J, Chen L, Yin L, Wu W. Formulating food protein‑ stabilized indomethacin nanosuspensions into pellets by fluid‑bed coating technology: Physical characterization, redispersibility, and dissolution. Int J Nanomedicine 2013;8:3119‑28.
31. Kayser O. Nanosuspensions for the formulation of aphidicolin to improve drug targeting effects against Leishmania infected macrophages. Int J Pharm 2000;196:253‑6.
state characterization of nanocrystals for solubility enhancement of Quetiapine fumarate. Int J Pharm Pharm Sci 2014;6:358‑64.
33. Seenivasan P, Haritha P, Maheswara U, Reddy C. An approach for the improvement of dissolution rate of Aceclofenac. Res J Pharm Biol
Chem Sci 2013;4:1064‑71.