Review
Progress in the Infrared Remote Sensing of Volcanic
Activity
Matthew Blackett1 *
1 School of Energy, Construction and Environment, Coventry University 1; [email protected] * Correspondence: [email protected]
Abstract: Volcanic activity essentially consists of the transfer of heat from the Earth’ interior to the surface. The precise signature of this heat transfer relates directly to the processes underway at and within a particular volcano and this can be observed, at a safe distance, remotely, using infrared sensors that are present on Earth-orbiting satellites. For over 50 years, scientists have perfected this art using sensors intended for other purposes, and they are now in a position to determine the particular sort of activity that characterizes different volcanoes. This review will describe the theoretical basis of the discipline and then discuss the sensors available for the task and the history of their use. Challenges and opportunities for future development in the discipline are then discussed.
Keywords: infrared remote sensing; volcanoes; earth observation, satellites
1. Introduction
Remote sensing is the observation of an object without requiring contact with the object being observed. It is something our eyes do all the time and humans have developed specialist equipment for this purpose, ranging from the simple camera which detects reflected electromagnetic radiation (in this case, from the visible portion of the spectrum) to complex sensors which detect electromagnetic radiation in other portions of the electromagnetic spectrum, including in the infrared. The main difference between infrared remote sensing and remote sensing in the visual portion of the spectrum is that infrared imaging detects the electromagnetic emissions of an object itself, which are a function of an object’s temperature and emissivity, as opposed to detecting electromagnetic radiation which has simply been reflected from an object’s surface.
Observations in the infrared region of the spectrum are particularly useful when examining volcanic activity because volcanic activity intrinsically consists of the transfer of heat from within the Earth to the surface, and observations of this heat often relate directly to the activity of a volcano at a specific time 1. The activity observed, and expressed in the thermal signature, might be from a fresh lava flow or active lava lake or may be more subtle, such as from a degassing surface or warmed crater-lake. Understanding what is going on at a volcanic site using such data is clearly of use in determining a volcano’s current status and as such, in predicting what might happen next; making such observations remotely and at a safe distance, is also clearly advantageous.
This review will firstly explain some of the theoretical concepts and considerations that must be taken into account when it comes to the infrared remote sensing of volcanic activity. It will then present the sensors used for the purpose and discuss the history of the discipline. The prospects, opportunities, and even threats, for the discipline in the coming decades will then be highlighted.
2. Infrared remote sensing: theory
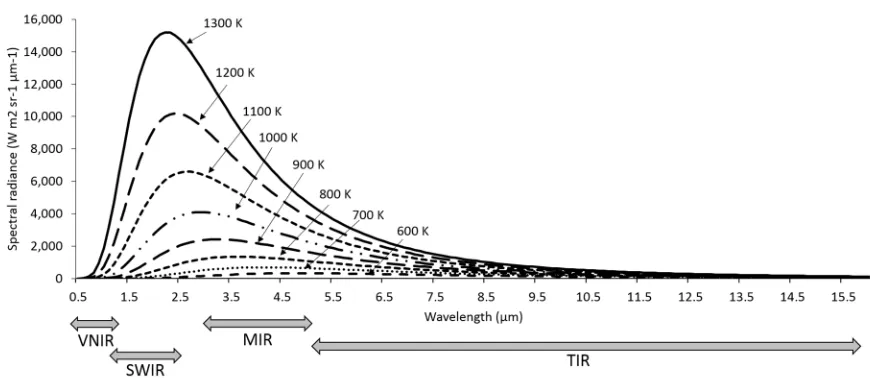
of the object’s actual temperature. In simple terms, this translates as: the hotter an object, the greater the total energy it will radiate, and this applies to all wavelengths of emission (Fig 1). According to Wien’s Displacement Law 4, the peak wavelength of spectral radiant emissions also becomes shorter with increasing temperature, and this is also observable in Figure 1.
The energy radiated from an object, otherwise termed radiant flux, is quantified in terms of
radiance per unit of wavelength, and is referred to as spectral radiance. The spectral radiance, Lλ(T),
(in units of W m2 sr-1 µm-1), emitted by a blackbody at a particular temperature (T) and wavelength
(λ), can be calculated using the Planck Function 5 below, and as represented again in Figure 1:
−
=
1 λT C exp λ
C (T)
L
2 5
1
λ , (1)
where: C1 and C2 = constants of 1.19 x 10⁻¹⁶ and 1.44 x 10⁻² m K, respectively 7.
Figure 1. Relationship between spectral radiant emissions (in terms of quantity and
wavelength) and temperature of emitting surface, thus representing the Planck Function and
both the Stefan Boltzmann and Wien’s Displacement Laws. The definition of different portions of the infrared spectrum is also depicted (VNIR: visual and near infrared, SWIR: short-wave infrared, MIR: mid-infrared and TIR: thermal infrared).
Table 1. Characteristics of the main sensors used for the infrared remote sensing of volcanoes.
Sensor Characteristics AATSR on-board the ESA European Remote
Sensing Satellites
7 bands: VNIR-MIR-TIR Resolution: 1 km
ALI on-board the ESA Envisat 9 bands: VNIR-SWIR
Resolution: 30 m
ASTER on-board NASA Terra 14 bands: VNIR-SWIR-TIR
Resolution: 15, 30 and 90 m ATSR-1, ATSR-2 on-board the ESA European
Remote Sensing Satellites
4 bands: SWIR-MIR-TIR Resolution: 1 km
AVHRR on-board the NASA EO-1 satellite 5 bands: VNIR-SWIR-MIR-TIR Resolution: 1.1 km
ETM+ on-board NASA Lansdsat 7 satellite 8 bands: VNIR-SWIR-TIR Resolution: 15, 30 and 60 m
Imager on-board the NASA GOES 5 bands: VNIR-MIR-TIR
Resolutions: 1-4 km Hyperion on-board the NASA EO-1 satellite 220 bands: VNIR-SWIR
Resolution: 30 m
MVIRI on-board the ESA Meteosat 3 bands: VIS-TIR
Resolutions: 2.5-5 km MODIS on-board NASA Terra and Aqua 32 bands: VNIR-MIR-TIR
Resolutions: 250, 500 and 1000 m OLI on-board NASA Landsat-8 satellite 11 bands: SWIR-TIR
Resolutions: 15-100 m S-NPP on board NASA S-NPP satellite 22 bands: VNIR-SWIR-TIR
Resolutions: 375-750 m
Early satellites such as the National Aeronautics and Space Administration’s (NASA’s) Television Infrared Observation Satellite (TIROS) series, launched throughout the 1960s, possessed thermal infrared Earth-observation capabilities for meteorological observations, with clouds being cold relative to Earth’s surface, thereby allowing a synoptic view of large scale weather systems. Since this period (a detailed summary is provided later), infrared observations have remained crucial for meteorological purposes while at the same time, providing an excellent means of observing terrestrial ‘hot phenomena’ from wild fires to active volcanoes. Some examples of using orbiting infrared sensors for this purpose include 9, in which it is shown that subtle precursory thermal signals could be detected in the thermal infrared prior to the 2006 eruption of Bezymianny Volcano, Russia and 10, which also showed how TIR observations of Bezymianny could be used to monitor the volcano’s changing state during a later eruption. More recently, 11 used satellite-retrieved TIR observations, augmented by ground-based observations, to isolate precursory signals, and a subsequent eruption, at Redoubt, Alaska and 12 demonstrate the utility of satellite TIR observations for determining lava extrusion rates, and discriminating different lava dome activity, at Merapi volcano, Indonesia. Similarly, a number of satellite sensors have MIR detection capabilities which have been shown to be useful in monitoring both thermally anomalous surfaces and, also, those at a more ambient temperature. 13 and 14 for example, utilised MIR bands to quantify the thermal signals from a number of volcanoes, and used the same data to monitor the variability in heat flux from the lava lake at Mount Erebus, respectively, while 15 demonstrates a volcanic activity detection system which harnesses MIR signals detected remotely, by satellite sensors.
Reflection Radiometer (ASTER) were chosen specifically for the absorption features of various minerals and clays 17, 18. However, such bands are also useful in monitoring particularly hot surfaces, especially at night 19, and it is unfortunate that the SWIR bands of ASTER, commonly used for such purposes, began to malfunction in 2008, although the opportunity to investigate the volcanic-application of a newer NASA satellite, Landsat-8’, SWIR bands, remains unexplored 20.
In the absence of sunlight, any signal recorded from space in the SWIR from a terrestrial hot surface, will be purely a product of that surface and its temperature; in contrast, the MIR and TIR emissions of ambient terrestrial surfaces will always need to be removed from day and night imagery if accurate emissions quantifications are required. The advantage that MIR and TIR observations have over SWIR observations however, is that they will also detect cooler surfaces, thereby negating the requirement of incandescent or fresh lava to be present, thus allowing a greater range of volcanic activity to be monitored.
3. Specific consideration in infrared remote sensing
When it comes to infrared remote sensing of volcanic activity, as indeed with the remote sensing of any particular phenomena, there are a number of specific considerations that must be taken into account if the imagery acquired is to be appropriately interpreted and analysed; these are now examined.
Figure 2. Infrared imagery of Palu'e Island, Indonesia, which consists of the Paluweh volcano. a: Landsat-8 imagery, with a spatial resolution of 30 m, captured 0200 UTC on 29 April 2013; b: MODIS imagery (Calibrated Earth View data), with a spatial resolution of 1000 m, captured 0210 UTC 30 April 2013.
Temporal resolution. The temporal resolution of remotely sensed data refers to the regularity with which a particular point on Earth’s surface can be imaged by the sensor and this, and the spatial and temporal resolution of spaceborne remote sensing devices are, in practice, inversely related 23. The reason for this is that the higher the spatial resolution of a sensor, the smaller its pixels and, therefore, the narrower its swath will be, where the swath is the width of the area on Earth’s surface that a sensor scans on overpass (Figure 3). As a narrower swath views less of Earth’s surface at any one time, it cannot gain imagery of the entire surface so regularly, hence reducing its temporal resolution. The swath width of the Operational Land Imager of the NASA Landsat-8 satellite, for example, is 185 km, with a pixel size of 30 m, resulting in a temporal resolution of 16 days; NASA’s Moderate-resolution imaging spectroradiometer (MODIS) in contrast, has a swath width of 2330 km and pixel size of 1 km, resulting in a twice daily temporal resolution.
Figure 3. Representation of the swath width of an Earth Observing satellite sensor.
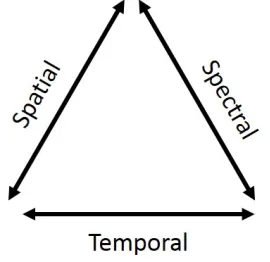
Figure 4. The trade-off, and inverse relationship, between spatial, spectral and temporal resolution, when it comes to satellite Earth Observation imagery.
Orbit. In general, there are two types of Earth-orbit with regard to satellites used for volcanic remote sensing: geostationary and sun-synchronous. Geostationary satellites, such as NASA’s Geostationary Operational Environmental Satellite (GOES) and the European Space Agency’s (ESA) ESA’s Meteosat, orbit the Earth at the Equator at the same speed as Earth’s rotation and at an altitude of approximately 35,000 km. By matching Earth’s orbital speed, geostationary satellites maintain the same view of Earth’s surface at all times and being so high, provide the means of very regular (every 15-30 minutes), near-hemispheric, observations. Sun-synchronous satellites in contrast, and as the same suggests, are synchronised with the sun, orbiting the Earth at a much lower altitude (approximately 705 km) and from pole to pole, in such a way that they overpass the Equator at the same local solar time but different longitude, on each orbit. The temporal resolution of such sensors is swath-width dependent, ranging from one day (for MODIS, with a swath width of 2330 km) to sixteen (for Landsat-8, with a swath width of 185 km).
placed in ‘atmospheric windows’, or portions of the electromagnetic spectrum with high transmissivity and hence, low atmospheric absorption, however even in these windows, a small portion of the signal may be absorbed (see Figure 5). Additionally, as the atmosphere itself has a temperature, it too emits electromagnetic radiation that contributes to that detected by an observing sensor and, assuming an average atmospheric temperature of 273 K, such emissions may be high, particularly in the TIR. An added complication is that a portion of the atmospheric radiance, and indeed daytime solar radiance, will also be reflected sensor-ward, further augmenting the signal. Radiative transfer models are available to model such atmospheric effects which, especially in humid regions, may be significant.
Figure 5. Atmospheric transmissivity throughput the infrared region of the spectrum. Note the very limited transmissivity around 6.0, attributable to the absorption by atmospheric water vapour. Source: 26.
Emissivity. This is the radiating efficiency of a surface and is inversely proportional to its reflectance. An object with an emissivity of 1.0 is a perfect emitter, a black-body, emitting radiation with 100% efficiency; all other objects emit with less efficiency with the effect that the apparent (or brightness) temperature of such objects, if measured remotely and derived using the Plank equation (Equation 1), is less than the true kinetic temperature of the object. The significance of this is that to derive the true temperature of a volcanic, or indeed any surface, its emissivity is required, and this has been shown to vary widely for volcanic surfaces, depending on the mineralogy, rock temperature and waveband of observation (e.g. it has been shown to be 0.92 in the SWIR bands for cooled lava, andesite, at Lascar, Chile 27 and close to 1.0 for the active lava lake at Erta Ale, Ethiopia 8).
its predecessor, Landsat ETM+, the enhanced dynamic range means that temperatures of up to 747.9 K and 570.4 K, can be detected without saturation in bands 6 and 7, as compared with the corresponding ETM+ bands (724.5 K and 552.8 K) 29. One solution for saturation which has been applied is the use of varying gain settings to extend the maximum detectable temperatures at the higher end. The SWIR bands of the ASTER sensor, for example, were endowed with low-gain settings specifically for the purpose of volcanic monitoring (a “volcano mode” 30; 31), so at to raise the saturation temperature, but in doing such, it also had the effect of reducing sensitivity to lower temperature phenomena 19.
Figure 6. a: Band 9 ASTER nighttime image of Lascar volcano, Chile, depicting a transect line through the radiating SWIR signal. b: quantification of the signal along the transect in a. note that between pixels 12 and 16 the signal reaches a threshold, suggesting saturation.
At pixel 18, the signal is 0 W m2 sr-1 µm-1, suggesting this pixel has been temporarily
damaged as a result of the saturating signal in adjacent pixels.
4. Historical perspective on sensors used for volcanic observation
Remote sensing imagers with infrared detection capabilities have been relatively common place on imaging satellites since the early 1960s, with the NOAA Television Infrared Observation Satellites (TIROS) constituting the first operational infrared radiometers in orbit 32. As technology progressed rapidly, so too did the number of platforms launched with infrared imaging capabilities but it was not until 1968 that certain infrared remote sensing systems were declassified in the USA, with data from the TIROS range being the first to be declassified 33. Since this period, there has been continuous infrared monitoring of Earth from space 32, with sensors gaining in both spectral and spatial resolution and with data availability becoming more and more widespread. The next section will provide a chronology of the discipline while here, the main satellites and sensors will be presented.
The 1970s also witnessed the commencement of the NASA Landsat series of satellites, although it was not until the 1984 launch of Landsat-5 that functioning SWIR and TIR bands of the Thematic Mapper sensor (TM) were available for thermal studies, endowed with spatial resolutions of 30m and 120 m respectively. The superior spatial resolution of this sensor was achieved because of a smaller swath width compared with AVHRR (185 km versus 2399 km), although this came at the expense of its temporal resolution which stands at 16 days. The next successful sensor of the series, on-board Landsat-7, was the Enhanced Thematic Mapper (ETM+), enhanced in terms of its TIR observation capabilities with a superior spatial resolution (TIR: 60m). It will come as no surprise that with their higher infrared spatial resolution, the Landsat sensors rapidly became very useful in terms of making more detailed volcanic observations than were possible with AVHRR (41; 42; 43; 44), although obviously, the reduced repeat period means that the Landsat satellites are less suitable for examining short-lived events.
In 2013, the latest in the Landsat series was launched, Landsat-8, as part of the Landsat Data Continuity Mission (LDCM) 45; 46. This satellite was endowed with the Thermal Infrared Sensor (TIRS), with two bands at a spatial resolution of 100m. This reduced spatial resolution, as compared with Landsat-7, was a result of a limited development time 45 but despite this, it has been shown to acquire detailed and accurate volcanic observations which will, for the foreseeable future, ensure infrared observations of volcanoes remain available when MODIS expires 20.
Several geostationary satellites were launched in the 1970s with infrared observing capabilities for meteorological purposes. Of these, the NASA GOES series has been most prolifically used for volcanic observations. The chief advantage of sensors on such systems is that they have extremely regular image acquisition (4 times per hour for GOES and the ESA’s Meteorological Satellite, Meteosat) but being geostationary, they are at a much higher altitude meaning they have a poorer spatial resolution (4 km for the GOES Imager and 5 km for Meteosat’s Visible and Infra-Red Imager [MVIRI]). Since 1998, an automated system at the Hawai'i Institute of Geophysics and Planetology, has been operational, with the task of processing GOES data for monitoring global volcanic activity, and since this time various studies have also confirmed the utility of GOES for determining volcanic activity chronologies (e.g. 47, 48). SEVERI, the instrument onboard the most recent Meteosat with infrared imaging capabilities, has similarly been used for such purposes and indeed, has formed part of an automated volcano monitoring system, HOTSAT, which is implemented, along with higher resolution MODIS data, for rapid activity detection and monitoring 49, 50.
In 1986, NASA announced its plans for the development of an Earth Observation System (EOS) 51 that would acquire low-Earth orbit observations. Infrared observations fell within the plans and even prior to its commencement, scientists were optimistic about the role the system could have in the observation of volcanic activity 52. The satellites of the system were launched from 1999 onwards and as the data started to come online, scientists rapidly harnessed the data for volcanological applications, given their optimal characteristics for the monitoring of volcanic activity. The four EOS-sensors with infrared observing capabilities were ASTER (on-board Terra) and MODIS (on-board Terra and Aqua), and the Advanced Land Imager (ALI) and Hyperion (on-board EO-1), each displaying different characteristics making them suitable for different purposes. ASTER was greeted with particular optimism for volcanic remote sensing, providing observations in the SWIR (6 bands of 30 m resolution) and the TIR (5 bands of 90 m), with a swath of 60 km and revist frequency of 16 days it effectively constituted a follow on to Landsat TM 53; 54 55. As of 2008, imagery acquired from ASTER’s SWIR bands became unusable while the TIR bands remain functioning at the time of writing. Of the other EOS-sensors, ALI possessed ten bands from the VNIR to the SWIR, with a spatial resolution of 30 m, thus complementing the bands of ASTER, while Hyperion shared the same 30m resolution but with a ground-breaking 172 bands in the SWIR region.
ASTER imagery could be used to estimate the volcanic explosivity index of an eruption – although obviously this relied on ASTER viewing the appropriate surface at this time.
The two identical NASA MODIS instruments were launched three years apart on-board the Terra (1999) and Aqua (2002) platforms, each possessing 16 infrared bands with a spatial resolution of 1 km and, given a larger pixel size, a larger swath and shorter revisit period (12 hours); they had an envisaged design-life of 5 years 58. Since their launch, the MODIS sensors have shown themselves as the go-to sensors for regular and reliable observations of thermally anomalous volcanic activity. Although the spatial resolution is not ideal for imaging volcanic activity, the regular overpasses (up to four times daily when both sensors are considered) have contributed to their popularity. The MODIS instruments have now been functioning for over 15 years, providing a long dataset for analysis. Various products have also been developed which extract the instruments’ thermal data and process it for users. One group of such products with utility for volcanologists are the MODIS Fire products which provide a table of all thermally anomalous pixels identified within every MODIS scene 59, 60. The long timeseries of regular data has allowed scientists to automatically monitor volcanic activity and to determine baseline activity for all global volcanoes (e.g. 61, 62, 63).
The latest NASA satellite to have been launched this this decade (in 2011), and that possesses infrared imaging capabilities, is the Suomi National Polar-orbiting Partnership satellite (S-NPP), which features the VIIRS. The S-NPP was only ever an experimental satellite of the Joint Polar Satellite System (JPSS), coordinated by both NASA and NOAA. This system is envisaged as continuing the satellite record of environmental observations which commenced with AVHRR in the 1970s and currently continues with MODIS. The S-NPP consists of five instruments, with the VIIRS possessing two sets of bands with infrared detection capabilities: five high resolution Imaging (I) bands (375 m) and sixteen moderate (M) resolution bands (750 m), each covering the MIR and TIR portions of the spectrum; the bandwidth of the M bands is also smaller than that of the I bands, therefore making them better suited to quantitative analysis. To date there has only been one attempt at using VIIRS data for monitoring volcanic activity, with 64 showing its detection capabilities are similar, if not superior, to those of MODIS, while a number of studies have confirmed the utility of its infrared bands for monitoring wildfires (e.g. 65; 66).
One final set of satellites which have been used for volcanic observations is what are termed ‘small satellites’. Varying definitions exist but in general, a small satellite is one weighing under 1000 kg, with the small size making them more affordable and potentially commercially mass-producible 67, 68. Seemingly the first small satellite for hot-spot monitoring was the Bi-spectral Infrared Detection (BIRD) German Aerospace Cente (DLR) satellite mission, which was launched in 2001 and possessed two infrared bands (one MIR and TIR) specifically for identifying hotspots 69. The satellite entered a relatively low orbit (570 km), with a swath width of 190 km and a pixel size of 370 m x 185 m. Data collected by the sensor were examined using a bespoke hotspot detection algorithm which, uniquely, possessed adjustable gain settings that could be changed if the signals were approaching saturation. The chief advantages of the BIRD were the higher spatial resolution, providing for greater sensitivity than sensors such as MODIS, and the availability of MIR and TIR detection, an advantage over ASTER, however, these advantages were at the expense of temporal resolution, given a narrow swath 70. In 2012, a new DLR mission, FireBIRD, commenced, with two infrared sensors onboard the micro- Technologieerprobungsträger 1 (TET-1) satellite, launched into orbit 71. Although fire observation was the objective, in late 2014 it imaged an effusion of lava at Stromboi, Italy, where its adaptive gain settings meant that while a coincident MODIS image experienced saturation, the TET-1 data remained unsaturated, while the relatively high MIR spatial resolution (320 m) meant that detailed imagery was provided 72.
27. Given the temporal superiority of ATSR to Landsat TM, use of the sensor became common place for a few years and it was used to examine temporal variations in volcanic activity at various locations including Lascar, Chile 27 Fernandina, Ecuador 73 and Etna, Italy 74, with a review of its surveillance capability reviewed in 75. Findings from use of the sensor were also used to review the potential volcanic-utility of the then, not-launched NASA MODIS 76. Japan also got in on the act in 1991 with the launch of the OPtical Sensor (OPS) on-board the Japanese Earth Resources Satellite (JERS-1), possessing, for the first time, four high spatial resolution (18 m x 24 m) SWIR bands; it is arguably data from this sensor that revealed the volcanic potential of the shorter wavelength part of the spectrum, particularly for high-temperature phenomena monitoring 77, 27.
5. Infrared remote sensing of volcanoes: a history
Given the previous detail concerning the infrared sensors used for monitoring volcanic activity, it will be evident that the discipline has a history of over half a century. As technology has progressed through this period, so too have the applications to which the discipline have been applied 78, and these will be highlighted here.
Early infrared radiometer remote sensing surveys were actually airborne, as opposed to in Earth orbit, with 79 describing this application to Hawaiian volcanoes and producing more detailed and accurate surface maps than had been possible from land-based observations alone. Later, 80 and 81 presented radiance maps, and detailed of how thermal emissions varied at the new Icelandic volcanic islands of Surtsey and Jolnir, again using airborne-sourced data. 82 and 83 also describe aerial volcanic surveys in Italy and at Mount St. Helens, respectively. 84 was the first study to use satellite-acquired infrared data in the detection and monitoring of volcanic activity. However, despite such early experimental endeavors, even today, no satellite sensor has been launched with the sole aim of volcanic infrared monitoring. Volcanologists have had to be inventive and make use of sensors launched for purposes other than volcanic observation and unfortunately, nothing seems set to change this in the near future.
35 stated, in relation to volcanic remote sensing, that “infrared remote-sensing methods remain of limited use” (p. 293) and at the time, this will have done little to encourage take-up of the data. This assessment was soon set to change however, as the discipline soon began to burgeon. 85 and 86 showed how thermal activity at remote Andean volcanoes could be identified without the need for costly and dangerous fieldwork, while 87 took a more global approach, highlighting the general utility of satellite infrared monitoring of volcanoes. Things then became quantitative, with 88 becoming the first workers to consider volcanic surface power emissions as opposed to just values of radiance.
32 and 78 each provide detailed chronologies of the development of the discipline that cannot be bettered here, but in summary, they show that during the 1990s, the discipline expanded significantly. The 52 work is perhaps responsible for stimulating most interest, by promoting the volcanic utility of the forthcoming NASA Earth Observation System. The initial priority during this period, according to 78 was simply the identification of ‘hotspots’ and following this, the isolation of temperature distributions (e.g. 89; 90; 41). Once perfected in their observations, such studies became more quantitative in their focus and increasingly attempted to relate remote observations to actual phenomena on the ground. 89 and 27 for example, were able to remotely identify eruptive periods from a time series of satellite data for Lascar volcano, Chile, while 91 and 38 showed how infrared observations could be used to estimate lava effusion rates. It was slowly becoming evident that a reliable and direct relationship existed between the radiant heat emitted from a volcano, and the type and intensity of activity at the surface. During this period, the potential seen in the discipline was highlighted in an overall review of the Remote Sensing of Active Volcanoes 22.
temperature difference between bands 3 (3.8 µm) and 4 (10.8 µm). The theory was that, given that MIR channels are more sensitive to surfaces of magmatic temperature than to those at terrestrial temperatures (see Fig. 2), where this difference exceeded a given threshold of 10 K, the surface could be reliably interpreted as displaying a sub-pixel hotspot which was contributing to the band 3 signal. Automated processes using such algorithms rapidly developed, including some that were location-specific, such as one with specific application to AVHRR data and Alaska’s volcanoes, which used an algorithm that became known as the Okmok Algorithm after the Aleutian Island volcano 93; 38. The Okmok algorithm functioned operationally by comparing the temperature of a potentially anomalous pixel to the temperature of those around it; where this difference was shown to be significant, it was automatically isolated as anomalous 32.
Steps in automation were also facilitated by improvements in data distribution and storage, with one of the new possibilities raised, in addition to automation, being the monitoring and observation of volcanic activity over wide areas, as opposed to focusing on just one location. 38 had shown how routine AVHRR observations, and the Okmok algorithm, could be used to monitor all volcanoes in the North Pacific, and soon after this, one of the most pervasive and widely referenced volcanic detection systems was developed: MODVOLC 94; 95; 96. This system, which remains operational, works on similar principles as other algorithms; that that hotter surfaces will produce a higher spectral radiance at shorter wavelengths, than at longer wavelengths, and vice-versa. For each MODIS pixel of data, the MODVOLC algorithm compares the difference in spectral radiance detection between the MIR (band 22: 3.9 µm) and TIR (band 32: 12.00 µm), and normalizes these by the sum of these radiances (the equation is shown below); a greater difference will indicate the presence of a hotter surface, with a threshold used to isolate potential volcanic hotspots 95:
32
R
R
R
R
NTI
22 32 22
+
−
=
,
(2)
where: R22 and R32 refer to the spectral radiance (W m-2 sr-1 m-1) in MODIS bands 22 and 32,
respectively. If band 22 is saturated, data from the equivalent, low-gain band 21 can be used instead (Wright et al., 2004).
The principle of differencing MIR and TIR signals, as used by MODVOLC system, was also utilised in a later, AATSR-bespoke volcano monitoring system, VoMIR 97. However, perhaps the most sophisticated automated system of the period was the “Autonomous Sciencecraft Experiment System” (later named the “Volcano Sensor Web”) developed for the sensors of the EO-1 spacecraft 98; 99. This system functioned by processing Hyperion SWIR data; if a potential hot surface was identified, then a trigger was generated to re-point Hyperion (and ALI) appropriately. The system could also be triggered by other sources, such as MODIS, or on-the-ground observations, re-tasking it to make follow-up observations within 2 days of notification 98; 100. The utility of this system was demonstrated during the 2010 Eyjafjallajökull eruption, when 50 observations were made of the erupting volcano over a period of 74 days, ultimately providing data to stakeholders in Iceland to assist in risk and hazard assessments 99.
Despite early recognition of their utility in observing active volcanoes (e.g. 17; 87), few detection algorithms were ever developed using SWIR. This is because of the greater availability of regular MIR and TIR observations and the fact that MIR and TIR observations are usually available at moderate-low spatial resolution, delivering large volumes of frequent, wide-area coverage data that necessitates automated processing, as opposed to more localised, and often ad-hoc, SWIR observations 40.
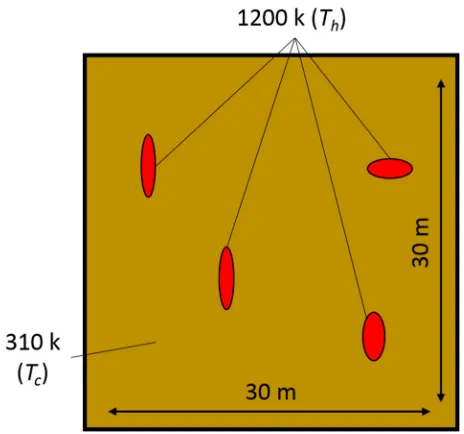
temperature (and just consider the possibilities within the 1 km pixels of AVHRR or MODIS). As such, while radiance detected within one pixel might give an approximate indication of the activity on the ground, such a pixel integrated value effectively hides much information. Given the varying sensitivity of different bands to surfaces of different temperature, the pixel integrated value will also be dependent on the band used to image it. For example, again taking Figure 7, in band 4 of ASTER, the brightness temperature that would be detected is 615 K as compared with 505 K if imaged in band 9 (see Figure 8), as the shorter wavelength detectors are more sensitive to the hotter surface components. This is also demonstrated by the wider area of detection in Figure 9 when the band 4 and band 9 signals are considered. This difference between bands was actually utilised for volcanic monitoring by 87, in using a technique developed by 101 and 102 for monitoring industrial heat sources. These ground breaking studies from 1981 has recognised that, for observations of hotspots of sub-pixel size, if the spectral emissions of a pixel are known for two different, thermally sensitive bands, each of which will be differently sensitive to sub-pixel components of different temperatures, then a sub-pixel thermal structure can be estimated, effectively allowing the observer to obtain a ‘sub-pixel’ characterisation of a surface.
Figure 7. A modelled 30 m (e.g. ASTER) pixel, with various hot components at 1200 K and a background surrounding temperature of 310 K. Given these characteristics, the pixel would have an integrated temperature of 615 K at 1.650 µm (ASTER band 4) and 505 K at 2.395 µm (ASTER band 9).
To characterise the pixel area into two components, non-linear, simultaneous equations are used. These ‘dual-band’ equations, are:
)] (T L ) P -[(1 ) (T L P
Rx = h x h + h x c , and (3)
,Ry =Ph Ly(Th )+[(1-Ph )Ly(Tc )] (4)
where: Rx and Ry = radiance detected in bands x and y (W m-2 sr-1 m-1), adjusted for atmospheric
effects and surface emissivity; Ph = proportion of pixel occupied by hotspot; Lx(Th) and Ly(Tc) = spectral
radiance (L, W m-2 sr-1 m-1) emitted in a particular band by a surface at temperature Th (the hot
Figure 8. The pixel integrated temperature that would be detected by ASTER’s SWIR bands on viewing the modelled surface of Figure 7.
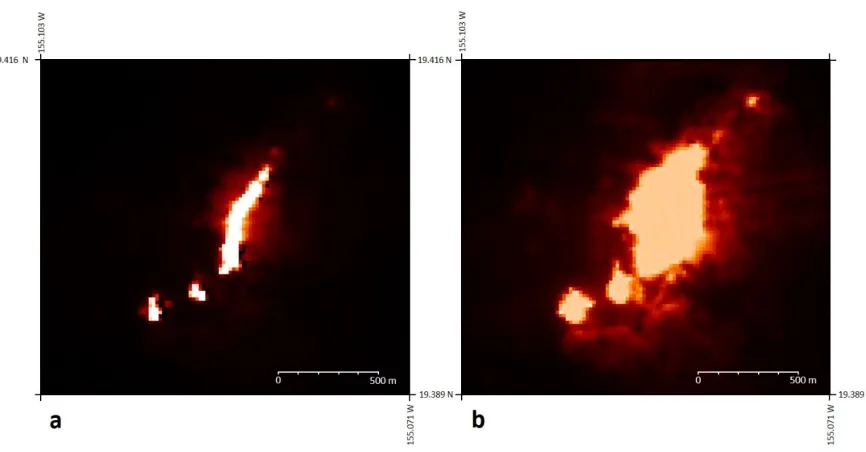
Figure 9. Short-wave infrared imagery of the lava flow at Mount Etna, Italy, on 29 July 2007. a: in ASTER band 4; b: in ASTER band 9. The wider area in b demonstrates the detection of radiance from relatively cooler surfaces by band 9, on the periphery of the lava flow, than by band 4, which only detects the emissions from the very hot lava flow itself.
As the dual-band method relies on two equations and as there are three unknowns (Th, Tc and
Ph), it requires the assumption of either Th, Tc or Ph. Volcanologically, Th may relate to the temperature
of recently erupted lava, or an exposed lava lake, while Tc may relate to the temperature of the
surrounding surface unaffected by volcanic processes; Ph will usually be impossible to estimate
accurately. The assumption of two discrete temperature regions might be appropriate in some situations, but in most cases, a two-component solution will only ever approximate reality.
per pixel is that this value can be summed for all imaging pixels to derive an overall power emission value for the surface, thus providing a means of monitoring volcanic activity over time and of comparing the activity at different volcanoes. 88 was one of the first pieces of research to undertake such analysis, based on dual-band equation retrievals, setting a standard that was to be reproduced in many later studies (e.g. 103; 89; 104). The radiant power emission, or heat-loss, for an assumed two-component pixel, can be calculated using the Stefan-Boltzmann Law and by calculating the contribution of each component to the overall radiant heat-flux of the pixel:
]
)T
P
(1
T
σεA[P
Q
=
h h4+
−
h c4 (5)Where: Q = radiant power emission (W), σ = Stefan-Boltzmann Constant (5.67 x10⁻⁸ W m-2 K-4), ε
= surface emissivity (unit-less) and A = pixel surface area (m2).
As multi-spectral infrared imaging capabilities became more widespread, and also with higher spatial resolution, the possibility of viewing the surface in more detail, while also allowing the differentiation of different features within the same surface, based on the different spectral radiant emissions from surfaces at different temperatures, became more realistic. 73 showed this when comparing the high detail in JERS observations of Lascar volcano, Chile, with that that a corresponding 1 km pixel of ATSR would observe. This is also demonstrated by 105 in which detail such as Hawaiian lava-flow braiding, could be isolated using multispectral and high resolution Landsat ETM+ data. Despite the availability of multi-spectral infrared bands of data however, use of dual-band techniques has persisted. 9 for example, use it to distinguish regions of active lava flow from regions of fumarolic activity using ASTER SWIR data while 106 use it to determine the true source of thermal emissions from adjacent volcanoes using spatially coarse AVHRR data.
Experimentations were made into using more than two bands of data, with 107 for example, showing that in relation to an active lava flow, a continuum of temperatures is displayed and that as such, a surface would be better characterised with 5-7 components. However, despite this, because its outputs are more accurate than effectively assuming one uniform temperature and deriving one pixel integrated value, use of the technique persisted, largely because until the launch of the multi-spectral EOS sensors, only two usable SWIR bands were available from satellite imagery 107. 19 also showed that despite the availability of multiple bands of data, such as in the SWIR bands of ASTER, the settings of such sensors were often sub-optimal for volcanic observational purposes. At this time however, one data source remained rather unexploited: the NASA ALI and Hyperion sensors. Possessing their impressive complement of bands meant that these sensors had the potential to discern numerous sub-pixel surfaces for fine detailed surface characterisation. 108 demonstrated the utility of such hyper-spectral imagery by using Hyperion data to distinguish various different expressions of thermal activity, such as lava lakes, flows and fountains, and indeed, even different lava types, at various volcanoes globally.
Since the end of the last decade, the number of publications in the discipline has certainly declined, although the discipline has certainly not stopped making progress. 115 and 116 for example, document and validate a new and more sensitive volcanic activity detection algorithm, and realtime detection system, called MIROVA, which uses MODIS MIR data. 117 using MODIS TIR data in contrast, were able to identify distinct phases of lava dome growth and collapse at Merapi volcano, Indonesia, and to determine the varied volcanic-causes of thermal anomalies detected. The NASA-EOS satellites launched in the early 2000s are coming to the end of their operational lives (indeed the SWIR bands onboard ASTER became complete unusable in 2009 118) and while others remain in orbit (e.g. Landsat-7 and AVHRR) their spatial or temporal resolutions are far from optimal. New satellites have been launched with infrared imaging capabilities, such as Landsat-8 and Suomi, but the use of these to analyse volcanic activity has been rather limited, despite showing much promise with their data shown to be comparable 64, or indeed improved 20, when compared with predecessors. Now is perhaps a period of reflection as scientists review data from the past (e.g. 119; 120) and offer suggestions for the design of future satellites, perhaps smaller ones, which will have infrared imaging capabilities (e.g. 121).
Prospects for the future
Sensors currently used for the infrared monitoring of volcanic activity have immense utility and indeed, have become essential for the monitoring of volcanoes in remote regions. However, there remain a number of shortcomings dictated by the temporal-spatial-spectral resolution trade-off. 78 argued that 2000-2010 showed greater progress in the field than they envisaged for the next decade (up to 2020). Indeed, they discuss the debate that was required to ensure that the following generation of Landsat sensors possessed any infrared sensing capabilities at all, with such capabilities nearly having been excluded from the Landsat-8 platform 78, 46; a slowdown in progress this decade has certainly been indicated here. The apparent dearth of research in the volcanological remote sensing field over recent years might be explained by a number of factors, such as that the NASA-EOS satellites are coming to the end of their operational lives, while a number of others systems that remain in orbit (e.g. Landsat-7 and AVHRR) have less than optimal spatial or temporal resolutions. New satellites have been launched with infrared imaging capabilities, such as Landsat-8 and VIIRS onboard Suomi, but volcanic-use of these has been rather limited, despite showing comparability 20, or indeed improved performance 64; some seeming retrograde steps, such as the reduction in Landsat-8 infrared spatial resolution, have also been taken. The limited utilisation of these sensors for volcanological studies is by no means a reflection of their potential and it remains to be seen what new and innovative volcanic observational uses can be derived. At the same time, the body of data from all sensors in orbit continues to grow, providing an ever larger repository from which more accurate and representative estimations of volcanic activity might be drawn, such as the pioneering work of 63.
regarding Hyspiri: “There is no current thermal infrared sensor that combines multiple bands needed for temperature-emissivity separation, a sub-100 m spatial resolution, and a frequent repeat interval with global coverage, which are necessary to answer a wide range of Earth science studies related to surface composition, hydrology, and volcanology” (pg. 1). Fears remain however, as to whether or not the saturation temperature of the MIR bands will be high enough to prevent saturation over the most radiant flows 121.
Another project which shows potential from the perspective of volcanic remote sensing relates to the European Commission’s Earth observation programme: Copernicus. As part of this programme, the Sentinel 3 satellite mission is launching two satellites with infrared Earth Observation capabilities (Sentinel-3A was launched in early 2016 and Sentinel-3B is due for launch in 2017) which provide continuity in the ATSR and AATSR range. The primary aim of Sentinel-3, and its Sea and Land Surface Temperature Radiometers (SLSTR), is for monitoring ocean and land surface temperatures however, given SWIR, MIR and TIR imaging capabilities, it also has the capacity to continue the availability of volcanic observations. The chief advantages of the SLSTRs are a saturation temperature of 675 K and an Equatorial revisit time of half a day when both satellites are considered; thermal anomaly detection algorithms have also already been developed and tested (124; 125).
For the true monitoring of volcanic activity, high temporal resolution data, ideally at a sub-daily resolution, such as that provided by the geostationary satellites, is particularly useful, and there are future prospects which show promise in this regard. The Geostationary Operational Environmental Satellite R-Series, GOES-R, for example (the first satellite of which is due for launch in late 2016), will possess the Advanced Baseline Imager (ABI) which will retain the sensor’s high temporal resolution while also improving current capabilities, with a superior spatial resolution (0.5 km – 2.0 km) and more bands (including a new SWIR band) 126. Japan’s equivalent satellites, Himawari -8 (launched in 2015) and -9 (due for launch in 2016), possess a sensor largely comparable in terms of features to the ABI 127. Similarly, the European Meteosat Third Generation Mission, the first spacecraft of which are due for launch from 2020, will possess more bands on its SEVERI replacement, the Flexible Combined Imager (FCI), with short wave and near infrared bands at 1 km resolution, and a temporal resolution of 10 minutes, as compared with 15 minutes at present 128. These geostationary satellites will also have the capability for rapid scans at times of enhanced activity and, in the case of GOES-R, this may be up to every 30 seconds 126, 127). And prospects for the more distant future for instantaneous monitoring are equally exciting with a fourth generation envisioned by 129 to be active from around 2035. This system will possess an increasingly hyperspectral range of instruments and an even greater spatial and temporal resolution - ideal for monitoring the rapidly changing surfaces associated with volcanoes.
100 argue that in future, data from surface sensors, in addition to from satellites, should form part of any automatic system for identifying volcanic anomalies, suggesting that had this been the case for the 2010 Eyjafjallajökull eruption, attention would have been focused on the eruption sooner, rather than after the eruption was underway. 78 in contrast, envisage most useful development in the coming years, in terms of the thermal remote sensing of volcanoes, to be in the area of small-satellites, launched privately and with less expense than their larger counterparts.
envisaged that in total, the FireBIRD constellation will have a 3-day revisit period for locations at the Equator 132. A constellation of multi-spectral infrared VISible-to-thermal IR micro-SATellites (VISIR-SAT), has also been proposed, with a spatial resolution of potentially less than 30m – something that would be ground breaking for MIR and TIR observations – and with one of its aims being: “To predict … volcanic hazards through detection of transient thermal phenomena” (pg. 1286) 71.
Despite an apparent slowdown in the discipline, there is much hope and potential for the future. An ideal strategy would be for a multi-scale approach, combining the use of high temporal resolution, wide swath spectroradiometers (e.g. MODIS or AVHRR) and higher spatial resolution monitoring focusing on high-risk areas. If both such systems communicate with each other, events noted at high temporal resolution could can be used to trigger the higher spatial resolution observations – and precedence of this has been discussed. One particularly exciting prospect is an ESA Sentinel Convoy, whereby 71 suggests that the VISIR-SAT could be flown in convoy with the Sentinel-3 satellites, providing high spatial resolution observations of thermal anomalies detected by the coarser resolution, but more widely viewing, Sentinels.
Abbreviations
The following abbreviations are used in this manuscript:
DOAJ: Directory of open access journals TLA: Three letter acronym
LD: linear dichroism
References
1. Oppenheimer, C. Review article: Volcanological applications of meteorological satellites. International Journal of Remote Sensing 1998, 19, 2829–2864.
2. Stefan, J. Über die Beziehung zwischen der Wärmestrahlung und der Temperatur. Sitzungsberichte der mathematisch-naturwissenschaftlichen Classe der kaiserlichen Akademie der Wissenschaften 1879, 79, 391-428.
3. Boltzmann, L. Ableitung des Stefan'schen Gesetzes, betreffend die Abhängigkeit der Wärmestrahlung von der Temperatur aus der electromagnetischen Lichttheorie. Annal Physik Chemie 1884, 22, 291-294. 4. Wien W. Uber die Energieverteilung in Emissionspektrum eines schwarzen Korpers. Annalen der Physik
und Chemie 1896, 58, 662–669.
5. Planck, M. Ueber das Gesetz der Energieverteilung im Normalspectrum. Annalen der Physik 1901, 4, 553-563.
6. Fink, J. H.; Srivastava, A.; Sylvester, D.; Blaauw, D. Lava flows and domes: Emplacement mechanisms and hazard implications; Springer-Verlag: Berlin, 2008.
7. Wooster, M. J. and Rothery, D. A. (1999). Volcano Surveillance Using Shortwave Infrared Thermal Data from the ERS Along Track Scanning Radiometers, ATSR Workshop: Applications of the ERS Along Track Scanning Radiometer, ESRIN, Frascati, 23-25 June 1999.
8. Oppenheimer, C.; Yirgu, G. Thermal imaging of an active lava lake: Erta ’ale volcano, Ethiopia. International Journal of Remote Sensing 2002, 23, 4777–4782.
9. Carter, A. J.; Girina, O.; Ramsey, M. S.; Demyanchuk, Y. V. ASTER and field observations of the 24 December 2006 eruption of Bezymianny volcano, Russia. Remote Sensing of Environment 2008, 112, 2569– 2577.
10. Carter, A. J.; Ramsey, M. S. ASTER- and field-based observations at Bezymianny volcano: Focus on the 11 may 2007 pyroclastic flow deposit. Remote Sensing of Environment 2009, 113, 2142–2151.
11. Wessels, R. L.; Vaughan, R. G.; Patrick, M. R.; Coombs, M. L. High-resolution satellite and airborne thermal infrared imaging of precursory unrest and 2009 eruption at redoubt volcano, Alaska. Journal of Volcanology and Geothermal Research 2013, 259, 248–269.
12. Carr, B. B.; Clarke, A. B.; Vanderkluysen, L. The 2006 lava dome eruption of Merapi volcano (Indonesia): Detailed analysis using MODIS TIR. Journal of Volcanology and Geothermal Research2016, 311, 60–71. 13. Wright, R.; Pilger, E. Satellite observations reveal little inter-annual variability in the radiant flux from the
Mount Erebus lava lake. Journal of Volcanology and Geothermal Research 2008, 177, 687–694.
14. Wright, R.; Pilger, E. Radiant flux from earth’s subaerially erupting volcanoes. International Journal of Remote Sensing 2008, 29, 6443–6466.
15. Coppola, D.; Laiolo, M.; Cigolini, C.; Donne, D. D.; Ripepe, M. Enhanced volcanic hot-spot detection using MODIS IR data. In Detecting, Modelling and Responding to Effusive Eruptions; Geological Society of London; pp. 181–205.
16. Rowan, L. C.; Mars, J. C. Lithologic mapping in the mountain pass, California area using advanced Spaceborne thermal emission and reflection Radiometer (ASTER) data. Remote Sensing of Environment 2003, 84, 350–366.
17. Rothery, D. A. The need for volcano monitoring and the ability to detect activity using emitted short wavelength infrared. International Geoscience and Remote Sensing Symposium, “Remote Sensing: Moving Toward the 21st Century”, 1988.
18. Pieri, D.; Abrams, M. ASTER watches the world’s volcanoes: A new paradigm for volcanological observations from orbit. Journal of Volcanology and Geothermal Research 2004, 135, 13–28.
20. Blackett, M. Early analysis of Landsat-8 thermal infrared sensor imagery of volcanic activity. Remote Sensing 2014, 6, 2282–2295.
21. Remote sensing imagery; Tupin, F.; Inglada, J.; Nicolas, J.-M., Eds.; Wiley-ISTE: London, 2014.
22. Francis, P.; Rothery, D. Remote sensing of active volcanoes. Annual Review of Earth and Planetary Sciences 2000, 28, 81–106.
23. Lillesand, T. M.; Kiefer, R. W.; Chipman, J. W.; Lilles, T. M. Remote sensing and image interpretation; 5th ed.; Wiley, John & Sons: New York, 2003.
24. Chien, S.; Silverman, D.; Davies, A. G.; Mandl, D. Onboard science processing concepts for the HyspIRI mission. IEEE Intelligent Systems 2009, 24, 12–19.
25. Lee, C. M.; Cable, M. L.; Hook, S. J.; Green, R. O.; Ustin, S. L.; Mandl, D. J.; Middleton, E. M. An introduction to the NASA Hyperspectral infraRed Imager (HyspIRI) mission and preparatory activities. Remote Sensing of Environment 2015, 167, 6–19.
26. Lord, S. D.; NASA Technical Memorandum 103957, 1992. From: Gemini Observatory, http://www.gemini.edu/ [accessed: September 2016].
27. Wooster, M. J.; Rothery, D. A. Thermal monitoring of Lascar volcano, Chile, using infrared data from the along-track scanning radiometer: A 1992-1995 time series. Bulletin of Volcanology 1997, 58, 566–579. 28. Mouginis-Mark, P.; Rowland, S.; Francis, P.; Friedman, T.; Garbeil, H.; Gradie, J.; Self, S.; Wilson, L.; Crisp,
J.; Glaze, L.; Jones, K.; Kahle, A.; Pieri, D.; Zebker, H.; Krueger, A.; Walter, L.; Wood, C.; Rose, W.; Adams, J.; Wolff, R. Analysis of active volcanoes from the earth observing system. Remote Sensing of Environment 1991, 36, 1–12.
29. Morfitt, R.; Barsi, J.; Levy, R.; Markham, B.; Micijevic, E.; Ong, L.; Scaramuzza, P.; Vanderwerff, K. Landsat-8 operational land Imager (OLI) Radiometric performance on-orbit. Remote Sensing2015, 7, 220Landsat-8–2237. 30. Yamaguchi, Y.; Kahle, A. B.; Tsu, H.; Kawakami, T.; Pniel, M. Overview of advanced Spaceborne thermal
emission and reflection Radiometer (ASTER). IEEE Transactions on Geoscience and Remote Sensing 1998, 36, 1062–1071.
31. Wright, R.; Rothery, D. A.; Blake, S.; Harris, A. J. L.; Pieri, D. C. Simulating the response of the EOS terra ASTER sensor to high-temperature volcanic targets. Geophysical Research Letters 1999, 26, 1773–1776. 32. Harris, A. Thermal remote sensing of active volcanoes: A user’s manual; Cambridge University Press:
Cambridge, UK, 2013.
33. Jensen, J. R. Introductory digital image processing: A remote sensing perspective; 2nd ed.; Prentice Hall: Upper Saddle River, NJ, 2000.
34. Wiesnet, D. R.; D’Aguanno, J. Thermal imagery of Mount Erebus from the NOAA-6 satellite. Antarctic Journal of the United States, 1982, 17, 32–34.
35. Bonneville, A., Vasseur, G and Kerr, Y. (1985). Satellite Thermal Infrared Observations of Mt. Etna After the 17th March 1981 Eruption. Journal of Volcanology and Geothermal Research 1985, 24, 293-313. 36. Harris, A. J. L.; Blake, S.; Rothery, D. A.; Stevens, N. F. A chronology of the 1991 to 1993 mount Etna
eruption using advanced very high resolution radiometer data: Implications for real-time thermal volcano monitoring. Journal of Geophysical Research 1997, 102, 7985.
37. Harris, A. J. L.; Flynn, L. P.; Dean, K.; Pilger, E.; Wooster, M.; Okubo, C.; Mouginis-Mark, P.; Garbeil, H.; Thornber, C.; De la Cruz-Reyna, S.; Rothery, D.; Wright, R. Real-time satellite monitoring of volcanic hot spots. In Remote Sensing of Active Volcanism; Wiley-Blackwell, 2000; pp. 139–159.
38. Dehn, J.; Dean, K.; Engle, K. Thermal monitoring of north pacific volcanoes from space. Geology 2000, 28, 755.
39. AVO Alaska volcano observatory - about AVO - operations
https://www.avo.alaska.edu/about/operations. php, 2014 (accessed Sep 30, 2016).
40. Blackett, M. Review of the utility of infrared remote sensing for detecting and monitoring volcanic activity with the case study of shortwave infrared data for Lascar volcano from 2001-2005. In Geological Society, London, Special Publications; Geological Society of London, 2013; Vol. 380, pp. 107–135.
41. Flynn, L. P.; Mouginis-Mark, P. J.; Horton, K. A. Distribution of thermal areas on an active lava flow field: Landsat observations of Kilauea, Hawaii, July 1991.Bulletin of Volcanology 1994, 56, 284–296.
42. Flynn, L. P.; Harris, A. J. L.; Rothery, D. A.; Oppenheimer, C. High-spatial-resolution thermal remote sensing of active volcanic features using Landsat and hyperspectral data. In Remote Sensing of Active Volcanism; Wiley-Blackwell, 2000; pp. 161–177.
44. Lombardo, V.; Buongiorno, M. F.; Pieri, D.; Merucci, L. Differences in Landsat TM derived lava flow thermal structures during summit and flank eruption at mount Etna. Journal of Volcanology and Geothermal Research 2004, 134, 15–34.
45. Irons, J. R.; Dwyer, J. L. An overview of the Landsat data continuity mission. Algorithms and Technologies for Multispectral, Hyperspectral, and Ultraspectral Imagery XVI2010.
46. Irons, J. R.; Dwyer, J. L.; Barsi, J. A. The next Landsat satellite: The Landsat data continuity mission. Remote Sensing of Environment 2012, 122, 11–21.
47. Harris, A. J. L.; Keszthelyi, L.; Flynn, L. P.; Mouginis-Mark, P. J.; Thornber, C.; Kauahikaua, J.; Sherrod, D.; Trusdell, F.; Sawyer, M. W.; Flament, P. Chronology of the episode 54 eruption at Kilauea volcano, Hawaii, from GOES-9 satellite data. Geophysical Research Letters 1997, 24, 3281–3284.
48. Harris, A. J. L.; Pilger, E.; Flynn, L. P.; Garbeil, H.; Mouginis-Mark, P. J.; Kauahikaua, J.; Thornber, C. Automated, high temporal resolution, thermal analysis of Kilauea volcano, Hawai’i, using GOES satellite data. International Journal of Remote Sensing 2001, 22, 945–967.
49. Ganci, G.; Vicari, A.; Fortuna, L.; Del Negro, C. The HOTSAT volcano monitoring system based on combined use of SEVIRI and MODIS multispectral data. Annals of Geophysics 2011, 54.
50. Ganci, G.; Bilotta, G.; Cappello, A.; Herault, A.; Negro, C. D. HOTSAT. In Detecting, Modelling and Responding to Effusive Eruptions; Geological Society of London, 2016; pp. 207–221.
51. NASA. Earth Observing System. Data and Information System. Report of the EOS Data Panel. Available online: http://ntrs.nasa.gov/archive/nasa/casi.ntrs.nasa.gov/19860021622.pdf (Accessed 1 October 2016). 52. Mouginis-Mark, P.; Rowland, S.; Francis, P.; Friedman, T.; Garbeil, H.; Gradie, J.; Self, S.; Wilson, L.; Crisp,
J.; Glaze, L.; Jones, K.; Kahle, A.; Pieri, D.; Zebker, H.; Krueger, A.; Walter, L.; Wood, C.; Rose, W.; Adams, J.; Wolff, R. Analysis of active volcanoes from the earth observing system. Remote Sensing of Environment 1991, 36, 1–12.
53. Pieri, D. C.; Crisp, J and Kahle, A. B. Observing Volcanism and Other Transient Phenomena with ASTER. Journal of the Remote Sensing Society of Japan, 1995, 15, 56-61.
54. Abrams, M. The advanced Spaceborne thermal emission and reflection Radiometer (ASTER): Data products for the high spatial resolution imager on NASA’s terra platform. International Journal of Remote Sensing 2000, 21, 847–859.
55. Pieri, D.; Abrams, M. ASTER observations of thermal anomalies preceding the April 2003 eruption of Chikurachki volcano, Kurile islands, Russia. Remote Sensing of Environment 2005, 99, 84–94.
56. Carter, A.; Ramsey, M. Long-term volcanic activity at Shiveluch volcano: Nine years of ASTER Spaceborne thermal infrared observations. Remote Sensing 2010, 2, 2571–2583.
57. Urai, M.; Ishizuka, Y. Advantages and challenges of space-borne remote sensing for volcanic Explosivity index (VEI): The 2009 eruption of Sarychev peak on Matua island, Kuril islands, Russia. Journal of Volcanology and Geothermal Research2011, 208, 163–168.
58. LP DAAC: NASA land data products and services https://lpdaac.usgs.gov/15_years_terra_modis (accessed Oct 1, 2016).
59. Kaufman, Y. J.; Justice, C. O.; Flynn, L. P.; Kendall, J. D.; Prins, E. M.; Giglio, L.; Ward, D. E.; Menzel, W. P.; Setzer, A. W. Potential global fire monitoring from EOS-MODIS. Journal of Geophysical Research: Atmospheres 1998, 103, 32215–32238.
60. Justice, C. .; Giglio, L.; Korontzi, S.; Owens, J.; Morisette, J. .; Roy, D.; Descloitres, J.; Alleaume, S.; Petitcolin, F.; Kaufman, Y. The MODIS fire products. Remote Sensing of Environment 2002, 83, 244–262.
61. Wright, R.; Flynn, L.; Garbeil, H.; Harris, A.; Pilger, E. Automated volcanic eruption detection using MODIS. Remote Sensing of Environment 2002, 82, 135–155.
62. Wright, R.; Flynn, L. P. Space-based estimate of the volcanic heat flux into the atmosphere during 2001 and 2002. Geology 2004, 32, 189.
63. Wright, R.; Blackett, M.; Hill-Butler, C. Some observations regarding the thermal flux from earth’s erupting volcanoes for the period of 2000 to 2014.Geophysical Research Letters 2015, 42, 282–289.
64. Blackett, M. An initial comparison of the thermal anomaly detection products of MODIS and VIIRS in their observation of Indonesian volcanic activity. Remote Sensing of Environment 2015, 171, 75–82.
66. Csiszar, I.; Schroeder, W.; Giglio, L.; Ellicott, E.; Vadrevu, K. P.; Justice, C. O.; Wind, B. Active fires from the Suomi NPP visible infrared imaging Radiometer suite: Product status and first evaluation results. Journal of Geophysical Research: Atmospheres 2014, 119, 803–816.
67. Barnhart, D. J.; Vladimirova, T.; Sweeting, M. N. Very-small-satellite design for distributed space missions. Journal of Spacecraft and Rockets 2007, 44, 1294–1306.
68. Sandau, R. Small Satellite Missions. In Advances in Photogrammetry, remote sensing and spatial information sciences: 2008 ISPRS congress book; Li, Z.; Chen, J.; Baltsavias, E., Eds.; CRC Press: Cullompton, Devon, United Kingdom, 2008.
69. Brieβ, K.; Bärwald, W.; Gerlich, T.; Jahn, H.; Lura, F.; Studemund, H. The DLR small satellite mission BIRD. Acta Astronautica 2000, 46, 111–120.
70. Zhukov, B.; Lorenz, E.; Oertel, D.; Wooster, M.; Roberts, G. Spaceborne detection and characterization of fires during the bi-spectral infrared detection (BIRD) experimental small satellite mission (2001–2004). Remote Sensing of Environment 2006, 100, 29–51.
71. Ruecker, G.; Menz, G.; Heinemann, S.; Hartmann, M.; Oertel, D. VISIR-SAT – A PROSPECTIVE MICRO-SATELLITE BASED MULTI-SPECTRAL THERMAL MISSION FOR LAND APPLICATIONS. ISPRS - International Archives of the Photogrammetry, Remote Sensing and Spatial Information Sciences 2015, XL-7/W3, 1283–1289.
72. Zakšek, K.; Hort, M.; Lorenz, E. Satellite and ground based thermal observation of the 2014 effusive eruption at Stromboli volcano. Remote Sensing 2015, 7, 17190–17211.
73. Wooster, M. J.; Rothery, D. A. Time-series analysis of effusive volcanic activity using the ERS along track scanning radiometer: The 1995 eruption of Fernandina volcano, Galápagos islands. Remote Sensing of Environment 1997, 62, 109–117.
74. Rothery, D.; Coltelli, M.; Pieri, D.; Wooster, M.; Wright, R. Documenting surface magmatic activity at Mount Etna using ATSR remote sensing. Bulletin of Volcanology 2001, 63, 387-397.
75. Wooster, M. J; Rothery, D. A. A Review of Volcano Surveillance Applications Using the ATSR Instrument Series. Advances in Environmental Monitoring and Modelling 2002, 1, 97-123.
76. Wooster, M. J.; Rothery, D. A.; Kaneko, T. Geometric considerations for the remote monitoring of volcanoes: Studies of lava domes using ATSR and the implications for MODIS. International Journal of Remote Sensing 1998, 19, 2585–2591.
77. DENNISS, A. M.; HARRIS, A. J. L.; CARLTON, R. W.; FRANCIS, P. W.; ROTHERY, D. A. Cover the 1993 Lascar pyroclastic flow imaged by JERS-1. International Journal of Remote Sensing 1996, 17, 1975–1980. 78. Ramsey, M. S.; Harris, A. J. L. Volcanology 2020: How will thermal remote sensing of volcanic surface
activity evolve over the next decade? Journal of Volcanology and Geothermal Research 2013, 249, 217–233. 79. Fisher, W. A.; Mozham, R. M.; Polcyn, F.; Landis, G. H.; Infrared surveys of Hawaiian Volcanoes, Science
1964, 146, 733-742
80. Williams, R. S. Jr.; Friedman, J. D.; Thórarinsson, S.; Sigurgeirsson, T.; Pálmason, G. Analysis of 1966 infrared imagery of Surtsey, Iceland. Surtsey Research Progress Report IV 1968, 177-191.
81. Freidman J.D.; Williams Jr R.S.; Þórarinsson S.; Pálmarsson G. Infrared Emission from KverkfjöllSubglacial Volcanic and Geothermal Area, Iceland. Jökull 1972, 22. pp. 27 – 43.
82. Cassinis, R.; Lechi, G. M. The Use of Infrared Radiometry in Geothermal Areas. In Civetta, L. (Ed.) Physical Volcanology (Development in Solid Earth Geophysics). 1974. Elsevier, Amsterdam.
83. Kieffer, H. H.; Frank, D.; Friedman, J. D. Thermal infrared surveys at Mount St. Helens-Observations prior to the eruption of May 18. In: Lipman, P.W.; Mullineaux, D.R. (Eds.), The 1980 Eruptions of Mount St. Helens, Washington. USGS Professional Paper 1250. U.S.Government Printing Office, Washington, DC, 1981, pp. 257-277.
84. Gawarecki, S.J.; Lyon, R.J.P.; Nordberg, W. Infrared spectral returns and imagery of the Earth from space and their application to geological problems: scientific experiments for manned orbital flight. American Astronautical Society, Science and Technology 1965, 4, 13-133.
85. Francis, P. W.; McAllister, R. Volcanology from space: Using Landsat thematic Mapper data in the central Andes. Eos, Transactions American Geophysical Union 1986, 67, 170.
86. Francis, P.W., Rothery, D.A. (1987). Using the Landsat Thematic Mapper to detect and monitor active volcanoes: an example from Lascar volcano, Northern Chile. Geology, 15, 614- 617.
88. Glaze, L.; Francis, P. W.; Rothery, D. A. Measuring thermal budgets of active volcanoes by satellite remote sensing. Nature 1989, 338, 144–146.
89. Oppenheimer, C.; Francis, P. W.; Rothery, D. A.; Carlton, R. W. T.; Glaze, L. S. Infrared image analysis of volcanic thermal features: Láscar volcano, Chile, 1984–1992. Journal of Geophysical Research 1993, 98, 4269. 90. Flynn, L. P.; Mouginis-Mark, P. J. Temperature of an active lava channel from spectral measurements,
Kilauea volcano, Hawaii. Bulletin of Volcanology1994, 56, 297–301.
91. Harris, A. J. L.; Flynn, L. P.; Keszthelyi, L.; Mouginis-Mark, P. J.; Rowland, S. K.; Resing, J. A. Calculation of lava effusion rates from Landsat TM data. Bulletin of Volcanology, 1998, 60, 52−71.
92. Harris, A.J.L.; Vaughan, R.A.; and Rothery, D.A.. Volcano detection and monitoring using AVHRR data: the Krafla eruption, 1984. International Journal of Remote Sensing, 1995, 16, 1001-1020.
93. Dean, K.; Servilla, M.; Roach, A.; Foster, B.; Engle, K. Satellite monitoring of remote volcanoes improves study efforts in alaska. Eos, Transactions American Geophysical Union 1998, 79, 413–413.
94. Flynn L. P.; Wright R.; Garbeil H.; Harris A. J. L.; Pilger, E. A global thermal alert system using MODIS: initial results from 2000-2001. Advances in Environmental Monitoring and Modelling 2002 1, 37-69. 95. Wright, R.; Flynn, L.; Garbeil, H.; Harris, A.; Pilger, E. Automated volcanic eruption detection using
MODIS. Remote Sensing of the Environment, 2002, 82, 135-155.
96. Wright, R.; Flynn, L. P.; Garbeil, H.; Harris, A. J. .; Pilger, E. MODVOLC: Near-real-time thermal monitoring of global volcanism. Journal of Volcanology and Geothermal Research 2004, 135, 29–49.
97. Colin, O.; Rubio, M.; Landart, P.; Mathot, E. VoMIR: Over 300 volcanoes monitored in near real-time by AATSR. Proceedings: ‘Envisat Symposium 2007’, Montreux, Switzerland 23–27 April 2007 (ESA SP-636, July 2007).
98. Davies, A. G.; Chien, S.; Baker, V.; Doggett, T.; Dohm, J.; Greeley, R.; Ip, F.; Castan˘o, R.; Cichy, B.; Rabideau, G.; Tran, D.; Sherwood, R. Monitoring active volcanism with the autonomous Sciencecraft experiment on EO-1. Remote Sensing of Environment 2006, 101, 427–446.
99. Davies, A. G.; Chien, S.; Doubleday, J.; Tran, D.; Thordarson, T.; Gudmundsson, M. T.; Höskuldsson, Á.; Jakobsdóttir, S. S.; Wright, R.; Mandl, D. Observing Iceland’s Eyjafjallajökull 2010 eruptions with the autonomous NASA volcano sensor web. Journal of Geophysical Research: Solid Earth 2013, 118, 1936–1956. 100. Davies, A. G.; Chien, S.; Tran, D. Q.; Doubleday, J. Onboard processing of multispectral and hyperspectral data of volcanic activity for future earth-orbiting and planetary missions. 2010 IEEE International Geoscience and Remote Sensing Symposium 2010.
101. Dozier, J. A method for satellite identification of surface temperature fields of subpixel resolution. Remote Sensing of Environment 1981, 11, 221–229.
102. Matson, M.; Dozier, J. Identification of Subresolution High Temperature Sources Using a Thermal IR Sensor. Photogrammetric Engineering and Remote Sensing, 1981, 47, 1311-1318.
103. Oppenheimer, C. Lava flow cooling estimated from Landsat thematic Mapper infrared data: The Lonquimay eruption (Chile, 1989). Journal of Geophysical Research: Solid Earth 1991, 96, 21865–21878. 104. Wooster, M. J.; Wright, R.; Blake, S.; Rothery, D. A. Cooling mechanisms and an approximate thermal
budget for the 1991-1993 Mount Etna lava flow. Geophysical Research Letters 1997, 24, 3277-3280. 105. Flynn, L. P.; Harris, A. J. L.; Wright, R. Improved identification of volcanic features using Landsat 7
ETM+. Remote Sensing of Environment 2001, 78, 180–193.
106. Van Manen, S. M.; Blake, S.; Dehn, J. A near real-time dual-band-spatial approach to determine the source of increased radiance from closely spaced active volcanoes in coarse resolution satellite data. International Journal of Remote Sensing 2011, 32, 6055–6069.
107. Wright, R.; Flynn, L. P. On the retrieval of lava-flow surface temperatures from infrared satellite data. Geology 2003, 31, 893.
108. Wright, R.; Glaze, L.; Baloga, S. M. Constraints on determining the eruption style and composition of terrestrial lavas from space. Geology 2011, 39, 1127–1130.
109. Pergola, N.; Marchese, F.; Tramutoli, V. Automated detection of thermal features of active volcanoes by means of infrared AVHRR records. Remote Sensing of Environment 2004, 93, 311–327.
110. Blackett, M.; Wooster, M. J.; Malamud, B. D. Exploring land surface temperature earthquake precursors: A focus on the Gujarat (India) earthquake of 2001.Geophysical Research Letters 2011, 38, L15303.
111. Koeppen, W. C.; Pilger, E.; Wright, R. Time series analysis of infrared satellite data for detecting thermal anomalies: A hybrid approach. Bulletin of Volcanology 2010, 73, 577–593.