Scholarship@Western
Scholarship@Western
Electronic Thesis and Dissertation Repository
4-11-2013 12:00 AM
Pulmonary Structure and Function in Chronic Obstructive
Pulmonary Structure and Function in Chronic Obstructive
Pulmonary Disease Evaluated using Hyperpolarized Noble Gas
Pulmonary Disease Evaluated using Hyperpolarized Noble Gas
Magnetic Resonance Imaging
Magnetic Resonance Imaging
Miranda Kirby
The University of Western Ontario
Supervisor Dr. Grace Parraga
The University of Western Ontario
Graduate Program in Medical Biophysics
A thesis submitted in partial fulfillment of the requirements for the degree in Doctor of Philosophy
© Miranda Kirby 2013
Follow this and additional works at: https://ir.lib.uwo.ca/etd
Recommended Citation Recommended Citation
Kirby, Miranda, "Pulmonary Structure and Function in Chronic Obstructive Pulmonary Disease Evaluated using Hyperpolarized Noble Gas Magnetic Resonance Imaging" (2013). Electronic Thesis and
Dissertation Repository. 1169.
https://ir.lib.uwo.ca/etd/1169
This Dissertation/Thesis is brought to you for free and open access by Scholarship@Western. It has been accepted for inclusion in Electronic Thesis and Dissertation Repository by an authorized administrator of
MAGNETIC RESONANCE IMAGING
(Thesis Format: Integrated Article)
by
Miranda Kirby, BSc
Graduate Program in Medical Biophysics
A thesis submitted in partial fulfillment of the requirements for the degree of
Doctor of Philosophy
The School of Graduate and Postdoctoral Studies The University of Western Ontario
London, Ontario, Canada
ii
Abstract
Chronic obstructive pulmonary disease (COPD) is the 4th leading cause of death worldwide and accounts for the highest rate of hospital admissions in Canada. The need for sensitive regional and surrogate measurements of lung structure and function in COPD continues to motivate the development of non-radiation based and sensitive imaging approaches, such as hyperpolarized helium-3 (3He) and xenon-129 (129Xe) magnetic resonance imaging (MRI). The static ventilation images acquired using these approaches allows us to directly visualize lung regions accessed by the hyperpolarized gas during a breath-hold, as well as quantify the regions without signal referred to as the percentage of the thoracic cavity occupied by ventilation defects (VDP). The lung micro-structure can also be probed using diffusion-weighted imaging which takes advantage of the rapid diffusion of 3He and 129Xe atoms to generate surrogate measurements of alveolar size, referred to as the apparent diffusion coefficient (ADC). Here we evaluated COPD lung structure and function using hyperpolarized gas MRI measurements longitudinally, following treatment and in early disease. In COPD ex-smokers, we demonstrated 3He VDP and ADC worsened significantly in only 2 years although there was no change in age-matched healthy volunteers, suggestive of disease progression. We also evaluated COPD ex-smokers pre- and post-bronchodilator and showed regional improvements in gas distribution following bronchodilator therapy
regardless of spirometry-based responder classification; the ADC measured in these same COPD ex-smokers also revealed significant reductions in regional gas trapping post-bronchodilator. Although 3He MRI has been more widely used, the limited global quantities necessitates the transition to hyperpolarized 129Xe, and therefore we directly compared 3He and 129Xe MRI in the same COPD ex-smokers and showed significantly greater gas distribution abnormalities for 129Xe compared to 3He MRI that were spatially and significantly related to lung regions with elevated ADC. Finally, we demonstrated that ex-smokers with normal spirometry but abnormal diffusion capacity of the lung for carbon monoxide (DLCO) had significantly worse symptoms, exercise capacity and 3He ADC than
ex-smokers with normal DLCO. These important findings indicate that hyperpolarized gas
iii
Keywords
Hyperpolarized 3He Magnetic Resonance Imaging, Hyperpolarized 129Xe Magnetic Resonance Imaging, Chronic Obstructive Pulmonary Disease, Emphysema, Apparent
iv
Co-Authorship Statement
The following thesis contains seven manuscripts published in scientific journals. Chapter 2 is an original research article titled “Chronic Obstructive Pulmonary Disease: Longitudinal
Hyperpolarized 3He MR Imaging” and was published in the journal Radiology in 2010. This manuscript was co-authored by Miranda Kirby,Lindsay Mathew, Andrew Wheatley, Giles E Santyr, David G McCormack and Grace Parraga. Chapter 3 is an original research article titled “Hyperpolarized 3He Magnetic Resonance Functional Imaging Semiautomated Segmentation” and was published in the journal Academic Radiology in 2012. This manuscript was co-authored by Miranda Kirby, Mohammadreza Heydarian, Sarah Svenningsen, Andrew Wheatley, David G McCormack, Roya Etemad-Rezai and Grace Parraga. Chapter 4 is an original research article titled “Chronic obstructive pulmonary disease: quantification of bronchodilator effects by using hyperpolarized ³He MR imaging” and was published in the journal Radiology in 2011. This manuscript was co-authored by Miranda Kirby,Lindsay Mathew, Mohammadreza Heydarian, Roya Etemad-Rezai, David G McCormack and Grace Parraga. Chapter 5 is an original research article titled “Evaluating Bronchodilator Effects in Chronic Obstructive Pulmonary Disease using Diffusion-Weighted Hyperpolarized Helium-3 Magnetic Resonance Imaging” and was published in the Journal of Applied Physiology in 2012. This manuscript was co-authored by Miranda Kirby, Mohammadreza Heydarian, Andrew Wheatley, Roya Etemad-Rezai, David G McCormack and Grace Parraga. Chapter 6 is an original research article titled “Hyperpolarized Helium-3 and Xenon-129 Magnetic Resonance Imaging in Healthy Volunteers and Subjects with Chronic Obstructive Pulmonary Disease” and was published in the journal Radiology in 2012. This manuscript was co-authored by Miranda Kirby, Sarah Svenningsen, Amir
v CO
capacity and hyperpolarized helium-3 magnetic resonance imaging” and was accepted and is currently in press in Thorax (Accepted March 28, 2013). This manuscript was co-authored by Miranda Kirby, Amir Owrangi, Sarah Svenningsen, Andrew Wheatley, Harvey O Coxson, Nigel AM Paterson, David G McCormack and Grace Parraga. Appendix A is an original research article titled “Quantitative Evaluation of Hyperpolarized Helium-3 Magnetic Resonance Imaging of Lung Function Variability in Cystic Fibrosis” and was published in the journal Academic Radiology in 2011. This manuscript was co-authored by Miranda Kirby, Sarah Svenningsen, Hassan Ahmed, Nigel AM Paterson and Grace Parraga. Appendix B is a case report titled “Hyperpolarized Helium-3 Magnetic Resonance Imaging
of Chronic Obstructive Pulmonary Disease Exacerbation: Case Report” and was published in the Journal of Magnetic Resonance in Medicine in 2012. This manuscript was co-authored by Miranda Kirby, Nikhil Kanhere, Roya Etemad-Rezai and David G McCormack and Grace Parraga.
As the 1st author of these published peer-reviewed manuscripts, I assisted with the acquisition of the data including subject scanning and coaching breath-hold maneuvers during the subject study visits and I also assisted with the acquisition of pulmonary function test measurements. I also contributed to the conception and design of the experiments, performed the statistical data analysis and assisted with interpretation of the results, as well as drafting, final revisions and final approval of the manuscript. Dr. Lindsay Mathew (Chapter 2,4), Dr. Amir Owrangi (Chapter 6-8), Sarah Svenningsen (Chapter 3,6-8, Appendix A), Hassan Ahmed (Appendix A) and Nikhil Kanhere (Chapter 7, Appendix B) assisted with the acquisition of data, provided assistance with statistical analysis and interpretation of results as well as contributed editorial assistance for the manuscripts they co-authored and provided final approval of the manuscript. Dr. Mohammadreza Heydarian (Chapter 3-5) and Andrew Wheatley (Chapter 2,3,5-8) provided assistance with data analysis and contributed to the development of image registration/segmentation software as well as contributed editorial assistance for the manuscripts they co-authored and provided final approval of the manuscript. Drs. Giles E Santyr (Chapter 2,6,7), Alexei Ouriadov (Chapter 6), Roya Etemad-Rezai (Chapter 3-6, Appendix B), Nigel AM Paterson (Chapter 7,8),
vi
they co-authored as well as contributed editorial assistance and provided final approval of the manuscript. Dr. David G McCormack (Chapter 2-8, Appendix B) provided ongoing guidance as well as clinical expertise with the interpretation of results as well as with the manuscript drafting and revision, and provided final approval of the manuscripts. Dr. Grace Parraga (Chapters 2-8), as the principal investigator and the author’s supervisor, provided ongoing guidance and contributed to the conception and design, data acquisition and analysis plan and interpretation, drafting and final revisions of manuscript and final approval as well as guarantor of integrity of the data as well as responsible for Good Clinical Practice.
Pulmonary function test measurements were acquired by Sandra Halko and Shayna McKay.
vii
Acknowledgments
First, I would like to thank my supervisor Dr. Grace Parraga. I am very grateful for the work environment she has created that focuses on team work and productivity. I appreciated all of
the opportunities she has given me to work with the clinical staff performing the study visits as well as the numerous opportunities to mentor and collaborate with other students in the lab. I am also very grateful to her for challenging me and pushing me much further than I thought possible. She has taught me many lessons during my time at Robarts and I am very grateful to her for her guidance and support.
I would also like to thank the members of my advisory committee for their ongoing guidance and support throughout my graduate studies. Each of the members of my committee: Dr. Aaron Fenster, Dr. David G McCormack and Dr. Charles McKenzie challenged me with difficult questions, encouraged me to develop and improve my skills and always showed interest and enthusiasm for my research. I am especially grateful for the opportunity I have had to work with Dr. McCormack. I really appreciated and enjoyed all of the meetings we had to discuss our results and manuscripts, and I am very grateful for his insightful comments and clinical expertise that have been invaluable to our research.
To the Parraga crew, it has been a pleasure working with each of you. To Mr. Andrew Wheatley, thank you for always being kind, patient and helpful, thank you for your insightful and intelligent questions and for always catching my spelling mistakes. I have also appreciated all of your help making sure my computer was up to date and working properly. To Sandra, Shayna and Trevor, thank you for being so wonderful at what you do and making the study visits so much fun for our subjects and for me too. Sandra, I especially appreciated all the time you have spent with me looking up clinical data, teaching me to perform the
pulmonary function tests, answering all of my questions regarding the study subjects and visits, and, most importantly, chatting about the books we were reading.
viii
her. To Laura Wilson and Hassaan Ahmed, we started our graduate studies together and I could not have asked for two better lab mates. We struggled through classes together, kept each other company in the dark room, celebrated each other’s accomplishments and had many good laughs along the way. To Amir Owrangi: thank you for always cheering me up by having a big smile on your face and for your great sense of humor. To Sarah Svenningsen: I have really enjoyed our conversations about science and life, and I look forward to watching you excel in all your future endeavors. Many thanks to all of the other graduate students: Steve Costella for your intelligent and insightful questions, Daniel Buchanan and Nikhil Kanhere for the coffee breaks and fun outside of the lab, Khadija
Sheikh for the fun lunch break chats and Damian Pike for the endless entertainment you provide with your unique sense of humor.
Finally, I would like to thank Jesse for his encouragement and support and my family and friends for their patience and understanding. It means so much to me to have so many people that have supported and encouraged me throughout this process and continue to do so.
I am also very grateful for the financial support I have received during my graduate studies that allowed me to focus my time and energy on research. I acknowledge funding support from the Natural Sciences and Engineering Research Council of Canada, the Canadian Institutes of Health Research Strategic Training Program in Vascular Research, the Ontario Graduate Scholarship and the Schulich Graduate Scholarship.
ix
Table of Contents
Co-Authorship Statement ... iv
Acknowledgments ... vii
Table of Contents ... ix
List of Appendices ... xv
List of Tables ... xvi
List of Figures ... xviii
List of Abbreviations ... xxi
CHAPTER 1 ... 1
1 INTRODUCTION ... 1
1.1 Burden of COPD ... 1
1.2 The Respiratory System: Structure and Function ... 4
1.2.1 The Airways: Conducting Zone ... 4
1.2.2 The Airways: Respiratory Zone ... 5
1.2.3 Ventilation... 6
1.2.4 The Alveoli: Site of Gas Exchange ... 7
1.3 Established Tests of Lung Function ... 7
1.3.1 Pulmonary Function Tests ... 8
1.3.2 6 minute Walk Test ... 12
1.3.3 St. George’s Respiratory Questionnaire ... 12
1.3.4 Other Pulmonary Function Tests ... 12
1.4 Lung Function Decline ... 13
1.4.1 The Aging Lung ... 13
1.4.2 COPD: Accelerated Lung Aging ... 15
x
1.5.2 X-ray Computed Tomography ... 24
1.5.3 Nuclear Medicine ... 28
1.6 Magnetic Resonance Imaging ... 29
1.6.1 Conventional Proton MRI ... 29
1.7 Thesis Hypotheses and Objectives ... 35
1.8 References ... 39
CHAPTER 2 ... 60
2 Longitudinal Hyperpolarized 3He Magnetic Resonance Imaging of COPD ... 60
2.1 Introduction ... 60
2.2 Materials and Methods ... 61
2.2.1 Subjects ... 61
2.2.2 Pulmonary Function Tests ... 62
2.2.3 Imaging ... 62
2.2.4 Image Analysis... 63
2.2.5 Statistical Methods ... 64
2.3 Results ... 65
2.4 Discussion ... 71
2.5 References ... 75
2.6 Supplementary Tables ... 81
2.7 Supplementary Figures ... 83
CHAPTER 3 ... 84
3 Hyperpolarized 3He Magnetic Resonance Imaging Semi-automated Segmentation ... 84
3.1 Introduction ... 84
xi
3.2.2 Image Acquisition ... 86
3.2.3 Manual Segmentation ... 87
3.2.4 Semi-automated Segmentation: Overview of Method ... 87
3.2.5 3He MRI Automated Segmentation: K-means Clustering Algorithm ... 88
3.2.6 1H MRI Automated Segmentation: Seeded Region-growing ... 90
3.2.7 Landmark-based Image Registration ... 91
3.2.8 Statistical Analysis ... 91
3.3 Results ... 93
3.4 Discussion ... 101
3.5 References ... 105
3.6 Supplementary Tables ... 110
CHAPTER 4 ... 111
4 Chronic Obstructive Pulmonary Disease: Quantification of Bronchodilator Effects by using Hyperpolarized 3He MR Imaging ... 111
4.1 Introduction ... 111
4.2 Materials and Methods ... 112
4.2.1 Subjects ... 112
4.2.2 Pulmonary Function Tests ... 113
4.2.3 Image Acquisition ... 113
4.2.4 Image Analysis... 114
4.2.5 Statistical Methods ... 115
4.3 Results ... 117
4.4 Discussion ... 122
4.5 References ... 126
xii
5 Evaluating Bronchodilator Effects in Chronic Obstructive Pulmonary Disease using Diffusion-weighted Hyperpolarized Helium-3 Magnetic Resonance Imaging
... 134
5.1 Introduction ... 134
5.2 Materials and Methods ... 135
5.2.1 Subjects ... 135
5.2.2 Pulmonary Function Tests ... 136
5.2.3 Image Acquisition ... 136
5.2.4 Image Analysis... 137
5.2.5 Statistical Methods ... 140
5.3 Results ... 140
5.4 Discussion ... 145
5.5 References ... 150
CHAPTER 6 ... 155
6 Hyperpolarized 3He and 129Xe MR Imaging in Healthy Volunteers and Patients with Chronic Obstructive Pulmonary Disease ... 155
6.1 Introduction ... 155
6.2 Materials and Methods ... 156
6.2.1 Subjects ... 156
6.2.2 Pulmonary Function Tests ... 156
6.2.3 Image Acquisition ... 157
6.2.4 Image Analysis... 159
6.2.5 Statistical Methods ... 160
6.3 Results ... 161
6.4 Discussion ... 167
xiii
CHAPTER 7 ... 180
7 Pulmonary Ventilation Visualized using Hyperpolarized Helium-3 and Xenon-129 Magnetic Resonance Imaging: Differences in COPD and Relationship to Emphysema ... 180
7.1 Introduction ... 180
7.2 Materials and Methods ... 182
7.2.1 Subjects ... 182
7.2.2 Pulmonary Function Tests ... 182
7.2.3 Image Acquisition ... 182
7.2.4 Image Analysis... 183
7.2.5 Density and Viscosity Estimates ... 185
7.2.6 Statistical Methods ... 187
7.3 Results ... 188
7.4 Discussion ... 193
7.5 References ... 198
CHAPTER 8 ... 204
8 On the Role of abnormal DLCO in Ex-smokers Without Airflow Limitation: Symptoms, Exercise Capacity and Hyperpolarized Helium-3 Magnetic Resonance Imaging ... 204
8.1 Introduction ... 204
8.2 Materials and Methods ... 206
8.2.1 Study Subjects ... 206
8.2.2 Spirometry, Plethysmography and other Tests ... 206
8.2.3 Image Acquisition ... 206
8.2.4 Image Analysis... 207
8.2.5 Statistical Methods ... 207
xiv
8.5 References ... 218
CHAPTER 9 ... 224
9 Conclusions and Future Directions ... 224
9.1 Overview and Research Questions ... 224
9.2 Summary and Conclusions ... 226
9.3 Limitations ... 229
9.3.1 Study Specific Limitations ... 229
9.3.2 General Limitations ... 232
9.4 Future Directions ... 232
9.4.1 Airway Morphology and Hyperpolarized 3He MRI Ventilation Defects 232 9.4.2 Hyperpolarized 3He MRI and CT COPD Phenotypes ... 237
9.4.3 Hyperpolarized 3He MRI Phenotypes of COPD: Relationship to Exacerbations ... 239
9.4.4 Hyperpolarized Noble Gas MRI of Pediatric Lung Disease ... 241
9.5 Significance and Impact ... 244
xv
List of Appendices
APPENDIX A ... 252
APPENDIX B ... 272
APPENDIX C - PERMISSIONS FOR REPRODUCTION OF SCIENTIFIC ARTICLES 284
APPENDIX D- HEALTH SCIENCE RESEARCH ETHICS BOARD APPROVAL
NOTICES ... 300
xvi
List of Tables
Table 1-1 Classification of Severity of Airflow Limitation in COPD ... 16
Table 2-1 Subject Demographics ... 66
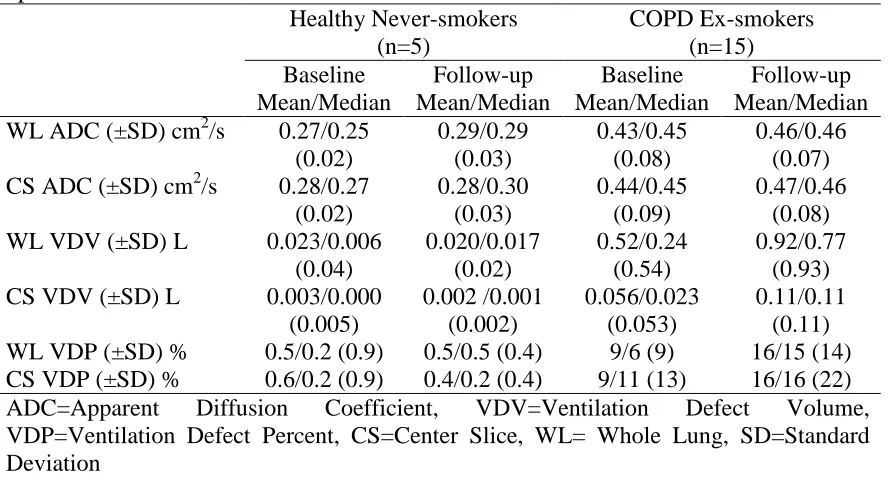
Table 2-2 3He MRI ADC and Ventilation Defect Measurements at Baseline and Follow-up ... 66
Table 2-3 Annualized changes in pulmonary function and 3He MRI measurements for COPD subjects at follow-up ... 67
Table 2-4 Relationship between changes in FEV1 and 3He MRI measurement changes for
COPD subjects over time ... 69
Table 3-1 Subject Demographics ... 94
Table 3-2 Manual and semi-automated 3He volume measurements ... 96
Table 3-3 Intra-observer reproducibility of manual and semi-automated 3He volume
measurements ... 98
Table 3-4 Inter-observer reproducibility of semi-automated 3He volume measurements ... 99
Table 3-5 Smallest detectable difference for manual and semi-automated segmentation .... 100
Table 3-6 Dice coefficients for manual and semi-automated segmentation ... 101
Table 4-1 Subject Demographics ... 117
Table 4-2 Pre- and post-salbutamol measurements ... 118
Table 4-3 Subject listing of changes in spirometry and 3He MRI measurements after
salbutamol administration ... 122
xvii
pulmonary function measurements ... 142
Table 6-1 Subject Demographics ... 162
Table 6-2 3He and 129Xe MRI Measurements ... 165
Table 6-3 Relationships between 3He and 129Xe MRI with pulmonary function measurements ... 166
Table 7-1 Density and Viscosity Estimates ... 187
Table 7-2 Subject listing of pulmonary function measurements ... 189
Table 7-3 3He and 129Xe MRI WL and Regional ADC for all subjects ... 190
xviii
List of Figures
Figure 1-1 The top four leading causes of death in the world in 2004 and the predicted top
four leading causes of death in 2030 compared ... 1
Figure 1-2 Proportion of all deaths due to respiratory disease for men and women in Canada 2 Figure 1-3 Repeat Hospitalizations by Condition at First Admission ... 3
Figure 1-4 Schematic of the Human Airways ... 5
Figure 1-5 Schematic showing the rapid increase in the cross sectional area of the airways as the airway generation increases within the respiratory zone. ... 6
Figure 1-6Measurement of the Forced Expiratory Volume in 1 second (FEV1) and the Forced Vital Capacity (FVC) ... 8
Figure 1-7 The Volumes and Capacities of the Lung Measured using Body Plethysmography ... 9
Figure 1-8 Measurement of the Diffusing Capacity of the Lung for Carbon Monoxide ... 11
Figure 1-9 Lung volume changes that occur with age ... 15
Figure 1-10 Lung Function Decline ... 18
Figure 1-11 Small Airways Disease and Emphysema in COPD ... 22
Figure 1-12 Chest x-ray of a COPD subject ... 24
Figure 1-13 Coronal CT of a healthy smoker and a COPD ex-smoker ... 26
Figure 1-14 CT airway analysis of a COPD subject ... 27
Figure 1-15 Comparison of CT and Conventional MRI in a COPD subject ... 30
xix
never-smokers ... 68
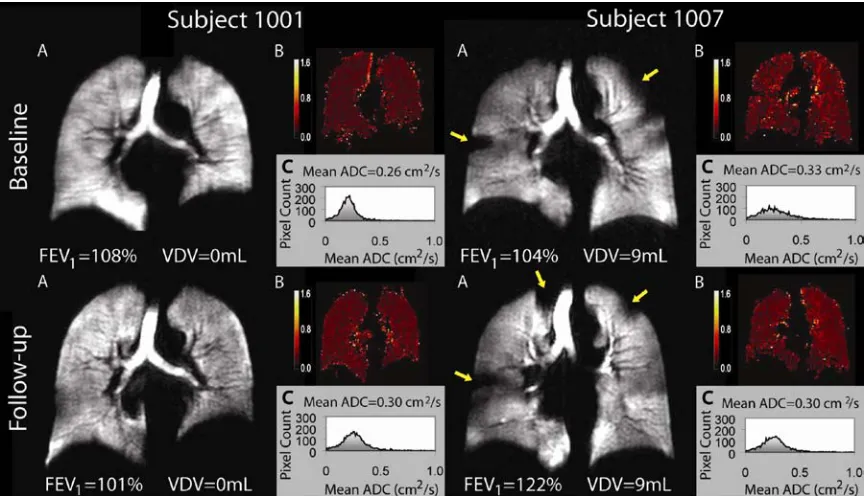
Figure 2-2 Representative hyperpolarized 3He MR VDV and ADC changes during follow-up in COPD ... 69
Figure 2-3 Relationship between 3He MRI measurements and changes in FEV1 ... 70
Figure 2-4 Relationship between 3He MRI VDV, FEV1 and smoking history ... 70
Figure 3-1 Schematic of 3He semi-automated segmentation methodology ... 90
Figure 3-2 Manual and semi-automated segmentation results for representative asthma, COPD and CF subjects. ... 95
Figure 3-3 Correlations and Bland-Altman plots between manual and semi-automated VDV for all slices. ... 97
Figure 4-1 Overview of 3He MRI pulmonary ventilation semi-automated segmentation .... 115
Figure 4-2 3He MRI pre- and post-salbutamol ... 119
Figure 4-3 Correlation between baseline FEV1 %pred and VDP and the post-salbutamol change in FEV1... 120
Figure 4-4 Mean changes in VDP for BR and BNR. ... 121
Figure 5-1 3He MRI Image Analysis Methodology ... 139
Figure 5-2 3He WL ADC pre-salbutamol and post-salbutamol. ... 142
Figure 5-3 Regional 3He MRI ADC ... 143
Figure 5-4 Regional 3He MRI ADC ... 144
xx
with COPD ... 163
Figure 6-2 Relationship between 3He MRI and 129Xe MRI VDP and ADC ... 165
Figure 6-3 Relationships between 3He and 129Xe MRI ADC with CT measurements ... 167
Figure 7-1 Regional 3He and 129Xe MRI image analysis methodology... 185
Figure 7-2 3He and 129Xe ADC maps for two representative subjects with slices in the anterior-to-posterior direction ... 191
Figure 7-3 Regional 3He and 129Xe ADC ... 192
Figure 7-4 Correlation for the difference between 3He and 129Xe VV and CT HU15% Threshold ... 193
Figure 8-1 3He MRI static ventilation images and 3He ADC maps for a representative ND and two representative AD and COPD stage I ex-smokers. ... 211
Figure 8-2 Regional 3He MRI ADC Anterior-Posterior Gradients (APG) for ND, AD and stage I COPD subjects and Correlation between 3He ADC APG with 6MWD ... 212
Figure 8-4 Correlation between 3He ADC and CT RA950 with DLCO, SGRQ and 6MWD for ND, AD and stage I COPD subjects. ... 213
Figure 9-1 CT and 3He MRI in Asthma ... 235
Figure 9-2 Evaluation of CT and 3He MRI in COPD ... 237
xxi
List of Abbreviations
AD Abnormal DLCO
ADC Apparent Diffusion Coefficient
ANOVA Analysis of Variance
AP Anterior-Posterior
ATS American Thoracic Society
BW Bandwidth
CAT COPD Assessment Test
CF Cystic Fibrosis
CI Confidence Interval
CO Carbon Monoxide
COPD Chronic Obstructive Pulmonary Disease
COV Coefficient of Variation
CS Center Slice
CT Computed Tomography
CTS Canadian Thoracic Society
DLCO Diffusing Capacity of the Lung for Carbon Monoxide
DW Diffusion-Weighted
ERS European Respiratory Society
ERV Expiratory Reserve Volume
ES Effect Size
FEV1 Forced Expiratory Volume in 1 second
FGRE Fast Gradient Recalled Echo
FOV Field of View
FRC Functional Residual Capacity
FVC Forced Vital Capacity
G Gradient amplitude
GOLD Global Initiative for Chronic Obstructive Lung Disease
GOLD-U GOLD-Unclassified
1
H Proton
3
He Helium-3
HIPAA Health Insurance Portability and Accountability Act
HU Housfield Unit
HU15% 15th Percentile of the frequency distribution of Housfield Units
IC Inspiratory Capacity
ICC Interclass Correlation Coefficient
IRV Inspiratory Reserve Volume
MAA Macro-Aggregated Albumin
MANOVA Multivariate Analysis of Variance
mMRC Modified British Medical Research Council
MRI Magnetic Resonance Imaging
mSv Millisieverts
N2 Nitrogen
ND Normal DLCO
NDW Non-Diffusion-Weighted
xxii
PVV Percent Ventilated Volume
RA950 Relative Area with Attenuation values below -950 HU
RF Radiofrequency
ROI Region of Interest
RV Reserve Volume
SaO2 Arterial Oxygen Saturation
SDD Smallest Detectable Difference
SGRQ St. George’s Respiratory Questionnaire
SNR Signal-to-Noise Ratio
SPECT Single Photon Emission Tomography
SRGA Seeded Region-Growing Algorithm
STPD Standard Temperature Pressure and Dry
TCV Thoracic Cavity Volume
TLC Total Lung Capacity
TE Echo Time
TR Repetition Time
TV Tidal Volume
UTE Ultra-short Echo Time
VC Vital Capacity
VDP Ventilation Defect Percent
VDV Ventilation Defect Volume
VV Ventilation Volume
WA% Wall Area Percent
WL Whole Lung
129
Xe Xenon-129
6MWT 6 Minute Walk Test
6MWD 6 Minute Walk Distance
CHAPTER 1
1
INTRODUCTION
Chronic Obstructive Pulmonary Disease (COPD), a common preventable and treatable disease, is characterized by persistent airflow limitation that is usually progressive and associated with an enhanced chronic inflammatory response in the airways and the lung to noxious particles or gases.1 The objective of Chapter 1 is to provide motivation for the work presented in the remaining chapters of this thesis, as well as to provide an overview of the current standard measurements of pulmonary function, the natural history and progression of lung function decline, the underlying disease mechanisms and finally discuss how nuclear medicine, computed tomography (CT) and magnetic resonance imaging (MRI) have been used to evaluate COPD and provide imaging biomarkers that can be used to evaluate disease progression and treatment response.
1.1
Burden of COPD
According to the World Health Organization estimates in 2004, 64 million people, or 10% of the population, was suffering from COPD.2 Three million people died of COPD which equaled just over 5% of all global deaths and ranked COPD as the 4th leading cause of death worldwide.2;3 By the year 2030, it is predicted that COPD will increase to the 3rd leading cause of death worldwide, as shown in Figure 1-1.2 It is suggested that the projected increase in the global burden of COPD is due to the aging population and the increasing levels of tobacco smoking in many middle- and low-income countries.2
Similarly, in Canada alone, respiratory disease is ranked the 3rd leading cause of death behind cardiovascular disease and cancer, and among all respiratory diseases that results in death, COPD is responsible for the greatest proportion of all deaths for both men and
Figure 1-1 The top four leading causes of death in the world in 2004 and the predicted top four leading causes of death in 2030 compared
women as shown in Figure 1-2.4 In addition to being a leading cause of death and disability,2 COPD also imposes significant healthcare costs with exacerbations of COPD, defined as COPD-related symptoms including one or more of the following lasting at least 3 days: cough, wheeze, dyspnea, or sputum production,5 accounting for the greatest proportion of the total COPD burden on the Canadian healthcare system. The Canadian Institute for Health Information showed that in 2006, COPD accounted for the highest rate of hospital admission among the major chronic illnesses.6 This rate also included single and repeat hospitalizations indicating that there is a much higher readmission rate for COPD than any other chronic illness including angina, asthma, heart failure, diabetes and epilepsy, as shown in Figure 1-3. A study by Mittmann and colleagues5 indicated that the average cost of an exacerbation requiring hospitalization in Canada was nearly $10,000, with an average length of stay of 10 days. The authors also estimated that the national cost burden for the direct costs associated with COPD exacerbations ranged from $646 million to $736 million per annum.5
Cigarette smoking has long been recognized as the most important risk factor for the development of COPD,7 greater than that of atmospheric pollution or occupational exposure, although the association between occupational exposure (airborne dusts, fumes and vapors) and COPD has been demonstrated independent of cigarette smoking.7-9
Figure 1-2 Proportion of all deaths due to respiratory disease for men and women in Canada
Although there has been less evidence to support the association between second-hand smoke exposure and the risk of developing COPD,10;11 more recent studies suggest there is a causal relationship between exposure to second-and smoke and COPD. There is also a genetic risk factor, alpha-1-antitrypsin deficiency, that has been shown to be associated with an increased risk of COPD.12;13 Other COPD risk factors have been suggested,1 such as prior tuberculosis, socioeconomic status and asthma, however more work must be done to understand the effect of these and other risk factors on the development of COPD as COPD in those who have never smoked remains poorly understood.14
Recent international epidemiological studies have reported prevalence estimates that suggest that approximately 9-10% of adults aged 40 years and older have COPD.14;15 Importantly, this estimate is much higher than previous estimates15 and studies have shown that of these individuals that were determined to have COPD, only 19% had been
Figure 1-3 Repeat Hospitalizations by Condition at First Admission
previously diagnosed and were being treated.16 These studies indicate that the prevalence of COPD is much higher than previously believed and that the majority of the individuals that have the disease are not diagnosed and are not being treated.
In the following section I will describe the structure and function of the lung, introduce the basic mechanisms by which this structure and function is abnormal in COPD, as well as describe the current gold standards for assessing lung function.
1.2
The Respiratory System: Structure and Function
In humans, the respiratory system includes the oral and nasal cavities, the lungs, the conducting airways, the parts of the central nervous system concerned with the control of the muscles of respiration, and the chest wall structures.17;18 The respiratory system serves several functions, however, the main function of the respiratory system is to supply the tissues of our body with oxygen for cellular metabolism and to eliminate the carbon dioxide waste that is produced by cellular metabolism, and this process, known as gas exchange, occurs in the lungs.17-19 In this section I will discuss the process by which air moves from the environment, through the conducting zone and to the respiratory zone for gas exchange.
1.2.1
The Airways: Conducting Zone
The average anatomic dead space is approximately 150 ml in healthy adults,21 however, this volume has been shown to increase with age.22
1.2.2
The Airways: Respiratory Zone
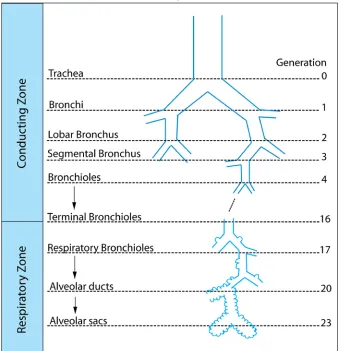
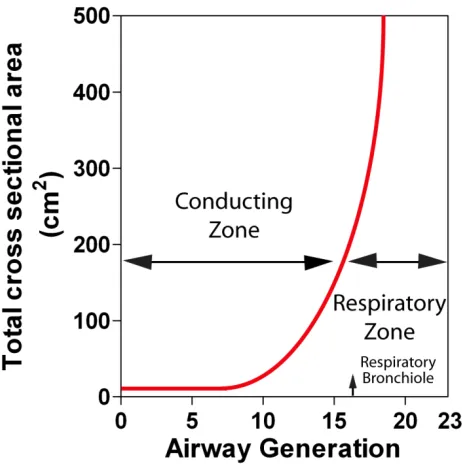
The terminal bronchioles branch into the respiratory bronchioles (generation 17-19), which marks the beginning of the respiratory zone. Due to the large number of airway branching in the respiratory zone, the total cross sectional area of the airways increases rapidly (Figure 1-5). Accordingly, the respiratory zone constitutes approximately 90% of the lung volume, while the airways and the blood vessels of the conducting zone constitute the remaining 10%.20 The respiratory bronchioles, as shown in Figure 1-4, have few alveoli lining their walls. Finally, the respiratory bronchioles divide into the
Figure 1-4 Schematic of the Human Airways
alveolar ducts and the alveolar sacs. The number of alveoli increases from the respiratory bronchioles to the alveolar sacs which consist entirely of alveoli.18 The part of the lung that branches from the respiratory bronchiole and includes the alveolar duct and sac is referred to as an acinus. The acinus represents the functional respiratory unit of the lung where gas exchange occurs.
1.2.3
Ventilation
Ventilation is the process by which gas is brought from the environment to the blood-gas
barrier.19 The volume of gas inhaled and exhaled with each breath, or during one respiratory cycle, is referred to as the tidal volume. Total ventilation is defined as the volume of gas leaving the lung each minute. Therefore, since the average person has a tidal volume of 500 ml and takes approximately 15 breaths/min,19 the volume of gas entering the lung each minute is 7500 ml/min. However, as discussed above, the air that resides within the conducting zone at the end of inspiration does not participate in gas exchange. Therefore, the volume of gas entering the lung each minute that participates in gas exchange, otherwise known as alveolar ventilation, is approximately 5250 ml/min.
Figure 1-5 Schematic showing the rapid increase in the cross sectional area of the airways as the airway generation increases within the respiratory zone.
T P P D A
Diffusion= ⋅ ⋅( 1− 2)
1.2.4
The Alveoli: Site of Gas Exchange
The alveoli are small air sacs at the end of the respiratory bronchioles where gas exchange occurs. It has been estimated that there are approximately 480 million alveoli in the human lungs with a mean size of 4.2x106μm3, or a diameter of roughly 200 μm23 Within each alveoli, oxygen is transported from the alveoli to the pulmonary capillaries by diffusion. The factors that determine the rate of diffusion of O2 from the alveoli to the
pulmonary capillaries is described by Fick’s law for diffusion, as shown in equation (1):
(1)
where A=surface area of the lung for diffusion, D=diffusion coefficient of gas, P1
-P2=partial pressure difference of the gas across the alveolar capillary membrane, and
T=thichness across the alveolar capillary membrane. Therefore, gas diffusion rate is directly proportional to the surface area of the lung, the diffusion coefficient of the gas and the partial pressure difference, and it is inversely proportional to the thickness across the lung membrane.
The total surface area of an average adult’s lungs available for gas exchange is estimated to be approximately 70 m2.24 The gas in the alveoli follows the basic rule of a pressure gradient and diffuses from an area of high pressure within the alveoli (Partial Pressure of Oxygen, [PA02] > 100 mm Hg) to an area of low pressure within the pulmonary
capillaries (PA02 = 40 mm Hg).25 The gas diffusion is slowed by the alveolar capillary
membrane and the thickness of the alveolar capillary membrane of an average healthy adult is approximately 0.2-0.5 μm.17
1.3
Established Tests of Lung Function
1.3.1
Pulmonary Function Tests
Pulmonary Function tests measure the volume and flow of air during inspiration and expiration as well as provide information regarding gas exchange within the lung. These measurements are used for clinical diagnosis of lung disease, for monitoring disease progression as well as for treatment recommendations in patients with respiratory disease.
1.3.1.1
Spirometry
Figure 1-6 Measurement of the Forced Expiratory Volume in 1 second (FEV1) and the
Forced Vital Capacity (FVC)
Body Plethysmograph (MedGraphics Corporation. 350 Oak Grove Parkway St. Paul, MN, USA) is used to measure airflows, lung volumes and capacities (A) and a schematic depicting the airflow curve used to measure FEV1 and FVC (B).
Spirometry is a physiological test that measures how an individual inhales or exhales volumes of air as a function of time.26 The two most common spirometric measurements
are the forced expiratory volume in 1 second (FEV1) and the forced vital capacity (FVC).
As shown in Figure 1-6, these measurements are made while the subject is in the seated position in the Body Plethysmograph chamber. The subject begins with tidal breathing and then is instructed to inhale maximally and then exhale as fast as possible and then continue to exhale as long as possible. Following maximum inhalation, the volume that is exhaled in 1 second is the FEV1 and the total volume that could be maximally exhaled,
According to the American Thoracic Society (ATS)/ European Respiratory Society (ERS) task force, an adequate test requires a minimum of three acceptable maneuvers be performed.26 An acceptable maneuver is one in which all three phases, defined as 1) maximal inspiration; 2) a “blast” of exhalation; and 3) continued complete exhalation to the end of test, were performed correctly and for the required duration. The maneuvers must also be repeatable with the difference between the largest and the next largest FVC ≤ 0.15 L.26
In Canada, the Canadian Thoracic Society (CTS) clinical guidelines specify that spirometry measurements be used to diagnose asthma and COPD, and therefore spirometry should be conducted by trained and qualified personnel, to assure that
ATS/ERS spirometry testing standards are met.27 However, even with technologists trained to meet these standards, spirometry is well-known to be difficult to perform in children and in those with lung disease.
1.3.1.2
Plethysmography
As shown in Figure 1-7, there are eight static lung volume and capacity measurements that can be determined using body plethysmography. The definition of the lung volumes and capacity measurements are as follows: tidal volume (TV) is defined as the volume of gas inhaled or exhaled during normal breathing; the inspiratory reserve volume (IRV) is the maximum volume of gas that can be inspired from the end of a normal inspiration; the expiratory reserve volume (ERV) is the maximum volume of gas that can be expired
Figure 1-7 The Volumes and Capacities of the Lung Measured using Body Plethysmography
from the end of a resting expiration; the residual volume (RV) is the volume of gas remaining in the lungs after a maximal expiration; the vital capacity (VC) is the maximum volume of gas that can be exhaled from the lungs after a maximal inspiration or inhaled from a point of maximal exhalation; inspiratory capacity (IC) is the maximum volume of gas that can be inspired from the normal end-expiratory position; functional residual capacity (FRC) is the volume of gas remaining in the lungs at the end of a resting expiration; and, the total lung capacity (TLC) is the volume of gas in the lungs at the end of a maximal inspiration.28
Clearly, many of these static volumes can be measured directly from normal breathing by instructing the subject to perform the four static positions: maximal inhalation, end
inspiration, end expiration, and maximal exhalation. However, the gas remaining in the lung after a maximal expiration, known as the residual volume (RV), and the volume of gas in the lung after a normal expiration, known as the functional residual capacity (FRC), must be measured with body plethysmography using Boyle’s law.28 The subject is placed in an air-sealed plethysmograph chamber, as shown in Figure 1-6A, and breathes through a mouthpiece with a shutter. At the end of a normal expiration the shutter closes and the subject is instructed to inhale. As the subject tries to inhale, the pressure changes within the box and at the airway can be measured. Since the box volume is known, the volume of gas in the lungs when the shutter was closed (FRC) can be calculated.
1.3.1.3
Diffusing Capacity
The diffusing capacity of the lung for carbon monoxide (DLCO) is another pulmonary
function test that provides an indirect measure of diffusion of gases across the alveolar membrane into the blood. The body plethysmograph, as shown in Figure 1-6A, with the attached Medgraphics gas analyzer allows DLCO to be measured. DLCO is measured by
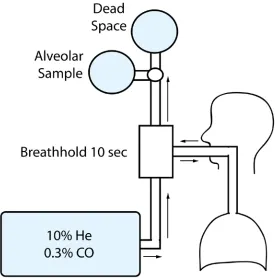
instructing the subject to exhale to RV and then perform a maximum inhalation to TLC. As shown in Figure 1-8, during the inhalation the subject inhales a gas mixture that contains a very low concentration of carbon monoxide (CO) (0.3%) and helium (10%) with air; the subject is then instructed to hold their breath for 10 seconds before
is discarded as it represents the anatomic dead space volume and is defined as 2.2 ml x kg body weight.29 The remaining volume is analyzed by comparing the exhaled concentrations of CO and helium to the inspired concentrations to determine the amount of CO diffusing across the alveolar membrane.
According to the ATS/ERS task force, there should be at least two acceptable tests that meet the repeatability requirement of either being within 3 ml CO standard temperature (273 Kelvin), pressure (101.3 kPa, 760 mmHg) and dry (STPD)·min-1·mmHg-1 of each other or within 10% of the highest value.29 Factors that affect the DLCO include diseases
that reduce the volume of pulmonary capillary blood such as anemia, and diseases that affect the area and thickness of the alveolar capillary membrane including emphysema, interstitial lung disease and pulmonary hypertension.29 Cigarette smoking has also shown to reduce DLCO30 and the ATS/ERS task force recommends that subjects refrain from
smoking on the day the test is performed.29
Pulmonary function test measurements are usually interpreted by comparing measured values in individual subjects with the values that are predicted for healthy subjects based on age, sex, height and race, and expressing the observed value as a percent of predicted.31
1.3.2
6 minute Walk Test
The 6 minute walk test (6MWT) is a self-paced exercise test that measures the distance a
subject can walk on a flat, hard surface in a period of 6 minutes. The 6MWT is thought to reflect the functional exercise level for daily physical activities in subjects with respiratory disease. The 6MWT has been used for measuring the efficacy of inhaled corticosteroids in the treatment of COPD.32 It has also been used as a measure of functional status for COPD subjects33 and the 6 minute walk distance (6MWD) has been demonstrated to correlate significantly with mortality.34-36
1.3.3
St. George’s Respiratory Questionnaire
The St. George’s Respiratory Questionnaire (SGRQ)37 is a questionnaire designed to measure impact on overall health, daily life, and perceived well-being in patients with obstructive airways disease. The questionnaire contains three component scores: symptoms, activity and impact (on daily life), and a total score. Scores range from 0 to 100, with higher scores indicating more severe limitation. In asthmatics and COPD subjects, the test-retest reproducibility has been determined to be high,38;39 and significant correlations have been shown between the SGRQ symptom score with frequency of wheeze, the SGRQ activity score with the 6MWD and between the SGRQ impact score with anxiety.38
1.3.4
Other Pulmonary Function Tests
The Global initiative for chronic Obstructive Lung Disease (GOLD)40 recommends the
dressing or undressing). The mMRC score correlates with standard lung function measurements,42 the 6MWD43 and, importantly, predicts mortality better than evaluating disease severity using the FEV1.44
The CAT is an 8-item questionnaire that assesses the impact of cough, sputum, dyspnea and chest tightness on health status. The CAT scores range from 0 to 40 with the higher scores indicating a more severe impact of COPD symptoms on health status.45 CAT scores have been shown to correlate significantly with SGRQ scores in COPD.45;46
Another test that has been recently developed uses four factors that were determined to have the strongest association with one-year morality, called the BODE index: the body mass index (B), the degree of airflow obstruction (O) measured using FEV1 as a
percentage of the predicted value, dyspnea (D) measured from the score on the mMRC dyspnea scale, and exercise capacity (E) measured using the 6MWD.47 The BODE index after lung volume reduction surgery correlates with survival in COPD patients48 and has been shown to better predict hospitalization for COPD than FEV1 alone.49
1.4
Lung Function Decline
1.4.1
The Aging Lung
As we age, the most important physiological changes that occur in the lung are, 1)
Another important structural change that occurs during aging is the structural changes within lung parenchyma – known as “senile emphysema.” Studies have demonstrated that homogeneous airspace size enlargement occurs over 60 years of age in the normal lungs, without a loss of alveolar attachments and chronic inflammation.53 It has also been demonstrated that there is thickening of alveolar walls and a reduction in the number of peripheral airways.53 A consequence of the reduction in supporting tissues around the airways is a tendency for the small airways to collapse at higher lung volumes.50
The lung physiological changes that occur during aging result in changes in lung function. Figure 1-9 shows the changes in lung volumes that occur during aging. Early studies have shown that during normal aging, the RV increases while the TLC remains
constant.54 The increase in RV that occurs with age is likely due to the decreased strength of the expiratory muscles and the tendency of the small airways to collapse.50 There is also an increase in anatomic dead space that occurs during aging22 and this is thought to be due to calcification of the bronchial cartilage. The DLCO is also been
shown to decrease with age and this is likely a result of the decreased alveolar surface area as well as a decrease in the pulmonary capillary blood volume.55
In the landmark study by Fletcher and Peto in 1977,56 airflow obstruction measured using FEV1 was evaluated for 103 men who were non-smokers aged 30-59. As shown in
Figure 1-10, FEV1 was shown to decline continuously with age. However, this study
was only performed in men and was cross-sectional. Subsequent studies evaluating FEV1
1.4.2
COPD: Accelerated Lung Aging
As described in the previous section on risk factors for COPD, smoking cigarettes, although not the only risk factor, is the main source of inhaled noxic particles that leads to the development of COPD.40;59 However, not all smokers develop airflow limitation; early studies demonstrated that cigarette smoking is associated with inflammation in both the large and small airways60;61 and the lung parenchyma62 in smokers with normal FEV1.
Although it is unclear why some smokers develop COPD while others do not, it is known that the inflammatory response in COPD is amplified63 and persists long after smoking cessation.64 Irreversible airflow limitation is the defining feature of COPD and is associated with “lesions that obstruct the small conducting airways, produce emphysematous destruction of the lung’s elastic recoil force, or both.”65 Importantly, the disease that occurs within the airways and the lung parenchyma are independent disease processes that may develop in tandem or in isolation. In this section I will first introduce how COPD is diagnosed using spirometry and the natural history of COPD. Finally, I will discuss the underlying disease mechanisms that are thought to be responsible for the functional lung changes.
1.4.2.1
Diagnosis and Classification of COPD
When COPD is suspected based on symptoms, such as dyspnea, chronic cough or sputum production, and/or a history of exposure to risk factors,59 airflow limitation is measured
Figure 1-9 Lung volume changes that occur with age
using spirometry and the presence of a post-bronchodilator FEV1/FVC <0.70 confirms
the diagnosis of COPD.1;59 As shown in Table 1-1, COPD severity is determined according to the GOLD criteria, which uses specific spirometric cut-points that are obtained after inhalation of a short-acting bronchodilator in order to minimize variability.59
Table 1-1 Classification of Severity of Airflow Limitation in COPD
GOLD Stage Severity Post-Bronchodilator FEV1 Criteria
GOLD Stage I Mild FEV1≥ 80% predicted
GOLD Stage II Moderate 50% ≤ FEV1 < 80% predicted
GOLD Stage III Severe 30% ≤ FEV1 < 50% predicted
GOLD Stage IV Very Severe FEV1 < 30% predicted
Adapted from the Global strategy for the diagnosis, management, and prevention of chronic obstructive pulmonary disease (Revised 2011), Global Initiative for Chronic Lung Disease1
Although this approach has been introduced due to its diagnostic simplicity and ease of use in the primary care setting, the FEV1/FVC cut off has been acknowledged to
potentially result in an over-diagnosis of COPD in the elderly,66 as well as under-diagnosis of mild or early stage COPD.67 Moreover, there is only a weak correlation between GOLD spirometric severity classification and symptom scores reflecting health-related quality of life.
1.4.2.2
Natural History of Airflow Obstruction in COPD
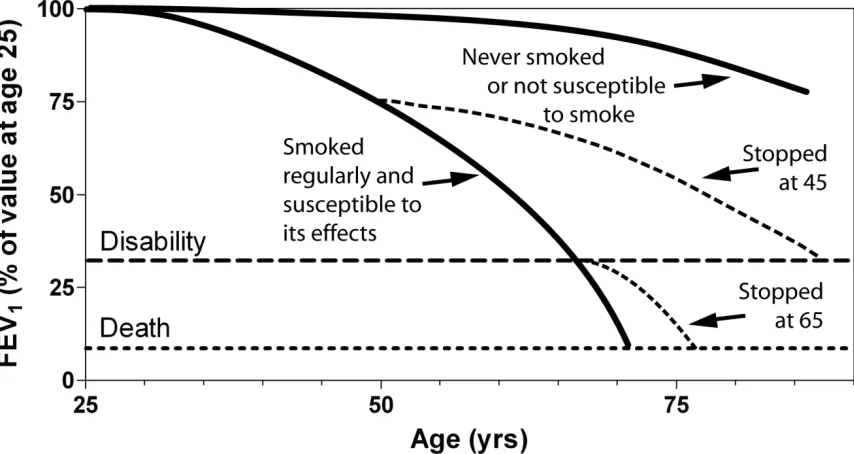
Figure 1-10 reproduces the landmark study by Fletcher and Peto56 that shows the different rates of lung function decline, as measured by FEV1, for healthy individuals that
have never smoked in comparison with those individuals who were current cigarette smokers that exhibit the amplified inflammatory response that is associated with the
development of COPD. This study indicates that while the rate of decline of FEV1 in
smokers and to 66±4 ml/year in heavy smokers. Interestingly, this study also showed that the rate of FEV1 decline was slower in individuals that had quit smoking (32±4 ml/year),
suggesting that decline in lung function can be slowed by smoking cessation. However, as described previously, this was a cross-sectional study in men.
The more recent longitudinal Lung Health Study68;69 also evaluated smokers that were randomized into three groups: a group of smokers who received no intervention, a group of smokers who received smoking cessation intervention, and a group of smokers who received smoking cessation intervention and bronchodilator therapy, and followed the subjects over 11 years. In accordance with the findings by Fletcher and colleagues,56 this study found that men who quit smoking at the beginning of the study had a FEV1 decline
of 30 ml/year while men who continued to smoke had an accelerated declined of 66 ml/year. In contrast to the study performed by Fletcher and colleagues,56 the Lung Healthy Study also evaluated women and showed that women who quit smoking at the beginning of the study had a FEV1 decline of 22 ml/year while women who continued to
smoke declined by 54 ml/year.69 Interestingly, when decline in FEV1 was expressed as a
1.4.2.3
Chronic Bronchitis
Chronic bronchitis is defined as “the presence of cough and sputum production for at least 3 months in each of two consecutive years.”1 Early work investigating chronic bronchitis attributed the mucous hypersecretion with thickening of the bronchial gland.
70-72
Reid70 reported that this thickness was related to gland hypertrophy and that there was a correlation between the amount of sputum produced and gland thickness. It was later shown that chronic bronchitis was associated with bronchial inflammation.60 Mullen and colleagues60 demonstrated that smokers with chronic bronchitis had greater inflammation of the cartilaginous airways (> 4 mm in internal diameter) than smokers without chronic bronchitis, and that there was a significant correlation between inflammation of the cartilaginous airways and mucous gland thickness. These data suggest that chronic cough and sputum production was associated with an inflammatory response due to the cigarette smoke in the cartilaginous (or central) airways. Interestingly, it has also been demonstrated that this inflammatory response persists in the central airways of smokers who had quit but continued to report mucus hypersecretion.64
Figure 1-10 Lung Function Decline
Much of this early work was performed in smokers with and without airflow limitation measured using FEV1 and therefore more recent studies have focused on evaluating
whether there is a predictive relationship between the presence of chronic cough and sputum production and the future occurrence of COPD. de Marco and colleagues73 recently evaluated a group of young subjects, aged 20-45, with normal lung function over a period of approximately 9 years. It was shown that at the baseline visit, 9% of subjects reported chronic cough and sputum production and of these subjects that reported persistent symptoms at follow-up, there was a threefold increased risk of developing COPD.73 Another study demonstrated that chronic cough and sputum production was associated with an increased decline in FEV1 and subsequent hospitalization due to
COPD.74
1.4.2.4
Small Airways Disease
Based on the study by Weibel and Gomez20 it is known that as the airway generation increases, due to the dichotomous branching pattern of the airways, the number of airways rapidly increases and therefore the total cross-sectional area increases, as shown in Figure 1-5. Although the smaller airways could be considered the major site of resistance in normal lungs based on Poiseuille’s equation that indicates that resistance in a single tube is inversely proportional to the radius of the tube to the 4th power, by inspection of the airways and according to Weibel’s data20 we must also consider the number of airways and their total cross-sectional area. Although the radius of the airways decrease as airway generation increases, the number and cross-sectional area of the airways increases.17 Since these airways are arranged in parallel, the resistances are added as reciprocals and therefore the overall resistance is very small in the small airways.
Early studies by Hogg and Macklem75 that directly measured small airway pressure using a retrograde catheter confirmed that in healthy subjects, the small airways contributed very little to the total airway resistance. However, they also demonstrated that in
subjects with mild and severe emphysema, as well as subjects with bronchiectasis and bronchiolitis that there was a marked increase in the resistance of the small airways (<2
observed that the bronchioles were often narrowed and occluded with mucus plugging and defined these changes in the small airways as “small airways disease,” where disease changes may occur without being detected by measuring total airway resistance or by FEV1. Taken together, since the total resistance is determined largely by the more central
airways, disease may accumulate in the small airways without being detected.
It was later shown in histopathological studies that inflammation was present in the peripheral airways of smokers76 and that the most characteristic lesion in the small airways of smokers was respiratory bronchiolitis.61 However, these early reports did not perform spirometry in the smokers and therefore the subjects may or may not have had COPD. A more recent study by Hogg and colleagues77 evaluated the pathology of the
small airways in relation to COPD severity, as measured by the GOLD COPD stages (Table 1).1 These authors found that although the degree to which the lumen was filled with mucous was significantly correlated with the severity of COPD, the strongest parameter associated with progression of COPD from GOLD stage 0 to GOLD stage IV was with thickening of the airway wall.77 It was also shown that the extent of inflammation was significantly correlated with COPD severity.77 Figure 1-11A shows a normal small airway of a non-smoker in comparison with a small airway filled with mucus (Figure 1-11B), a small airway with thickened airway walls and a lumen partially filled with mucus (Figure 1-11C) and a small airway with wall thickening that is thought to restrict airway caliber with lung inflation (Figure 1-11D).
1.4.2.5
Emphysema
Emphysema was first described by Laennec in 1834. He described emphysema of the lungs as “dilation of the air cells” that “may affect both lungs at the same time, one only, or a part of one or of both.”78 More recently, the National Heart, Lung, and Blood Institute defined emphysema as “a condition of the lung characterized by abnormal, permanent enlargement of airspaces distal to the terminal bronchiole, accompanied by the destruction of their walls, and without obvious fibrosis.”79 It is well known that smokers
develop two distinct forms of emphysema: centrilobular and panlobular emphysema.80-82 Centrilobular emphysema results from dilation and destruction of the respiratory
Figure 1-11 Small Airways Disease and Emphysema in COPD
1.5
Imaging Lung Structure and Function in COPD
1.5.1
Chest X-ray
Chest x-ray and x-ray computed tomography (CT) are the two most common lung imaging procedures performed. Chest x-ray is often the first line imaging method because it is widely available, inexpensive, allows visualization of pulmonary structures, including the trachea, carina and major bronchi, mediastinum and hilar regions and the diaphragm, as shown in Figure 1-12, and has a relatively low radiation dose.84 In the posterior-anterior view, as shown in Figure 1-12A, the patient is upright with the x-ray source positioned so that the x-rays enter through the back (posterior lung) and the anterior surface of the chest is against the film holder. The patient’s hands are place on their hips with the elbows rolled slightly forward so that the scapulae (or shoulder blades) are removed from the lung field.85 In the lateral view, as shown in Figure 1-12B, the patient is positioned with their side against the film with their arms over their head so that the arms are not in the lung field.85 The different lung structures described above can be depicted with a chest x-ray because the x-rays are attenuated differently by the various body tissues. For example, the ribs show up as bright structures because they attenuate the x-rays more than the lung tissue, which are air-filled, and show up as dark regions in
the image. This is also the reason why the arms and the scapulae are removed from the lung field.
indicated that a diagnosis of emphysema using chest x-ray was made in only 16% of subjects that were pathologically proven to have mild to moderate emphysema and in only 42% of subjects with moderately severe to severe emphysema.88
1.5.2
X-ray Computed Tomography
Since its introduction in the early 1970s, CT scanning technology has become so advanced that it is now considered by many as the imaging technology of choice for many diseases. As described above, a limitation of conventional x-ray imaging is that it provides a two-dimensional image of a three-dimensional object. CT overcomes this limitation by acquiring the image in slices thereby providing images of three-dimensional objects. Each slice in a CT image is composed of voxels and each voxel is assigned a CT value or Housfield unit (HU) based on the attenuation coefficient relative to water. Therefore, a voxel that contains water will have a value of 0 HU, while air will have a value of -1000 HU and tissues or structures that have a higher attenuation coefficient than water will have a positive HU value; bone has CT values up to 2000 HU.85
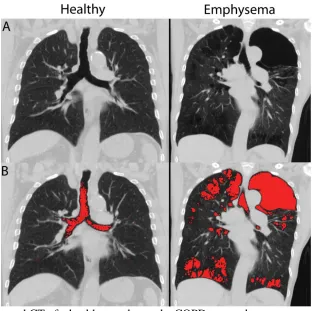
Emphysema is characterized by airspace enlargement,79 and therefore the air-filled emphysematous regions in the lung will appear dark in CT images. Figure 1-13A shows a central slice CT image for a healthy subject and a COPD subject with emphysema. The
Figure 1-12 Chest x-ray of a COPD subject
air filled regions, including the trachea as well as the large left apical bullae in the COPD subject with emphysema appear dark in the image. Early pathological correlative studies demonstrated that regions of the lung that visually appeared to be emphysematous on CT images were confirmed as emphysematous in post-mortem evaluations.90 Later, studies that used radiologist CT grading and pathological grading systems demonstrated that there were strong and statistically significant correlations between CT and pathology emphysema scores,91-93 however it was found that CT could not differentiate mild emphysema from normal parenchyma confirmed by pathology in some patients.92
Although CT was demonstrated to be very accurate in the determination of the presence and extent of moderate to severe emphysema, with strong and significant correlations
found with both pathology91-93 and measurements of airflow limitation and diffusion capacity,93 these early visual scoring systems were subjective and therefore there was considerable inter-observer and intra-observer variability.93 Because visual assessment was based on the presence of voxels with abnormally low attenuation, the extent of emphysema could be assessed by highlighting voxels within specified ranges of HU called “density masks.”94 Density mask emphysema scores were demonstrated to be comparable to visual emphysema scores and had strong and significant correlations with pathologic scores,94 and importantly, eliminated the inter-observer and intra-observer variability introduced by visual assessment. Figure 1-13B shows the CT density mask with all voxels with attenuation values less than -950 HU highlighted in red. Although there are several thresholds that have been introduced, and some contrasting results on which threshold is most appropriate,94-96 it has been demonstrated that the low attenuating areas quantified on CT are indicative of the lung tissue destruction that accompanies emphysema.
Although strong and significant correlations between CT measurements of emphysema and diffusion capacity measurements have been reported, there have been only moderated correlations with measurements of airflow.93;95 This finding is not surprising given that measurements of airflow limitation (FEV1) are measuring the contributions of the loss of
also of great interest to obtain measurements of the airway dimensions from CT. Figure 1-14 shows an airway tree segmentation that was generated in three-dimensions from the CT image. The cross-section of the airway of interest can then be identified and the airway dimensions can be measured. Nakano and colleagues were the first to demonstrate that the percentage of the total airway (airway wall area plus lumen area) that was airway wall (wall area percent, WA%) significantly correlated with airflow limitation, but not DLCO, in COPD smokers independent of emphysema.97 However,
these measurements were based on a large central airway and it is well known, as described above, that the major site of airflow limitation in COPD occurs in the small airways less than 2 mm in diameter.75 Accordingly, more recent studies have
demonstrated that the correlation between CT wall area dimensions with airflow limitation was stronger for higher generation airways.98
Figure 1-13 Coronal CT of a healthy smoker and a COPD ex-smoker
Although thoracic CT is capable of measuring both emphysema and airways disease in COPD, CT is not without its costs and the field of medicine has observed a considerable increase in the number and type of CT scans performed for clinical investigation where now, in the United States, CT accounts for 24% of all radiation exposure and 50% of all medical radiation exposure.99 Importantly, the increase in CT scans was also observed in the paediatric population and a study by Mettler and colleagues100 reported that children aged 0-15 years old accounted for 11.2% of all CT scans performed. This is a concern because the effective dose for a thoracic CT is approximately 8 mSV, which is equivalent to 400 chest x-rays or approximately 4 years of background radiation.85 In COPD, serial imaging is important for evaluating disease progression and response to treatment or intervention, and therefore the increase in radiation exposure from CT has been a major concern because there is an increased risk of radiation-induced cancer from the cumulative dose related to repeated CT investigations.101
Figure 1-14 CT airway analysis of a COPD subject
1.5.3
Nuclear Medicine
In their seminal study on the site and nature of airway obstruction in COPD, Hogg and colleagues stated that as a result of the obstruction of the small airways in the lung, there is a “strong likelihood that, at some stage, chronic obstructive airway disease causes significant abnormalities in the distribution of ventilation, and presumably in gas exchange.”75 Therefore, in COPD ventilation may be highly inhomogeneous across the
lung or absent in certain lung regions all together. Ventilation scintigraphy can be performed with radioaerosols or radioactive gases for visualization of the regional distribution of ventilation in the lung.102 Images can be acquired during the gas wash-in phase, at the “steady state” and during the gas wash-out phase.103 The breathing protocol utilized depends largely on the half-life of the isotope. For example, the short half-life of Krypton-81m of 13 seconds limits its use for evaluating the gas in the wash-in or steady state phase as decay occurs prior to exhalation.103 Studies have demonstrated that subjects with abnormal pulmonary function tests also have abnormal aerosol deposition patterns,104 and smokers with reported symptoms and normal pulmonary function measurements often had abnormalities with xenon-133 or aerosol lung imaging,105;106 suggesting that functional lung imaging may be more sensitive than spirometry for detecting early disease changes. However, central aerosol deposition is often reported and may be caused by the large particle size or by abnormally rapid or shallow breathing patterns, or both.105 Taplin and colleagues105 showed that 10% of subjects having central deposition at one imaging time-point showed normal distribution 1-2 hours later.
The lung attempts to match blood flow to ventilation to maintain optimal efficiency of gas exchange, and therefore subjects with ventilation abnormalities may have perfusion abnormalities as well. Perfusion scintigraphy is often performed using technetium-99m (99mTc) labeled macro-aggregated albumin (MAA) injected in a peripheral vein.103 Studies have shown that there is a significant correlation between perfusion and aerosol lung imaging106 suggesting that regional perfusion abnormalities are likely related to
diminished ventilation within those areas.
While lung scintigraphy acquires two-dimensional projection images, single photon