Volume 8, No. 5, May – June 2017
International Journal of Advanced Research in Computer Science RESEARCH PAPER
Available Online at www.ijarcs.info
Threshold design for cohesion and coupling metrics using K-means clustering
Algorithm
Shaitan Singh Meena
Department of Computer Science and Technology Central University of Punjab
Bathinda (Punjab), India
Dr. Satwinder Singh
Department of Computer Science and Technology Central University of Punjab
Bathinda (Punjab), India
Abstract: As open source systems are becoming popular these days, there is more and more pressure on development teams to produce high-quality software. The high-quality of system (QoS) suffers even after undergoing testing; code smells still remain in the system. Various studies have been focusing on the relationship between metrics and code smells of class. Studies show that various metrics metric have been proposed to check the design quality of software during the development phase. A code smell is a suggestion or the description of an indication that something has gone wrong your code. Refactoring is done to clean the code and to decrease the chance of presenting the bugs in code. In this paper, describee is carried out to examine the relationship between cohesion and coupling metric and bad code smell for the open source code of ArgoUML four versions 0.24, 0.28, 0.30 and 0.34. Cohesion and coupling metrics design is done with the help of SourceMeter tool. PMD is used to collect all the bad code smell which are affecting the class. After that used technique k-means clustering, are used to find the threshold. In this work, it is proposed to use a clustering and metrics threshold based software bad code smell prediction approach and explore it on the dataset of ArgoUML versions. Clustering techniques have more importance in data mining especially when the data size is very large.
Keywords: Refactoring, Bad code smell, Threshold, Cohesion and Coupling metrics, k-means clustering, accuracy
I. INTRODUCTION
It is the vision of every developer to develop a zero defect software. Software quality cannot be improved without knowledge of developer process. Software quality is the degree to which a software meets its requirements. However, evaluating a software system to improve its overall quality is not a trivial task [28]. Software quality can be reach using two important concepts: Software Process Quality and Software Product Quality [20]. A software process quality is a set of activities, practices, methods, and transformations used to develop and to maintain software and the associated products. A software metric is a standard of measure of a degree to which a software system or process possesses some property. Software metric allows empirical estimation as well as improvement of software. Software metrics are used to measure software engineering product, processes and professionals. Software complexity is clear as “a measurement of the resources that must be expended in developing, user training, testing, maintenance, and correction of software products." Complexity has been classified regarding seven different levels [8]. The levels are as following:
• Algorithm
• Code
• Control Structure • Data Structure • Module Coupling • Module Cohesion • Nesting
Among all of these, “Cohesion” and “Coupling” and are measured to be the most important attributes. Cohesion and coupling are the characteristics which the degree of relationship and interaction between elements of the code. One of the main
objectives of object-oriented (OO) metrics analysis and design is implement to software system where classes have low coupling and high cohesion between them. Refactoring is a disciplined technique for improving code design does not change the outside behavior of the code that code improves its internal structure. It is a measured the cleanup code that decreases the probabilities of introducing bugs in code. Flower and Beck [5] have defined the 22 bad smells that describe design problems and suggested some refactoring technique that can help improve the design structure of the code. Code smell, also known as a bad smell, is a hint that something wrong anywhere in software programing code. Stevens et al. [31] first introduced coupling in the context of structured development techniques. They defined coupling as “the degree of the strength of association established by a connection from one module to another." Lower coupling is better for high-quality software. Stevens et al [31] firstly presented cohesion within the module design. Cohesion is highly preferred by the developers because high cohesion is related to several desirable behaviors of software including reliability, understandability and robustness, while low cohesion is related to undesirable behaviors such as being difficult to maintain, reuse, test. Effective use of software metrics in software engineering is reserved by the lack of knowledge on software metric threshold. The threshold can be defined as breakpoints that are used to identify the acceptable risk level. Applying threshold values helps software engineers to highlight and identify areas that may exceed the acceptable risk level in the system [29]. K-means [14] is the simplest unsupervised learning algorithms that solve the well-known grouping problem. The clustering procedure is a simple technique to grouping a given data set prepared a certain no. of clusters (k). The main procedure is to define k centroids, one for each cluster. These centroids should be placed in a calculating way because of different location causes a changed result. The algorithm is executed of the following steps
2. Assign each object to the group that has the closest centroid.
3. When all objects have been assigned, recalculate the positions of the K centroids.
4. Repeat both of step until the centroids no longer move. This produces a separation of the objects into groups from which the metric to be minimized can be calculated.
II. REVIEWOFLITERATURE
A general problem in huge and complex software systems is that they have bugs or errors. Removal of these bugs tends to be a more complex task than locating the same. Prevention of errors seems to be an optimal solution in such scenario. In order to achieve the same, software designer should know about the probable areas in the software which can introduce errors [25]. Fowler and kent [5] introduced the concept of code smell as an indicator of problems within in the code of software by presenting an casual definition of 22 code smells that provide a set of features used as indicator for design flaws with respect to the to the maintainability of software system. [33] Proposed the classification of these bad smell into six groups. They all have proposed theoretical approaches to defining bad smells. Metrics threshold values were identified by analysis of association between metrics and code smell. Applying threshold value helps developers and testers in highlighting and identifying classes that may exceed the acceptable risk level in the system. Bad code smells are used as a means to identify testing classes in object-oriented system for refactoring. Mohemmed [16] presents the performance of K-Mean clustering algorithm, dependent upon various mean values input methods no. of cluster (k). The mean values is the calculated from the centroid of the specific no. of cluster (k) groups. The clustering algorithm consists of two step with first step forming the clusters-calculating centroid and the second step determining the final centroid. They examined the following methods for assigning the mean values in K-Mean clustering algorithm. a) Taking the first k‟ values as cluster. b) Random cluster generation. c) User specified centroid. Rathod [21] compares the results achieved with preprocessing by standardization and without preprocessing by standardization of the data set. The basic algorithm notices outerlier properties in two steps. In first step clusters of original data set are designed by utilizing k-means clustering technique. In the second step, it find the data set from each cluster. Those are distance from their centers. Then the dataset features that are extracted are processed to determine their outliers with the help of statistical methods. The research on different datasets confirm that preprocessing the data set improves the result. Mittal, Sharma and Singh [15] proposed that clustering is one of the data mining techniques that divides the database into number of clusters (k) such that data objects in same clusters are associated and data objects that associating to different cluster are dissimilar. Analyzers have developed many algorithms for clustering but this paper focus on well-defined partitioning technique i.e. k-means with threshold based clustering technique. k-means algorithm partition the database into no. of clusters k where k is the parameter defined by user i.e. 2,3, and continue according user, beside this it is sensitive to outliers and initial seed selection. Nazeer et al. [18] discuss in this paper about the one major disadvantage of the k-means clustering algorithm, for different sets of values of initial clusters, produces changed clusters. Final centroids value in algorithm depends on the selection of initial cluster. In this paper k-means clustering two step includes: first step for determining initial centroids and second for assigning data points to the nearest distance clusters and then recalculating the clustering mean that called is centroid. An improved the
and Parallel k/h-Means Clustering for Large Data Sets. Parallel k/h-Means algorithm is designed to deal with very large datasets. The application end result of this algorithm has been shown with 90% effectiveness in a distributed computing environment. These results show that this algorithm is accessible. Novel K-Means Based Clustering provides the advantages of using both K-Means and HC. Using these two algorithms, space and similarity among the data sets present each nodes is prolonged. Singh et al. [26] In this paper, on the basis of accuracy and running time the performance of hierarchical and k-means clustering algorithm is calculated using WEKA tools. discuss the relative analysis of one partition clustering algorithm (k means) and one hierarchical clustering algorithm. k-means and hierarchical algorithms of accuracy and efficiency are tested used iris and diabetes datasets. This work results that accuracy of k-means is higher than the hierarchical clustering for iris dataset which has actual. Attributes and accuracy of hierarchal clustering algorithm is higher than the k-means clustering for diabetes dataset which has integer actual. Attribute however the time taken to cluster the data sets is less in the case of k-means clustering. So, this paper show that for large data sets of k means algorithm is good. Wang et al. [34] in this paper propose an improved accuracy k-means algorithm using noise data filter. This proposed algorithm overcomes the shortcomings of traditional k-means clustering algorithm. The algorithm improves density based detection techniques based on features of noise data where the processing and discovery steps of the noise dataset are additional to the original algorithm. The data to exclude these noise data by pre-processing before clustering datasets the cluster cohesion metric of the k-means clustering results is improved significantly and the impact of noise dataset on k-means algorithm is the clustering results are more accurate and decreased effectively. Singh et al. [27] in this paper a modified k-means algorithm depend on the sensitivity of initial center of clusters and this technique whole space is partitioned into different segments. After that frequency of data points in every section is calculated. The maximum probability of data points to comprise the centroid of cluster is inside segment which suggest the maximum frequency. If dataset points of different segments have same the upper bound of segment crosses the threshold k and highest frequency. it is essential to merge different segments and then take to highest k section for calculating the initial cluster of clusters. A threshold distance is defined for each cluster centroid to compare the distance between data points and clusters. This paper shows that modified k-means algorithm will decrease the complexity, maintaining and effort of numerical calculation the acceptance of applying the k-means algorithm. Na et al. [17] in this paper the analysis of shortcomings of the standard k-means algorithm has been calculate the distance between every data object and all cluster centers in each iteration. This repetitive process untill that improve efficiency the effectiveness of clustering algorithm. A simple of data structure is required to store some dataset in every iteration which is to be used in the next iteration. Calculation of distance of each data point in each
iteration is avoid by the proposed method and saves the calculation running time. The work of paper shows that proposed technique can effectively improve the accuracy and speed of clustering iteration, reducing the k-means of computational complexity. Singh and kahlon [29] against the bad smell design a threshold metrics value using risk analysis at five different levels. The study of Mozilla Firefox had taken three versions as a dataset they to validate. Their results show that some metrics have threshold values at various acceptable risk levels that are of applied use in predicting faulty classes. Finally they calculted one threshold value from the various risk levels by determining the largest area under ROC curve for faulty classes at corresponding risk levels. Jain and Dubes [10] defined the main steps of k means algorithm as : 1. Select an initial partition with number of cluster (k); repeat steps until cluster erorr rate stabilizes or no change finall centroid. 2. Generate a new partition by assigning each pattern to its closest cluster center.3. Compute new cluster centers. The k-means algorithm depends upon three user-specified parameters: number of cluster k, cluster initialization, and distance metric. Choosing value of k is most censorious. There are different extensions of k-means algorithm.
III. DATACOLLECTION
In this paper, data collection is done for bad code smells and associated those smells with every class of the system from the PMD tool database for four versions of ArgoUML i.e. 0.24, 0.28, 0.30 and 0.34. The PMD tool is a static Java source code analyzer [9]. The motive is to associate these smells with classes found in source code. Bad smell in code will help to refactor the code better [30]. In this paper, focus is on cohesion and coupling metrics, the reports will be generated only for those smells that affects the class. This categorizes each class according to the type of smell. Classified six types of smell that are defined as follows:
1. Long Method: A method contains too many lines of code.
2. Data Clumps: Sometimes different parts of the code contain identical groups of variable. These clumps should be turned into their classes.
3. Long Parameter List: More than three or four parameters for a method.
4. Duplicate Code: Two code fragments look almost identical.
5. Long Class: A class contains many fields/methods/lines of code.
6. Dead Code: A variable, parameter, field, method or class is no longer used (usually because it is obsolete).
A. Statistics of Data
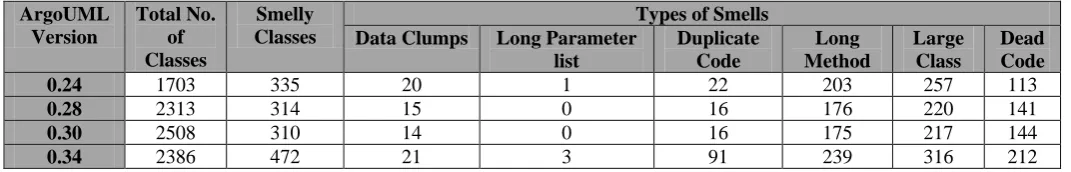
[image:3.595.34.570.693.779.2]Table 1 shows the number of bad smelly classes in each version of ArgoUML and the classes with a type of smell. From the given table 1, it shows that version 0.34 is having the maximum number of smelly classes or affected classes.
Table 1: Bad smell-affected class count Distribution in four versions
ArgoUML Version
Total No. of Classes
Smelly Classes
Types of Smells Data Clumps Long Parameter
list
Duplicate Code
Long Method
Large Class
Dead Code
0.24 1703 335 20 1 22 203 257 113
0.28 2313 314 15 0 16 176 220 141
0.30 2508 310 14 0 16 175 217 144
In this paper, extraction of ArgoUML source code is done with respect to cohesion and coupling Metrics by the Source Meter tool1
Table 2: Descriptive statistics for ArgoUML version 0.24 . SourceMeter is a source code analyzer tool. That selected metrics, one metrics cohesion (LCOM5) and five metrics coupling (CBO, CBOI, NII, NOI, RFC).
Metrics MIN MAX Mean Standard
Deviation Cohesion
Metrics
LCOM 5
0 81 1.560 3.830
Coupling Metrics
CBO 0 102 5.682 6.381
CBOI 0 868 4.378 26.959
NII 0 2280 6.538 61.377
NOI 0 199 9.590 14.016
RFC 0 364 16.489 24.629
Table 2 shows the mean, min, max, and Std. Dev. of the independent variables by using descriptive analysis. Table 2 show that the standard deviation of LCOM5 is low because the value lies between 0 and 81.
Table 3: Descriptive statistics for ArgoUML version 0.28
Metrics MIN MAX Mean Standard
Deviation Cohesion
Metrics
LCOM 5
0 166 5.438 7.412
Coupling Metrics
CBO 0 962 4.040 25.344
CBOI 0 145 1.588 4.700
NII 0 2653 5.897 60.576
NOI 0 227 8.492 14.245
RFC 0 385 15.301 25.336
[image:4.595.37.295.148.260.2]Table 3 shows the mean, min, max, and Std. Dev. of the independent variables by using descriptive analysis. Table 3 show that the standard deviation of LCOM5 is low because the value lies between 0 and 145.
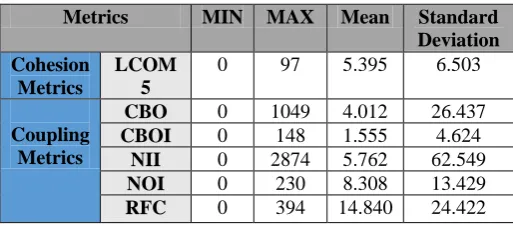
Table 4: Descriptive statistics for ArgoUML version 0.30
Metrics MIN MAX Mean Standard
Deviation Cohesion
Metrics
LCOM 5
0 97 5.395 6.503
Coupling Metrics
CBO 0 1049 4.012 26.437
CBOI 0 148 1.555 4.624
NII 0 2874 5.762 62.549
NOI 0 230 8.308 13.429
RFC 0 394 14.840 24.422
Table 4 shows the mean, min, max, and Std. Dev. of the independent variables by using descriptive analysis. Table 4 show that the standard deviation of LCOM5 is low because the value lies between 0 and 148.
Table 5 shows the mean, min, max, and Std. Dev. of the independent variables by using descriptive analysis. Table 5 show that the standard deviation of LCOM5 is low because the value lies between 0 and 166.
1
https://www.sourcemeter.com/
Table 5: Descriptive statistics for ArgoUML version 0.34
Metrics MIN MAX Mean Standard
Deviation Cohesion
Metrics
LCOM 5
0 100 5.271 6.719
Coupling Metrics
CBO 0 1011 3.761 25.240
CBOI 0 166 1.682 5.204
NII 0 2777 5.512 61.329
NOI 0 291 8.080 14.136
RFC 0 431 14.978 26.183
Using mean, which describes the sample with a single value, which is a representative of central value of the data. From above observations, in each version Maximum mean value is for RFC, and minimum mean value is for LCOM5. Using the standard deviation, which determines how spread-out the data values are from the mean. A higher standard deviation value indicates greater spread in the data. From table (2 to 5) explanations, it can be seen that in each versions, NII has maximum standard deviation value and LCOM5 has minimum standard deviation value.
IV.RESEARCHMETHODOLOGY
In this paper, the main aim is to discover the relationship between the values of the metrics and the probability of bad code smells found in the classes and smells found in each smelly category class. For predicting smell of classes in each category, four version (0.24, 0.28 0.30 and 0.34) of ArgoUML were taken for analysis. With the motive to find, the threshold values of cohesion and coupling metrics based on the bad code smell. Firstly, a collection of bad code smell for creation of databases for these four versions of ArgoUML were done with PMD tool. Secondly, the collection of cohesion and coupling metrics in the databases for these four versions of ArgoUML were done with the SourceMeter tool. Six metrics (CBO, CBOI, LCOM5, NII, NOI and RFC) and six bad smells (Data Clumps, Long Parameter list, Duplicate Code, Long Method, Large Class and Dead Code) databases were associated with these four versions of ArgoUML after extraction.
A. Threshold derivation model
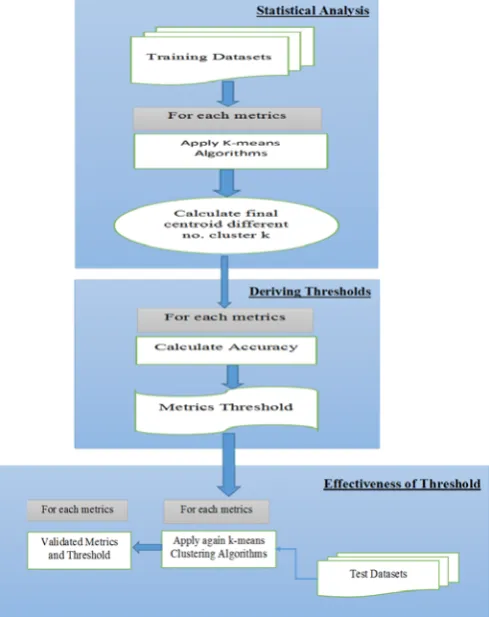
The threshold derivation process comprises of three steps: (1) Statistical Analysis, (2) Deriving Threshold, and (3) Effectiveness of Thresholds. Fig: 1. describes the complete procedure for this methodology. In the first step, learner models are created for each metric according to the training data, future by applying k-means clustering algorithm to those models, centroid values are generated. After that calculation of final centroid with respect to corresponding no. of cluster (k) and analyzing descriptive statistics value for each cluster is done. Second step requires calculation of the performance of each metrics, which are taken as recall, precision, F-measure and accuracy. Then thresholds will be associate according to the accuracy. In the Third step, the effectiveness of the threshold is checked, and these thresholds are then applied to test threshold by applying them to higher versions.
B. k-means clustering: analysis method
The basic step of k-means clustering2
2
https://home.deib.polimi.it/matteucc/Clustering/tutorial_html/k means.html
[image:4.595.36.293.535.648.2]assumption for the centroid or center of these clusters is taken. Initially, any random objects serve as the initial centroids or the
[image:5.595.329.535.54.250.2]
Figure 1. Flowchart diagram of the threshold derivation
first K objects. Then the K-means algorithm will execute and generate new values to final centroids; the procedure is defined as in Fig: 2 [11]. Technically, the algorithm iterates until stable values aregenerated. The process is briefly described as follows:
• Determine the centroid coordinate.
• Define the distance of each object to the centroids.
• Group the object based on minimum distance (find the closest centroid)
Euclidean Distance3 is the most common method of figuring out the distance between two objects. In most cases when researchers discuss about the distance, they refer to Euclidean distance. Euclidean distance or simply ‘distance’ is calculated by the root of square differences between coordinates of a pair of objects.
(1)
Where,
is the Euclidean distance between and .
‘ ’ is the number of cluster centers.
‘ ’ is the number of data points in cluster.
Xi = {X1, X2, \X3 ……… X n} be the set of data points and Yi =
{Y1, Y2, Y 3…… Yn
3
https://en.wikipedia.org/wiki/Euclidean_distance } be the set of centers.
Figure 2. K-means clustering process
C. Tool Used
SPSS4
SourceMeter is a source code analyzer tool, which can perform deep static program examination of the source code. In this dissertation, this tools is used to extract the cohesion and coupling metrics.
(Software package used for statistical analysis) is a Windows-based program that can be used to perform data entry and analysis and to create tables and graphs. SPSS is capable of handling sizably large amounts of data and can perform all of the analyses covered in the text [13]. In this dissertation, this tool is used to find out of correlation, cohesion and coupling metrics and bad smells.
PMD tool5
Weka
is a static Java source code analyzer. It uses rule-sets to explain once a part of the source is erroneous or not. The basic use for this tools is to extract code bad smell.
6
• Simple CLI provides command line interface and allows the direct execution of WEKA commands.
is a collection of machine learning algorithms for different data mining tasks [3]. The algorithms can either be applied directly to a dataset. In the proposed technique, weka tool will be used. The algorithms are K-means Clustering that are to trained tested and analyzed in this research work. Weka interface has four components as following [6].
• Explorer is an environment for exploring the dataset. • The experimenter is an environment for conducting
experiments and to perform statistical analysis between different learning schemes.
• Knowledge Flow is the Java Beans based interface for setting up and running machine learning experiments.
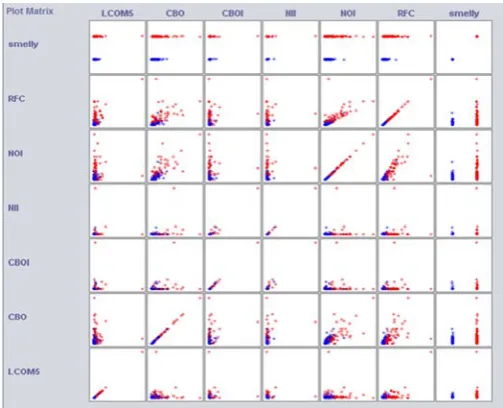
Fig no. 3 is the example which illustrates the use of k-means clustering with WEKA The sample data set used for this example is based on the "ArgoUML_0.24" available in comma-separated format AroUML_0.24.csv.
4
https://www.ibm.com/analytics/us/en/technology/spss/
5
https://pmd.github.io/
6
[image:5.595.37.282.87.396.2]Figure 3. Visualization ArgoUML version 0.24
Another way of understanding the characteristics of each cluster is through visualization. Show the figure 3 visualization of each metrics. Visualizing the dataset ArgoUML version 0.24. It displays a matrix of two-dimensional scatter plots of every pair of attributes. Each subplot (except those paired with “smelly”) shows the normalized value distribution of a pair of attributes, colored by smelly (true blue, false red).
V. METRICVALIDATION
In this paper, correlation between metrics is established. Table 6 to 9 show the correlation between all the metrics for the four versions. A coefficient of correlation is a mathematical measure of how much one number is expected to be under the influence of another. Values of the correlation are always between -1 and +1. In this dissertation, considering the correlations that are larger than 0.5 are considered as high correlation and in between 0.3 and 0.5 as medium correlation, while below 0.3 are considered as low correlation. A strong or high correlation means that two or more variables have a strong relationship with each other. While weak or low correlation means that the variables are hardly related. Value 0 indicates zero correlation, which means that the variables are independent and are tracking different information [12]. In this paper, Pearson correlation coefficients [4] is calculated between all pairs of cohesion and coupling metrics.
Table 6. Coefficient Correlation for ArgoUML version 0.24
Metrics
Cohesion Metrics
Coupling Metrics
Smelly LCOM
5
CBO CBOI NII NOI RFC
LCOM 5
1 0.13 0.05 0.04 0.22 0.65 0.31
CBO 0.13 1 0.20 0.22 0.72 0.57 0.36
CBOI 0.05 0.20 1 0.93 0.11 0.16 0.11
NII 0.04 0.22 0.93 1 0.11 0.16 0.10
NOI 0.22 0.72 0.11 0.11 1 0.82 0.43
RFC 0.65 0.57 0.16 0.16 0.82 1 0.50
Smelly 0.31 0.36 0.11 0.10 0.43 0.50 1
[image:6.595.300.565.141.280.2]In this table 6, description of the high correlation between CBOI and NII can be seen with the value 0.93 that signifies a strong relationship with each other. The low correlation between LCOM5 and NII with a value of 0.04 shows that they are hardly related to each other.
Table 7. Coefficient Correlation for ArgoUML version 0.28
Metrics
Cohesion Metrics
Coupling Metrics
Smell y LCOM
5
CBO CBOI NII NOI RFC
LCOM 5
1 0.11 0.03 0.03 0.16 0.61 0.08
CBO 0.11 1 0.12 0.14 0.73 0.59 0.30
CBOI 0.03 0.12 1 0.93 0.07 0.12 0.08
NII 0.03 0.14 0.93 1 0.09 0.13 0.04
NOI 0.16 0.73 0.07 0.09 1 0.81 0.31
RFC 0.61 0.59 0.12 0.13 0.81 1 0.29
Smelly 0.08 0.30 0.08 0.04 0.31 0.29 1
[image:6.595.302.565.380.519.2]In table 7, it can been seen that there is a high correlation between CBOI and NII with a value 0.93 that represents a strong relationship with each other. Lower correlation between LCOM5 and NII of value 0.03 shows that they are hardly related with each other.
Table 8. Coefficient Correlation for ArgoUML version 0.30
Metrics
Cohesion Metrics
Coupling Metrics
Smell y LCOM
5
CBO CBOI NII NOI RFC
LCOM 5
1 0.13 0.03 0.03 0.17 0.62 0.08
CBO 0.13 1 0.14 0.15 0.72 0.60 0.39
CBOI 0.03 0.14 1 0.93 0.08 0.12 0.08
NII 0.03 0.15 0.93 1 0.08 0.12 0.04
NOI 0.17 0.72 0.08 0.08 1 0.81 0.31
RFC 0.62 0.60 0.12 0.12 0.81 1 0.29
Smelly 0.08 0.33 0.08 0.04 0.31 0.29 1
[image:6.595.30.567.615.757.2]In table 8, it can been seen that there is a high correlation between CBOI and NII with a value 0.93 that represents a strong relationship with each other. Lower correlation between LCOM5 and NII of value 0.03 shows that they are hardly related with each other.
Table 9. Coefficient Correlation for ArgoUML version 0.34
Metrics
Cohesion Metrics
Coupling Metrics
Smelly LCOM
5
CBO CBOI NII NOI RFC
LCOM 5
1 0.13 0.03 0.02 0.17 0.63 0.25
CBO 0.13 1 0.14 0.16 0.68 0.59 0.37
CBOI 0.03 0.14 1 0.94 0.08 0.12 0.11
NII 0.02 0.16 0.94 1 0.08 0.12 0.09
NOI 0.17 0.68 0.08 0.08 1 0.80 0.38
RFC 0.63 0.59 0.12 0.12 0.80 1 0.44
In table 9, it can been seen that there is a high correlation between CBOI and NII with a value 0.94 that represents a strong relationship with each other. Lower correlation between LCOM5 and NII of value 0.02 shows that they are hardly related with each other.
A. Cluster Centroids
[image:7.595.32.566.236.500.2]Clusters are generated using k means clustering algorithm and certain parameters (like no. of cluster) are used for the calculation of all the four ArgoUML versions. This result is shown in table no. 6 to 9 along with the centroid of each cluster. Cluster centroids are the mean vectors for each cluster, means each dimension value in the represents the mean value for that dimension in the cluster [23].
Table 10: Final centroid ArgoUML versions 0.24
Metrics
# Cluster
K
Final centroids
Cohesion Metrics
LCOM 5
2 0 1.97
3 0 1.73 55.67 4 0 1.29 6.36 55.67
Coupling Metrics
CBO
2 17.72 4.05 3 42.82 10.63 3.08 4 15.11 6.75 2.27 48.36
CBOI
2 683 3.58 3 683 97.4 2.46 4 119.07 32.7 1.91 683
NII
2 5.2 2280 3 3.4 282.63 2280 4 96.28 348.85 2280 2.4
NOI
2 69.62 7.78 3 82.85 20.99 4.69 4 122.54 16.01 3.88 45.43
RFC
[image:7.595.37.563.530.783.2]2 116.93 12.88 3 16.49 58.34 10.9 4 72.12 25.66 7.693 196.59
Table 11: Final centroid ArgoUML versions 0.28
Metrics
# Cluster
K
Final centroids
Cohesion Metrics
LCOM 2 84.2 1.41 5 3 84.2 1.75 0
4 93.25 1.49 0 14.34
Coupling Metrics
CBO
2 21.81 4.05
3 69.46 12.23 3.12
4 71.5 15.63 1.69 6.02
CBOI
2 763 3.38
3 763 94.48 2.55
4 763 115.46 1.85 30.14
NII
2 2653 4.75
3 2653 294.64 3.37
4 2653 432.6 104.45 2.54
NOI
2 79.13 6.84
3 96.53 21.62 4.00
4 99.94 27.82 1.94 9.98
RFC
2 155 12.53 3 176.82 43.12 8.69
4 218.82 88..82 7.20 28.74
The clustering values in table no. 10 to 13 show the final centroid selected for each cluster and depict statistics on the basis of number assigned for different clusters. If no. of cluster Increase, the algorithm will adjust number of centroids accordingly. Initial starting point is randomly chosen for the cluster center of the dataset. Then the algorithm executes, calculating the distance between each data point and cluster. Finally after execution, assignment of the data point to the cluster center whose distance from the cluster center is minimum out of all the cluster centers. Recalculating the distance between each data point and new obtained cluster centers is called a centroid. Change in the no. of cluster will present change in centroid values. For final instance, selection of one centroid value according to metrics definition is done.
Table 12: Final centroid ArgoUML versions 0.30
Metrics
# Cluster
K
Final centroids
Cohesion Metrics
LCOM 5
2 86 1.39
3 86 1.74 0
4 14.05 1.49 0 95.25
Coupling Metrics
CBO
2 17.98 3.81 3 11 2.9 54.3 4 6.07 1.72 57.94 15.4
CBOI
2 3.36 819 3 108.45 819 2.52 4 127 819 1.79 29.9
NII
2 2874 4.62 3 2874 292.83 3.23 4 2874 403.33 2.42 102.97
NOI
2 70.66 6.7 3 21.45 4.02 94.09 4 9.96 1.88 27.88 97.59
RFC
2 125.89 11.7 3 182.03 8.86 44.65 4 222.7 26.84 82.97 6.95
Table 13: Final centroid ArgoUML versions 0.34
Metrics
# Cluster
K
Final centroids
Cohesion Metrics
LCOM 5
2 95.2 1.49 3 1.78 0 95.2 4 1.68 0 123.33 33.67
Coupling Metrics
CBO
2 4.43 32.96 3 2.86 10.88 57.05 4 1.05 4.84 13.13 58.21
CBOI
2 3.13 752.5 3 2.39 107.24 752.5 4 1.59 25.7 113.27 752.5
NII
2 4.35 2777 3 3.03 266.17 2777 4 2.24 107 2777 421.25
NOI
2 6.3 69.69 3 4.09 104.69 23.72 4 2.3 34.204 11.69 109.48
RFC
B. Performance evaluation parameters:
The following sub-section gives the basic definitions of the performance parameters used for smell Prediction [19].
Table 14: Confusion Matrix
Predicted: Non-Smelly
Predicted: Smelly
Actual: Non-Smelly
True Negative (TN) False Positive (FP)
Actual: Smelly False Negative (FN) True Positive (TP)
• True negative (TN) is the number of correct predictions that an instance is negative.
• False Positive (FP) is the number of incorrect predictions that an instance is positive.
• False Negative (FN) is the number of incorrect predictions that an instance is negative.
• True Positive (TP) is the number of correct predictions that an instance is positive.
Precision: It is used to measure the degree to which the repeated measurements under unchanged conditions show the same results. It is also called as positive predictive value. Precision is related to random errors.
Precision = TP/(FP+TP) (2)
Accuracy: Accuracy measure is the proportion of predicted fault-prone modules that are inspected out of all modules. Model is said to perfect if it has accuracy value 1. Accuracy includes both trueness and precision. It is defined as:
Accuracy = (TN+TP)/(TN+TP+FN+FP) (3)
F-measure: The F-measure is a measure of test’s accuracy and is defined as the weighted harmonic mean of the precision and recall of the test.
F-measure = (2 * precision * recall) / (precision + recall) (4)
Recall: Recall defined as the proportion of positive cases that were correctly identified, as calculated using the equation.
Recall = TP/(TP+FN) (5)
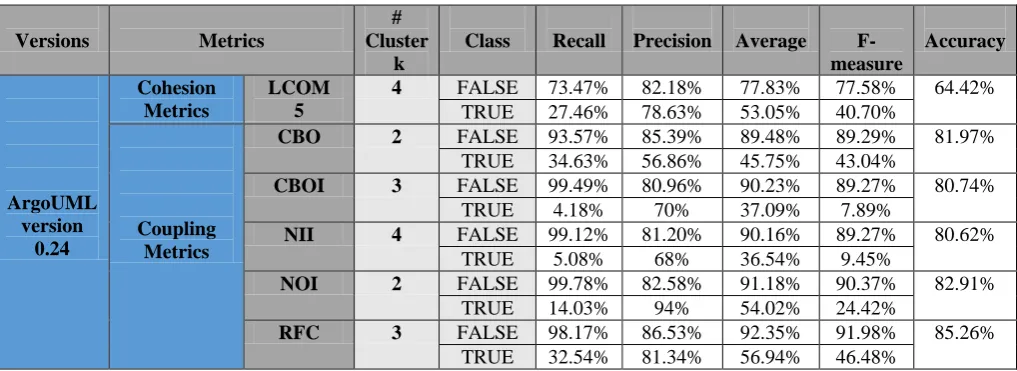
[image:8.595.33.542.598.783.2]All the results are experimented by cluster evaluation of the dataset in weka. Table 15 shows k-means clustering models for predicted no. of cluster (k) levels with an accuracy. Table 15 shows k-means clustering models for predicted no. of cluster (k) levels with an accuracy. In this paper, calculated the accuracy for no. of cluster (k = 2, 3, 4) for every version of ArgoUML for the every metrics. Which no of cluster (k) for every version of ArgoUML for the every metrics of the accuracy be more, select it. The cluster with which the high accuracy is taken, one centroid value of its final centroid value (See table no. 10 to 13) will select according to the definition of the metrics. selected one centroid is taken as a threshold. The f-measure is a harmonic mean of the precision and recall of the test. According to many researchers the higher value or values closer to 100% are considered as the best case and the values closer to 0% is considered as worst case. So a higher value of F-measure for each metric is more preferable. The maximum F-measure value is 93.56% which is generated by no. of cluster 2 for NOI for version 0.30 of ArgoUML. These values are evaluated according to their precision and recall. The values of both the recall and precision are between 0 and 100%. Values that are close to 100% means better results. If the value is 100%, then the classifier is ideal and without FN or FP. The recall is also known as specificity, and it provides us the probability of accurate classification of a module that contains a smelly class. Then the accuracy value of different no. of cluster (k) of each metric is compared and above results are concluded. The results show that their derived threshold evaluates the accuracy of most of the systems and then apply it on higher versions. The maximum recall value is 99.78% which is generated by no. of cluster 2 for NOI for version 0.24 of ArgoUML. With this result, it can be inferred that the no. of cluster 2 for NOI is able to classify smelly modules in this version accurately. The precision is defined as the ratio of number of modules correctly classified as smelly to the total number of modules. The maximum precision value is 89.96%, which is generated by no. of cluster 2 for CBO for version 0.28 of ArgoUML.
Table 15: Performance and entire data set result
Versions Metrics
# Cluster
k
Class Recall Precision Average F-measure
Accuracy
ArgoUML version
0.24
Cohesion Metrics
LCOM 5
4 FALSE 73.47% 82.18% 77.83% 77.58% 64.42%
TRUE 27.46% 78.63% 53.05% 40.70%
Coupling Metrics
CBO 2 FALSE 93.57% 85.39% 89.48% 89.29% 81.97%
TRUE 34.63% 56.86% 45.75% 43.04%
CBOI 3 FALSE 99.49% 80.96% 90.23% 89.27% 80.74%
TRUE 4.18% 70% 37.09% 7.89%
NII 4 FALSE 99.12% 81.20% 90.16% 89.27% 80.62%
TRUE 5.08% 68% 36.54% 9.45%
NOI 2 FALSE 99.78% 82.58% 91.18% 90.37% 82.91%
TRUE 14.03% 94% 54.02% 24.42%
RFC 3 FALSE 98.17% 86.53% 92.35% 91.98% 85.26%
ArgoUML version
0.28
Cohesion Metrics
LCOM 5
2 FALSE 99.75% 86.39% 93.07% 92.59% 86.21%
TRUE 0% 0% 0.00% 0.00%
Coupling Metrics
CBO 2 FALSE 95.95% 89.96% 92.96% 92.86% 87.25%
TRUE 31.85% 55.25% 43.55% 40.41%
CBOI 3 FALSE 99.60% 86.94% 93.27% 92.84% 86.73%
TRUE 4.78% 71.43% 38.11% 8.96%
NII 4 FALSE 99.20% 87.05% 93.13% 92.73% 86.51%
TRUE 5.73% 62.07% 33.90% 10.49%
NOI 2 FALSE 98.90% 87.49% 93.20% 92.85% 86.81%
TRUE 9.88% 58.49% 34.19% 16.90%
RFC 2 FALSE 98.70% 86.99% 92.85% 92.48% 86.12%
TRUE 6.05% 42.22% 24.14% 10.58%
ArgoUML version
0.30
Cohesion Metrics
LCOM 5
2 FALSE 99.77% 87.62% 93.70% 93.30% 87.44%
TRUE 0% 0% 0.00% 0.00%
Coupling Metrics
CBO 2 FALSE 92.81% 39.36% 66.09% 55.28% 86.56%
TRUE 91.56% 43.57% 67.57% 59.04%
CBOI 3 FALSE 99.60% 88.05% 93.83% 93.47% 87.80%
TRUE 4.19% 65% 34.60% 7.87%
NII 4 FALSE 99.18% 88.26% 93.72% 93.40% 87.68%
TRUE 6.13% 61.29% 33.71% 11.15%
NOI 2 FALSE 98.82% 88.83% 93.83% 93.56% 88.08%
TRUE 11.94% 58.73% 35.34% 19.85%
RFC 2 FALSE 98.36% 87.52% 92.94% 92.62% 87.52%
TRUE 10.65% 47.82% 29.24% 17.42%
ArgoUML version
0.34
Cohesion Metrics
LCOM 5
2 FALSE 100% 80.39% 90.20% 89.13% 80.43%
TRUE 1.06% 100% 50.53% 2.10%
Coupling Metrics
CBO 2 FALSE 99.37% 82.12% 90.75% 89.93% 82.21%
TRUE 12.29% 82.86% 47.58% 21.41%
CBOI 3 FALSE 99.74% 80.65% 90.20% 89.18% 80.55%
TRUE 2.75% 76.47% 39.61% 5.31%
NII 4 FALSE 99.43% 81.01% 90.22% 89.28% 80.76%
TRUE 5.09% 75% 40.05% 9.53%
NOI 2 FALSE 99.48% 82.10% 90.79% 89.96% 82.19%
TRUE 12.08% 85.08% 48.58% 21.16%
RFC 3 FALSE 96.82% 87.24% 92.03% 91.78% 78.79%
TRUE 37.08% 74.15% 55.62% 49.44%
81
.9
7 87.25 86.56
82
.2
1
80
.7
4 86.7
3
87
.8
80
.5
5
64
.4
2
86
.2
1
87
.4
4
80
.4
3
80
.6
2 86.5
1
87
.6
8
80
.7
6
82
.9
1
86
.8
1
88
.0
8
82
.1
9
85
.2
6
86
.1
2
87
.5
2
78
.7
9
0 10 20 30 40 50 60 70 80 90 100
A R G O U M L _ 0 . 2 4 A R G O U M L _ 0 . 2 8 A R G O U M L _ 0 . 3 0 A R G O U M L _ 0 . 3 4
ACCU
RA
CY
[image:9.595.34.548.28.760.2]CBO CBOI LCOM5 NII NOI RFC
In this paper figure 4 shows all versions of ArgoUML’s accuracy and its comparison of accuracy each other versions. Accuracy is the proportion of the total number of predictions that were correct. ArgoUML, version 0.24 highest accuracy 85.26 means best correctly classify within module for RFC metric and lowest accuracy 64.26 means comparison RFC low correctly classify within module for LCOM5 metric. ArgoUML, version 0.28 accuracy of almost all metrics are equal. ArgoUML, version 0.30 accuracy of almost all metrics are equal. ArgoUML, version 0.34 accuracy of almost all metrics are equal.
C. Metrics threshold values analysis:
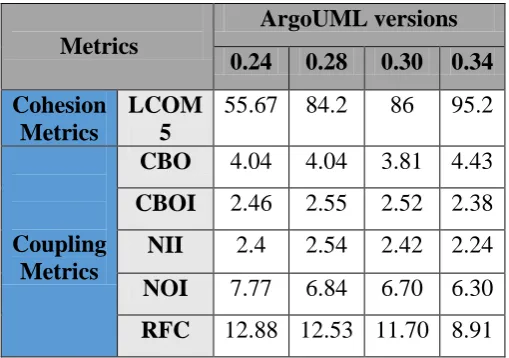
[image:10.595.30.285.435.614.2]Threshold for all the selected metrics (CBO, CBOI, LCOM5, NII, NOI and RFC) are calculated using k-means clustering algorithm. Table 17 shows the values of threshold, are chosen as the best performance threshold values. The values of proposed thresholds for every metrics for each versions (0.24, 0.28, 0.30 and 0.34) of ArgoUML’s are given. From the table no. 17 it is observed that CBOI, NII and NOI have approximately the same metrics threshold of each version. Threshold values derived from this analysis will help the testing and development teams to identify the classes for refactoring [29]. Metrics threshold values could bring the information such as when a class has greater metrics value than the threshold, it is a sign of poor design, and it needs an inspection to improve the design. Various techniques [5] can be applied to improve the code design for metrics reaching the threshold values.
Table 17: Proposed threshold
Metrics
ArgoUML versions
0.24
0.28
0.30
0.34
Cohesion
Metrics
LCOM
5
55.67
84.2
86
95.2
Coupling
Metrics
CBO
4.04
4.04
3.81
4.43
CBOI
2.46
2.55
2.52
2.38
NII
2.4
2.54
2.42
2.24
NOI
7.77
6.84
6.70
6.30
RFC
12.88 12.53 11.70 8.91
VI.CONCLUSIONANDFUTUREWORK
Cohesion and Coupling are an important factor in term of software design. Threshold values provide a meaningful interpretation for metrics and provide a surrogate to identify classes at risk. The classes that exceed a threshold value can be selected for more testing to improve their internal quality, which increases the testing efficiency. This methodology can be used to identify threshold values based upon the k-means clustering model. Validated the proposed methodology on a version (0.24, 0.28, 0.30, 0.34) of ArgoUML. In this paper, it’s found that there are effective threshold values for the cohesion and coupling metrics. Validation is done of the thresholds on identifying bad code smell classes on the higher version of ArgoUML. The
k-means clustering is most simple and well-known algorithm, which can be easily implemented. For k-means clustering Weka tool, is generating the confusion metrics. Then calculate the TP rate, precision, recall, F-measure and accuracy, this result are better. Proposed thresholds can be tested and analyzed in a wider range of datasets, including software systems implemented by different languages (C ++, C#, etc.). Furthermore, the effect of these thresholds can be assessed on large-scale industrial projects other than open-source software systems.
REFERENCES
[1] Amutha, R., & Renuka, K. (2015). Different Data Mining Techniques And Clustering Algorithms. International journal of technology enhancements and emerging engineering research, 3(11), 15–17.
[2] Bender, R. (1999). Quantitative Risk Assessment in Epidemiological Studies Investigating Threshold Effects. Biometrical Journal, 41(3), 305–319.
[3] Bouckaert, R. R., Frank, E., Hall, M., Kirkby, R., Reutemann, P., Seewald, A., & Scuse, D. (2012). WEKA Manual for Version 3-6-8.
[4] Cohen, J., Patricia, C., West, S., & Aiken, L. (2003). Applied Multiple Regression/Correlation Analysis for the Behavioral Sciences (Third Edit). New Jersey: Lawrence Erlbaum Associates, Inc.
[5] Fowler, M., & Kent, B. (2000). Refactoring: improving the design of existing code. Boston: Addison-Wesley. [6] Frank, E., Hall, M., Holmes, G., Kirkby, R., Pfahringer,
B., & Ian, H. (2010). Weka-A Machine Learning Workbench for Data Mining. Springer, 2, 1269–1277. [7] Ghosh, S., & Dubey, S. K. (2013). Comparative
Analysis of K - Means and Fuzzy C - Means Algorithms. International Journal of Advanced Computer Science and Applications, 4(4).
[8] Gonzalez, R. R. (1995). A Unified Metric of Software Complexity : Measuring Productivity , Quality , and Value. Journal of Systems and Software, 1212(94), 17– 37.
[9] Hsu, A., Novakouski, M., Jagannathan, S., & Mustehsan, S. (2007). Analysis Tool Evaluation : PMD. [10] Jain, A. k., & Dubes, R. C. (1996). Algorithms for
Clustering Data. New Jersey: Prentice-Hall.
[11] Jain, S., Aalam, M. A., & Doja, M. N. (2010). K-means clustering using weka interface. In Copmuting For Nation Development. New Delhi.
[12] Kayarvizhy, N., Kanmani, S., & Uthariaraj, R. V. (2013). High Precision Cohesion Metric. Information Science and Application, 10(3), 79–89.
[13] Landau, S., & Everitt, B. (2004). A Handbook of Statistical Analyses using SPSS. Boca Raton London New York Washington, D.C.: CHAPMAN & HALL/CRC.
[15] Mittal, M., Sharma, R. K., & Singh, V. P. (2014). Validation of k -means and threshold based clustering method. International Journal of Advancements in Technology, 5(2), 153–160.
[16] Mohemmed, A. W., Browne, W. N., & Zhang, M. (2010). Particle Swarm Optimisation for Outlier Detection. ACM, 07, 83–84.
[17] Na, S., & Xumin, L. (2010). Research on k-means Clustering Algorithm. In International Symposium on Intelligent Information Technology and Security Informatics (pp. 63–67). IEEE.
[18] Nazeer, K. A. A., & Sebastian, M. P. (2009). Improving the Accuracy and Efficiency of the k-means Clustering Algorithm. In World Congress on Engineering (Vol. I, pp. 1–5). London, U.K.
[19] Powers, D. M. W. (2007). Evaluation : From Precision , Recall and F-Factor to ROC , Informedness , Markedness & Correlation. Adelaide • Australia.
[20] Pressman, & S., R. (2010). Software Engineering: a practitioner’s approach. New York: McGraw-Hill Higher Education.
[21] Rathod, R. R., & Momin, B. F. (2013). Performance evaluation of Outlier Detection with normalized data set. Department of Computer Science and Engineering, 134–144.
[22] Sakthi, M., & Thanamani, A. S. (2013). An Enhanced K Means Clustering using Improved Hopfield Artificial Neural Network and Genetic Algorithm. International Journal of Recent Technology and Engineering (IJRTE), 2(3), 1–7.
[23] Shafeez, A., & Hareesha, K. S. (2012). Dynamic Clustering of Data with Modified K-Means Algorithm. In International Conference on Information and Computer Networks (Vol. 27, pp. 221–225). IACSIT Press, Singapore.
[24] Sharma, R., Rani, A., & Alam, M. A. (2012). K-Means Clustering in Spatial Data Mining using Weka Interface. In International Conference on Advances in Communication and Computing Technologies (ICACACT) (pp. 26–30). International Journal of Computer Applications.
[25] Shatnawi, R. (2010). A quantitative investigation of the acceptable risk levels of object-oriented metrics in
open-source systems. IEEE Transactions on Software Engineering, 36(2), 216–225.
[26] Singh, N., & Singh, D. (2012). Performance Evaluation of K-Means and Heirarichal Clustering in Terms of Accuracy and Running Time. International Journal of Computer Science and Information Technologies, 3(3), 4119–4121.
[27] Singh, R. V., & Bhatia, M. P. S. (2011). Data Clustering with Modified K-means Algorithm. In International Conference on Recent Trends in Information Technology (pp. 717–721). IEEE.
[28] Singh, S., & Kahlon, K. S. (2012). Effectiveness of refactoring metrics model to identify smelly and error prone classes in open source software. ACM SIGSOFT Software Engineering Notes, 37(2).
[29] Singh, S., & Kahlon, K. S. (2014). Object oriented software metrics threshold values at quantitative acceptable risk level. Springer, 2(3), 191–205.
[30] Singh, S., & Kaur, S. (2017). A systematic literature review : Refactoring for disclosing code smells in object oriented software. Ain Shams Engineering Journal. [31] Stevens, W. P., Myers, G. J., & Constantine, L. L.
(1974). Structured design. IBM SYSTJ, (2), 115–139. [32] Thakare, Y. S., & Bagal, S. B. (2015). Performance
Evaluation of K-means Clustering Algorithm with Various Distance Metrics. International Journal of Computer Application, 110(11), 12–16.
[33] V, M., Lassenius, C., & Mantyla. (2006). Subjective evaluation of software evolvability using code smells : An empirical study. Springer, 11, 395–431.
[34] Wang, J., & Su, X. (2011). An improved K-Means clustering algorithm. In Communication Software and Networks (ICCSN) (pp. 44–46). IEEE.
[35] Zhang, L., Lu, F., & LIU, A. (2016). Application of K-Means Clustering Algorithm for Classification of NBA Guards. International Journal of Science and Engineering Applications, 5(1).