Efficient Early Risk Factor Analysis of Kidney
Disorder Using Data mining Technique
N.Pavithra1, Dr. R. Shanmugavadivu2,
Department of Computer Science, PSG College of Arts & Science, Coimbatore, India1
Assistant Professor, Department of Computer Science, PSG College of Arts & Science, Coimbatore, India2
ABSTRACT: Knowledge mining provides the methodology and technology to alter the medical data mining of knowledge into helpful information for decision creating. By victimization data processing techniques it takes less time for the prediction of the illness with additional accuracy. Among the increasing analysis on kidney illness predicting system, it has happened to vital classify the analysis of the outcomes and offers users with an definition of the existing renal illness prediction techniques in every class. Knowledge mining tools and algorithms will provide results to trade queries that conventionally used multiple times which is dominant factor to decision making. In this proposed research we tend to research completely different methods and additional algorithms of knowledge mining used for the prediction of risk issue on urinary organ illness.
This paper provides a quick and straightforward result of completely different prediction models in knowledge mining and helps to seek out greatest model for any work. This prediction accuracy will be increased by increasing the range of attributes for the existing system of our previous work. The symbolic Fuzzy C Means algorithm will be tested with the unstructured knowledge offered in health care business knowledgebase by modifying into fuzzified structured knowledge with enhanced attributes and with a group of additional range of records to give higher accuracy to the system in predicting and diagnosing the patients of renal disorder. The Proposed system helps in predicting the earlier risk factors of the kidney failure instead of clustering the severity of the disease based on the medical tests conducted by physicians. This thesis work is implemented by MATLAB.
KEYWORDS: DM techniques, Clustering techniques, k-means algorithm, fuzzy c means (FCM) algorithm, Kidney diseases, Fuzzy Score
I.INTRODUCTION
Nowadays Kidney disease is a major problem of the Healthcare institutions. Kidney is used to clean blood, keep the balance of salt and minerals in blood, and control blood pressure. When kidney is damaged waste products and fluid can build up in body, causing swelling in ankles, vomiting, weakness, poor sleep and shortness of breath. If don’t treat them diseased kidney eventually stop working completely. Loss of kidney function is a serious and potentially fatal –condition [20].
Healthy kidneys:
Maintain a balance of water and minerals, such as sodium, potassium, and phosphorus, in blood. Make erythropoietin, which stimulates red blood cell production
Make an active form of vitamin D, needed for bone health
CLASSIFICATION OF KIDNEY DISEASES
Acute Kidney Disease
The sudden loss of kidney function called acute kidney injury (AKI) or acute renal failure (ARF).It has three main causes:
Urine backed up in the kidneys
These can happen when:
Have a traumatic injury with blood loss Dehydrated
Go into shock during a serve infection called sepsis
Have blocked urine flow, which can happen with an enlarged prostate Take specific drugs or are around certain toxins.
Get complications with a pregnancy, such as eclampisa and pre-eclampisa, or related HELLP Syndrome
Chronic Kidney Diseases
Kidneys that don’t work well for longer than 3 month is called chronic kidney disease (CKD). It’s dangerous because may not have any symptoms until a lot of damage, that often can’t be repaired, has happened. Early detection is the first step in treating CKD. The main risk factors for developing kidney diseases are:
Diabetes
High blood pressure
Cardiovascular(heart and blood vessel)disease , Animea , Analgesic(taken long time medicines) A family history of kidney failure.
Acute-on-chronic kidney failure
Acute kidney injuries can be present on top of chronic kidney disease, a condition called acute-on-chronic kidney failure (AoCRF). The acute part of AoCRF may be reversible, and the goal of treatment, as with AKI, is to return the patient to baseline kidney function, typically measured by serum creatinine. Like AKI, AoCRF can be difficult to distinguish from chronic kidney disease if the patient has not been monitored by a physician and no baseline (i.e., past) blood work is available for comparison.
II.LITERATURE REVIEW
Author Susan Snyder, M.D et.al chronic kidney disease affects approximately 19 million adult Americans, and its incidence is increasing rapidly. Diabetes and hypertension are the underlying causes in most cases of chronic kidney disease [1] Evidence suggests that progression to kidney failure can be delayed or prevented by controlling blood sugar levels and blood pressure and by treating proteinuria. Author NavdeepTangri et.al they give the Predictive Model for Progression of Chronic Kidney Disease to Kidney Failure. A model using routinely obtained laboratory tests can accurately predict progression to kidney failure in patients with CKD stages 3 to 5. And the main result is Kidney failure, defined as need for dialysis or pre-emptive kidney transplantation [2].Author Amanda A.Honeycutt et.al. Estimates of the medical costs associated with different stages of CKD are needed to assess the economic benefits of interventions that slow the progression of kidney disease. We combined laboratory data from the National Health and Nutrition Examination Survey with expenditure data from Medicare claims to estimate the Medicare program's annual costs that were attributable to CKD stage 1-4. [3].Author Justin B. Echouffo-Tcheugui1 et.al This systematic review shows that a sizeable number of renal risk prediction models have been developed, with, however, variation in their quality. Reasons for this may be specific to nephrology, where risk prediction is still in its infancy and the methodology for predictive research may be underappreciated [5].AuthorM.W Taalet.al In this paper, review current data regarding CKD risk factors and illustrate how each may impact upon the mechanisms underlying CKD progression to accelerate loss of renal function. We propose that these risk factors should be used as a basis for developing a renal risk score[6]
III. PROPOSED SYSTEM
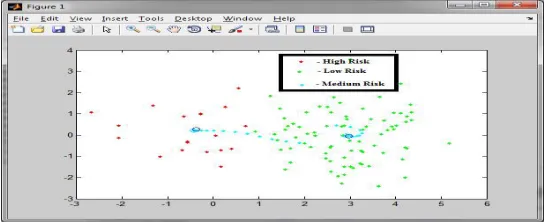
system has been implemented using MATLAB. The designed algorithm for clinical decision support system shown in figure 2 contains “ ” input vector of the form = { 1, 2, …, 13}, and two output levels of the form = { 1, 2}, where the two values are predicted as High, Medium and Low. The inputs are related to the 13 attributes and output is related to the risk level presence or absence. In the proposed system, the biomarkers for kidney diseases described in the literature are age, sex, total cholesterol level, smoking status, and hypertension that are mainly used to predict the risk level of kidney patients. For better prediction of risk level, we make use of fuzzy C means clustering algorithm. Initially the fuzziness is set to a value between 0 and 1. The output data set is mapped to three clusters. In the proposed work patient predicted as kidney failure comes under cluster 1 and patents predicted without kidney failure comes under cluster 0 and cluster 2 contains mispredicted values. Euclidean distances (EUCDIS) between cluster centers in the three-dimensional space are determined to check the relevance of the clusters. We expect that the spacing between the cluster centers in the three-dimensional space should reflect the spacing in the higher dimensional space. EUCDIS (0, 2) = 0.75 EUCDIS (0, 1) = 0.68. In the 3-dimensional space the Euclidean distances of cluster 0 and cluster 2 is greater than the distance between cluster 0 and cluster 1. This shows that there is a similarity between the cluster 0 and cluster 1, but these groups are considered to be misclassified clusters. The Below Listed Table shows the parameters and their corresponding Values for predicting risk level of kidney failure.
Fig1: The Overall output of FCM with Risk Level
Tabie3: Attribute Parameters and values
Parameters Weight age Values
Male and Female Age < 30
Age >30 to <50
Age >50 to < 70
Age >70
0.1
0.3
0.7
0.1
Smoking Never
Past
Current
0.1
0.3
0.6
Alcohol Intake Never
Past
Current
0.1
0.3
Over Weight Yes
No
0.8
0.1
High Salt Diet Yes
No
0.9
0.1
High saturated fat diet Yes
No
0.9
0.1
Exercise Never
Regular
High If age < 30
High If age >50
0.6 0.1 0.1 0.1 Sedentary Lifestyle/ Inactivity Yes No 0.7 0.1
Hereditary Yes
No
0.1
0.3 Bad Cholesterol Very High – (> 200 mg/dcl)
High - (160 to 200 mg/dcl)
Normal - ( < 160 mg/dcl)
0.9
0.8
0.1 Blood Pressure Normal – (130/89 mm/Hg)
Low - (< 119/79 mm/Hg)
High – (>200/160 mm/Hg)
0.1
0.8
0.9 Blood Sugar High – (>120 to <400 mg/dcl)
Normal – (>90 to <120 mg/dcl)
Low – (<90 mg/dcl)
0.5
0.1
0.4 Heart Rate Low – (< 60 bpm)
Normal- (60 to 100 bpm)
High – (>100bpm)
0.9
0.1
0.9
Data Set:
IV.PROPOSED ALGORITHM
The fuzzy c-means algorithm was introduced by Ruspini and later extended by Dunn and Bezdek and has been widely used in cluster analysis, pattern recognition and image processing etc.
Fuzzy C-means clustering (FCM), relies on the basic idea of K-Means, with the difference that in FCM each data point belongs to a cluster to a degree of membership grade, while in K-Means every data point either belongs to a certain cluster or not. So FCM employs fuzzy partitioning such that a given data point can belong to several groups with the degree of belongingness specified by membership grades between 0 and 1. However, FCM still uses a cost function that is to be minimized while trying to partition the data set. The membership matrix U is allowed to have elements with values between 0 and 1. However, the summation of degrees of belongingness of a data point to all clusters is always equal to unity:
∑ = 1 = 1 … . (1)
The objective function for FCM is
( , 1, 2 … ) =∑ =∑ ∑ . (2)
Where Uij is between 0 and 1, Ci is the cluster center of fuzzy group i, Dij=||Ci-Xj || is the Euclidean distance between the ith cluster center and the jth data point and mЄ[1,∞] is a weighting exponent.
The necessary conditions for Equation (2) to reach its minimum are
=∑ ∑ (3) and
= 1
∑ [ ]
2
( −1) (4)
where, Uij=Membership Function, Cij=Centroids ,J=Objective Function,m=fuzziness exponent, n=No. of clusters
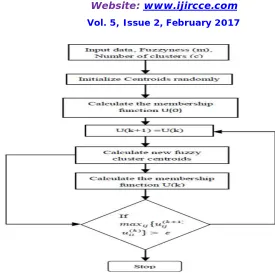
The algorithm works iteratively through the preceding two conditions until the no more improvement is noticed. In a batch mode operation, FCM determines the cluster centers i, c and the membership matrix U using the following steps:
Step 1: Initialize the membership matrix U with random values between 0 and 1 such that the constraint in Equation (1) is satisfied.
Step 2: Calculate c fuzzy cluster centers, Ci ,i=(1……c), using Equation (3).
Step 3: Compute the cost function according to Equation (2). Stop if either it is below a certain tolerance value or its improvement over previous iteration is below a certain threshold.
Step 4: Compute a new U using Equation (4). Go to step 2.
Fig 2: Fuzzy C Means Clustering Process
FUZZIFICATION SCORE
The fuzzy C Means algorithm calculates a fuzzy score for each value entered as score for the corresponding table of query contents. The higher the score, the more similar the strings are. A score of 1.0 or 0.9 means the fuzzification score gives the clustering result with risk level high. A score of 0.0 means the corresponding symptom has less impact of risk level or have nothing in risk condition.
User can enter the score in the form provided to him while contacting the physician and based on the score the individual gives for each query, the FCM classifies them to two categories with minimum and maximum score to find the lowest and highest possibility of risk factor and again the result is started with a given range of value to find the lowest and highest score of the values provided with their limits. Thus the FCM can provide the three classes of results in finding the high risk fuzzy score, medium risk fuzzy score and the low risk score based on the clustering performances
Fig4:Fuzzificaiton Result Fig5: Risk Level
a)Brown - High Support Values a) Red – High Risk b) Orange - Lowest of High to near Medium b) Green – Medium Risk c) Yellow - High Support for Medium c) Blue - Low Risk d) White - Low Support at all cases
V.RESULTS
The performance of FCM is evaluated by statistical measures like sensitivity, specificity and accuracy to illustrate the normal life style score. These metrics also enumerate how the test was good and consistent. Sensitivity evaluates the normal life style score correctly at detecting a positive disease. Specificity measures how the proportion of patients without disease can be correctly ruled out.
Classifier Type No of
Patients
Detected as Abnormal
Detected as Normal
Specify (%)
Sensitivity (%)
Accuracy (%)
K mean Abnormal 120 105 15 86.07 89.86 88
Normal 150 17 133
FCM High 150 5 145 91.53 92.10 92
Medium 150 10 140
Low 150 8 142
Fig5: Comparison Chart
Though, the accuracy is less in this case, its high when compared to K-means which has an accuracy of 86.67% and 83.37% respectively. The case (151-180 records), accuracy is achieved to be 93.33% for proposed FCM algorithm. The case (91-120 records), the sensitivity is achieved to be 93.33 and specificity 86.67 and hence the accuracy is 90%. The sensitivity achieved for the FCM classifier is 91.53 with an average false positive of 0.9 per 30 records. The achieved accuracy is 92%, which is better than the performance of K-means clustering algorithm.
VI.CONCLUSION
In the proposed research, the projected associate FCM clustering algorithmic is applied for locating the chance of kidney disorder of a patient mistreatment the profiles collected from the patients. With the correct adaptation of FCM classifies, the strategy will so evolve associate optimum variety of clusters and finds the abnormal and traditional cases with efficiency and initial pre-processing of information is completed to get rid of all the duplicate records and add missing data. Within the classification stage, a FCM classifier is employed to classify the information as renal disorder risk level. The results of clustering experiment, preformed over an information sets obtained from 270 patients, shows that the FCM clustering algorithm has achieved higher accuracy than most of the present algorithms. The performance of the projected FCM is proved to be a renowned approach in terms of accuracy.
VII.FUTURE ENHANCEMENT
There are alternative techniques that will improve results of the projected classifiers. During this paper, FCM is applied to observe CKD. We will additionally value and compare the performance of the used classifiers with alternative existing classifiers. CKD early detection helps in timely treatment of the patients affected by the illness and additionally to avoid the illness from obtaining worse. Early prediction of the illness and timely treatment are a unit the requirement for medical sector. New classifiers will be used and their performance will be evaluated to seek out higher solutions of the target perform in future work.
REFERENCES
[1] Susan Snyder, M.D. and Bernadette Pendergraph, M.D., "Detection and Evaluation of Chronic Kidney Disease", American Family Physician, Vol.72, Num.9, November 1, 2015, Pg. 1725.
[2] NavdeepTangri, MD, FRCPC; Lesley A. Stevens, MD, MS, FRCPC; John Griffith, PhD; HocineTighiouart, MS; OgnjenkaDjurdjev, MS; David Naimark, MD, FRCPC; Adeera Levin,MD, FRCPC; Andrew S. Levey, MD, and Bernadette Pendergraph, M.D., “A Predictive Model for Progression of Chronic Kidney Disease to Kidney Failure”, JAMA. 2011;305(15):1553-1559. doi:10.1001/jama.2011.451.
[3] Amanda A. Honeycutt, Joel E. Segel, XiaohuiZhuo, Thomas J. Hoerger, Kumiko Imai, “Medical Costs of CKD in the Medicare Population”, JASN September 2013 24: 1478-1483; published ahead of print August 1, 2013, doi:10.1681/ASN.2012040392.
[4] Adeera Levin and Paul E. Stevens, “Early detection of CKD: the benefits, limitations and effects on prognosis”, Nature Reviews Nephrology 7.8 (2011): pp. 446-457.
[6] MW Taal, and BM Brenner “Predicting initiation and progression of chronic kidney disease: Developing renal risk scores” 2016 International Society of Nephrology
[7] N.C. Finch, H.M. Syme, and J. Elliot “Risk Factors for Development of Chronic Kidney Disease in Cats” Journal for Vetnery Intern Medicine 2016;30:602–610
[8] JamshidNorouzi, AliYadollahpour, Seyed Ahmad Mirbagheri, Mitra Mahdavi Mazdeh, and Seyed Ahmad Hosseini “ Predicting Renal Failure Progression in Chronic Kidney Disease Using Integrated Intelligent Fuzzy Expert System“ Hindawi Publishing Corporation Computational and Mathematical Methods in Medicine Volume 2016, Article ID 6080814, 9 page
[9] Michael Lenart, Nikhil Mascarenhas, RuisiXiong, and Abigail Flower“Identifying Risk of Progression for Patients with Chronic Kidney Disease Using Clustering Models “2016 IEEE Systems and Information Engineering Design Conference (SIEDS '16)
[10] Hian Chye Koh, Gerald Tan “Data Mining Applications in Healthcare” Journal of Healthcare Information Management—Vol.19,No. 2 [11] Vikas Kapoor, “Analysis Accuracy And Performance Of Data Mining Techniques In Healthcare” International Journal Of Engineering Sciences & Research Technology February, 2016
[12] M. Durairaj, V. Ranjani,” Data Mining Applications In Healthcare Sector: A Study” International Journal Of Scientific & Technology Research Volume 2, Issue 10, October2013
[13] L.Jerlin Rubini ,Dr.P.Soundarapandian-UCI Machine Learning Repository CKD Data Set- online available [14] UCI Machine Learning Repository Pima Indians Diabetes Data Set- online available
[15] “Data Mining Methods & Techniques” by ABM Shawhat Ali, Saleh A. Wasimi.
[16] “Data Mining Introductroy and Advanced Topics”- Margaret H.Dunham, S.Sridhar published by Dorling Kindersley (India)Pvt.Ltd., [17] “Principles of Data Mining”- Max Bramer published by Springer InternationalEdition.
[18] “Data Mining of Medical Data: Opportunities and Challenges” - Dan A. Simovici.
[19] http :Kidney Disease Basics | National Institute of Diabetes and Digestive and Kidney Diseases (NIDDK) [20] http://www.webmd.com/a-to-z-guides/understanding-kidney-disease
BIOGRAPHY