Proceedings of the NAACL HLT 2010 Student Research Workshop, pages 34–39,
A Learning-based Sampling Approach to Extractive Summarization
Vishal Juneja and Sebastian Germesin and Thomas Kleinbauer German Research Center for Artificial Intelligence
Campus D3.2
66123 Saarb¨ucken, Germany
{firstname.lastname}@dfki.de
Abstract
In this paper we present a novel resampling model for extractive meeting summarization. With resampling based on the output of a base-line classifier, our method outperforms previ-ous research in the field. Further, we com-pare an existing resampling technique with our model. We report on an extensive se-ries of experiments on a large meeting corpus which leads to classification improvement in weighted precision and f-score.
1 Introduction
Feature-based machine learning approaches have become a standard technique in the field of extrac-tive summarization wherein the most important sec-tions within a meeting transcripts need to be iden-tified. We perceive the problem as recognizing the most extract-worthy meeting dialog acts (DAs) in a binary classification framework.
In this paper, firstly, in section 4 we create agold standardto train the classifier, by improvising upon the existing annotations in our meeting corpus. Then in section 5 we present actual numbers which dis-play a very skewed class distribution to learn for the binary classifier. This skewness is attributed to the less number of actual extract-worthy and im-portant DAs (positive examples) compared to ordi-nary chit-chat, backchannel noises etc (negative ex-amples) spoken during the course of the meeting. We tackle this data skewness with a novel resam-pling approach which reselects the data set to create a more comparable class distribution between these postive and negative instances.
Resampling methods have been found effective in catering to the data imbalance problem mentioned above. (Corbett and Copestake, 2008) used a re-sampling module for chemical named entity recog-nition. The pre-classifier, based on n-gram character features, assigned a probability of being a chemical word, to each token. Only tokens having probability greater than a predefined threshold were preserved and the output of the first stage classification along with word suffix were used as features in further classification steps. (Hinrichs et al., 2005) used a hybrid approach for Computational Anaphora Res-olution (CAR) combining rule based filtering with Memory based learning to reduce the huge popu-lation of anaphora/candidate-antecedent pairs. (Xie et al., 2008), in their experimentation on the ICSI meeting corpus, employ the salience scores gener-ated by a TFIDF classifier in the resampling task. We discuss the actual technique and our resampling module further in section 6.
We compare its performance with the TFIDF model of (Xie et al., 2008) in section 8.2 and observe a general improvement in summary scores through resampling.
2 Data
meetings1 and 20 meetings each for development and testing.
Annotators wrote abstractive summaries for each meeting and then linked summary sentences to those DA segments from the meeting transcripts which best conveyed the information in the ab-stracts. There was no limit on the number of links an annotator could create and a many-to-many mapping exists between the meeting DA segments and human abstracts. Here, DA segments are used in analogy to sentences in document summarization because the spontaneously spoken material in meeting tran-scripts rarely contains actual grammatical sentences.
3 Pre-processing and Feature Extraction
To the feature set of (Murray, 2008) listed in table 1 we add some high level features. Since the main focus of this paper is to deal with the data imbal-anace issue hence for the sake of completeness and reproducibility of our work we briefly mention the basic features used. In section 8.3 we explicitly re-port the performance rise over the baseline due to the added features.
3.1 Lexical and Structural features
The list of added features include the number of content words (nouns and adjectives) in a DA. (Ed-mundson, 1969) looked at cue-phrases, keywords title and location of a sentence as features indica-tive of important sections in a document. We use a handpicked list of cue words like ”for example”, ”gonna have” etc as binary features. We also add several keywords like ”remote”,”plastic” etc based upon manual scrutiny, as binary features into the classifier. Further we use DA labels of current and four adjacent DAs as features.
3.2 Disfluency
The role of disfluencies in summarization has been investigated by (Zhu and Penn, 2006) before. They found that disfluencies improve summarization per-formance when used as an additional feature. We count the number of disfluent words in a DA using an automatic disfluency detector.
1
Three of the meetings were missing some required features.
3.3 Prosodic
We employ all the signal level features described by (Murray, 2008) which include mean, max and stan-dard deviation of energy and pitch values normal-ized by both speaker and meeting. The duration of the DA in terms of time and number of words spo-ken. The subsequent, precedent pauses and rate of speech feature.
DA Features mean energy mean pitch maximum energy value
maximum pitch value standard deviation of pitch
precedent pause subsequent pause uninterrupted length
number of words position in the meeting position in the speaker turn
DA time duration speaker dominance in DA speaker dominance in time
rate of speech SUIDF score TFIDF score
Table 1: Features used in baseline classifier
4 Gold Standard
In supervised frameworks, the creation of gold-standard annotations for training (and testing) is known to be a difficult task, since (a) what should go into a summary can be a matter of opinion and (b) multiple sentences from the original document may express similar content, making each of them equally good candidates for selection. The hypoth-esis is well supported by the lowkappavalue (Co-hen, 1960) of 0.48 reported by (Murray, 2008) on the AMI corpus.
or threshold we preserve the corresponding number of highest ranked DAs in the above list. For evalu-ation, (Murray, 2008) uses gold standard summaries obtained using similar procedure. For training, how-ever, he uses all DA segments with at least one link as positive examples.
As the term gold standard for the data set, cre-ated above, is misleading. We call the set of DAs so obtained by using this ranking and resampling procedure as Weighted-Resampled Gold Standard (WRGS). Henceforth in this paper, for a resampling rate of say 35% we will name the set of DAs so ob-tained as WRGS(35%) or simply WRGS for some undefined, arbitrary threshold.
5 Data Skewness
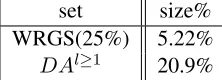
In this section we focus on the skewed data set which arises because of creating WRGS for training our classifiers. Consider the set of DAs with at least one link to the abstractive or human summaries. Let us call itDAl≥1. This set accounts for 20.9% of all DAs in the training set.
set size% WRGS(25%) 5.22%
[image:3.612.326.530.70.151.2]DAl≥1 20.9%
Table 2: Set sizes in % of all training DAs
Again consider set of DAs for WRGS(25%). This set, by definition, contains 25% of all DAs in the set DAl≥1. Hence the set WRGS(25%) constitute 5.22% of all DAs in the training set. Note that this is a skewed class distribution as also visible in table 2. Our system employs resampling architecture shown in figure 1. The first classifier is similar in spirit to the one developed in (Murray, 2008) with the additional features listed in section 3. The out-put we use is not the discrete classification result but rather the probability for each DA segment to be ex-tracted.
These probabilities are used in two ways for train-ing the second classifier: firstly, to create the resam-pled training set and secondly, as an additional fea-ture for the second classifier. The procedure for re-sampling is explained in the section 6.
First Classifier / Resampler
Second Classifier
Training Set Resampled
Training Set
[image:3.612.129.240.406.446.2]probabilties
Figure 1: A two-step classification architecture for ex-tractive meeting summarization.
6 Resampling
As explained in previous section our model obtains resampled data for second stage classification using the probabilistic outcomes of a first stage classifier. The resampling is done similar to (Xie et al., 2008) to cater to the data skewness problem. To do the resampling, firstly, the DAs are ranked on decreasing probabilities. In the next step, depending on some resampling rate, a percentage of highest ranked DAs is used in further classification steps, while rest of DA segments are neglected.
(Xie et al., 2008) obtained the resampled set by ranking the DAs on TFIDF weights. Data resam-pling benefits the model in two ways a) by improv-ing the positive/negative example ratio durimprov-ing the training phase b) by discarding noisy utterances in the test phase as they usually attain low scores from the first classifier.
In testing, the first classifier is run on the test data, its output is used, as in training, to create the resam-pled test set and the probability features. Finally, the summary is created from the probabilities pro-duced by the second classifier by selecting the high-est ranked DA segments for the specified summary length.
As the data for resampling is derived by a learning-based classifier, we call our approach
Learning-Based Sampling(LBS).
In this paper, we compare our LBS model with the TFIDF sampling approach adopted by (Xie et al., 2008) and present the results of resampling on both models in section 8.2.
7 Evaluation Metric
The main metric we use for evaluating the sum-maries is the extension of the weighted precision
evaluation scheme introduced by (Murray, 2008). The measure relies on having multiple annotations for a meeting and a many-to-many mapping dis-cussed in section 2. To calculate weighted precision, the number of times that each extractive summary DA was linked by each annotator is counted and av-eraged to get a single DA score. The DA scores are then averaged over all DAs in the summary to get the weighted precision score for the entire summary. The total number of links in an extractive summary divided by the total number of links to the abstract as a whole gives the weighted recall score. By this def-inition, weighted recall can have a maximum score of 1 since it is a fraction of the total links for the en-tire summary. Also, there is no theoretical maximum for weighted precision as annotators were allowed to create any number of links for a single DA.
Both weighted precision and recall share the same numerator:num= ΣdLd/N whereLdis the
num-ber of links for a DAdin the extractive summary, andN is the number of annotators. Weighted pre-cision is equal towp = num/Ds where Ds is the
number of DAs in the extractive summary. Weighted recall is given byrecall =num/(Lt/N)whereLt
is the total number of links made between DAs and abstract sentences by all annotators, and N is the number of annotators. The f-score is calculated as:
(2×wp×recall)/(wp+recall).
In simple terms a DA which might be discussing an important meeting topic e.g. selling price of the remote control etc is more likely to be linked by more than one annotator and possibly more than once by an annotator. Therefore the high scoring DAs are in a way indicative of quintessential topics and agenda points of the meeting. Hence, weighted precision which is number of links per annotator averaged over all the meeting DAs is a figure that aligns itself with average information content per DA in the summary. Low scoring meeting chit-chats will tend to bring the precision score down. We re-port a weighted precision of 1.33 for 700 word sum-mary extracted using the procedure described in 2 for obtaining gold standard. This is hence a ceil-ing to the weighted precision score that can be
ob-tained by any summary corresponding to this com-pression rate. Weighted Recall on the other hand signifies total information content of the meeting. For intelligent systems in general the recall rate in-creases with increasing summary compression rates while weighted precision decreases2.
Since we experiment with short summaries that have at most 700 words, we do most of the com-parisons in terms of weighted precision values. In the final system evaluation in section 8.3, we include weighted recall and f-score values.
8 Experimental Results and Discussion
8.1 Training on gold standard
Figure 2 shows the weighted precision results on training an SVM classifier with different gold stan-dard thresholds. For example, at a threshold of 60%, the top 60% of the linked DA segments are defined as the gold standard positive examples, all other DA segments of the meeting are defined as negative, non-extraction worthy. The tests are performed on a single stage classifier similar to (Murray, 2008).
In addition, the curves show the behavior of the system at three different summary compression rates (i.e., number of words in the summary). A gen-eral tendency that can be observed is the increase in summary scores with decreasing threshold. For 700 word summaries the peak weighted precision score is observed at 35% threshold. The recall rate remains constant as seen by comparing the first two rows of table 5.
We believe that low inter annotator agreement is the major factor responsible for these results. This shows that a reduced subset classification approach will generally improve results when multiple anno-tations are available.
8.2 Resampling
In this section we compare two resampling models. The TFIDF model explained in section 6 selects best DAs based on their TFIDF scores. As discussed
2
Figure 2: SVM at different compression rates.
previously all sentences above a resampling thresh-old are preserved while rest are discarded. In 8.2.2 resampling is done from the probabilities of a first stage classifier. SVM model is used for both first and second stage classification.
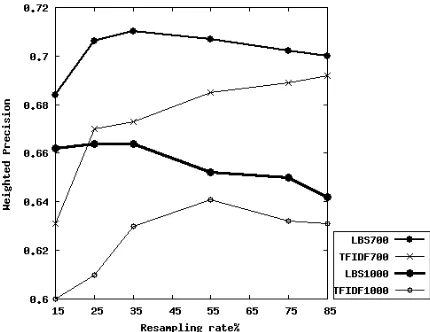
8.2.1 TFIDF Resampling
Table 3 reports weighted precision and f-scores at two compression rates. The highest f-scores for 700, 1000 word summaries are obtained at 85% and 55% respectively. Plots of figure 3 compare weighted precision scores for LBS and TFIDF models.
# words: 700 1000 resampl. % wp f-score wp f-score
15 .631 .217 .600 .274 25 .670 .227 .610 .282 35 .673 .227 .630 .296 55 .685 .231 .641 .305
[image:5.612.316.534.109.236.2]75 .689 .232 .632 .302 85 .692 .233 .631 .299 100 .686 .231 .637 .302
Table 3: TFIDF weighted Precision, f-score for 700 and 1000 word summaries
8.2.2 LBS
The peak performance of the LBS model is ob-served at resampling rate of 35% for both 700 and 1000 word summaries as seen in table 4. The maxi-mum f-scores, 0.248 and 0.319 (table 4) obtained for
LBS outperforms maximum f-scores of 0.233 and 0.305 (table 3) for TFIDF.
# words: 700 1000 resampl. % wp f-score wp f-score
15 .684 .236 .662 .309 25 .706 .244 .664 .317 35 .710 .248 .664 .319
55 .707 .245 .652 .313 75 .702 .239 .650 .310 85 .702 .239 .642 .307 100 .692 .236 .639 .306
[image:5.612.322.537.287.453.2]Table 4: weighted precision, f-scores on LBS model
Figure 3: LBS and TFIDF wp values at different com-pression rates.
From figure 4 which shows positive example re-tention against sampling rate for TFIDF and LBS it is clear that for all sampling rates, LBS provides a higher rate of positive examples.
Also as discussed above, using a learning-based first classifier produces probability values that can be leveraged as features for the second classifier. We speculate that this also contributes to the differences in overall performance.
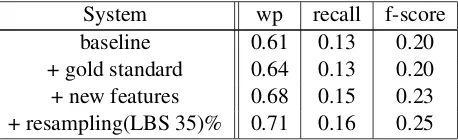
8.3 Overall System Performance
In this section we report weighted precision, recall and f-score for 700-word summaries, comparing re-sults of the new model with the initial baseline sys-tem.
[image:5.612.78.293.466.593.2]Figure 4: LBS and TFIDF retention rates.
WRGS, with a threshold of 35% increases the pre-cision score from 0.61 to 0.64 while maintaining the recall rate. This is corresponding to the weighted precision score for 35% data point in figure 2.
The last row in table 5 correspond to results ob-tained with using the LBS proposed in this paper. The scores at 35% resampling are same as the bold faced observations in table 4 for 700 word sum-maries. We observe that the LBS architecture alone brings about an absolute improvement of 4.41% and 8.69% in weighted precision and f-score.
System wp recall f-score baseline 0.61 0.13 0.20 + gold standard 0.64 0.13 0.20 + new features 0.68 0.15 0.23 + resampling(LBS 35)% 0.71 0.16 0.25
Table 5: Results on the AMI corpus.
9 Conclusions and Future Work
Through our experimental results in this pa-per, we firstly observed that training the classifier on WRGS (weighted-resampled gold standard) in-stances, rather than all the annotated DAs improved the weighted precision scores of our summarizer. We further addressed the problem of skewed class distribution in our data set and introduced a learning-based resampling approach where we resample from the probabilistic outcomes of a first stage classifier. We noted that resampling the data set increased
per-formance, peaking at around 35% sampling rate. We compared the LBS model with the TFIDF resampler obtaining better f-scores from our proposed machine learning based architecture. We conclude in general that resampling techniques for resolving data imbal-ance problem in extractive meeting summarization domain, results in enhanced system performance.
We are currently working on multiple extensions of this work, including investigating how the results can be applied to other corpora, adding additional features, and finally methods for post-processing ex-tractive summaries.
AcknowledgmentsThis work is supported by the Eu-ropean IST Programme Project AMIDA [FP6-0033812]. This paper only reflects the authors views and funding agencies are not liable for any use that may be made of the information contained herein.
References
Jacob Cohen. 1960. A coefficient of agreement for nom-inal scales. InEducational and Psychological Mea-surement.
Peter Corbett and Ann Copestake. 2008. Cascaded classifiers for confidence-based chemical named entity recognition. InCurrent Trends in Biomedical Natural Language Processing.
H. P. Edmundson. 1969. New methods in automatic ex-tracting. InJ. ACM, 16(2).
Erhard W. Hinrichs, Katja Filippova, and HolgerWunsch. 2005. A data-driven approach to pronominal anaphora resolution for german. In In Proceedings of Recent Advances in Natural Language Processing.
Gabriel Murray. 2008. Using Speech-Specific Charac-teristics for Automatic Speech Summarization. Ph.D. thesis, University of Edinburgh.
Shasha Xie, Yang Liu, and Hui Lin. 2008. Evaluating the effectiveness of features and sampling in extractive meeting summarization. In IEEE Spoken Language Technology Workshop (SLT), pages 157–160.
[image:6.612.74.303.449.519.2]