Copyright 0 1985 by the Genetics Society of America
EFFECTS OF PLEIOTROPY
O N PREDICTIONS
FOR POLYGENIC T R A I T S
CONCERNING MUTATION-SELECTION BALANCE
MICHAEL TURELLI
Department of Genetics, University of California, Davis, California 95616 Manuscript received October 10, 1984
Revised copy accepted May 14, 1985
ABSTRACT
Previous mathematical analyses of mutation-selection balance for metric traits assume that selection acts on the relevant loci only through the charac- ter(s) under study. Thus, they implicitly assume that all of the relevant muta- tion and selection parameters are estimable. A more realistic analysis must recognize that many of the pleiotropic effects of loci contributing variation to a given character are not known. T o explore the consequences of these hidden effects, I analyze models of two pleiotropically connected polygenic traits, de- noted P1 and l'~. The actual equilibrium genetic variance for PI, based on complete knowledge of all mutation and selection parameters for both PI and Pz, can be compared to a prediction based solely on observations of P1. This extrapolation mimics empirically obtainable predictions because of the inevi- tability of unknown pleiotropic effects. The mutation parameters relevant to PI are assumed to be known, but selection intensity is estimated from the within-generation reduction of phenotypic variance for P1. The extrapolated prediction is obtained by substituting these parameters into formulas based on single-character analyses. Approximate analytical and numerical results show that the level of agreement between these univariate extrapolations and the actual equilibrium variance depends critically on both the genetic model as- sumed and the relative magnitudes of the mutation and selection parameters. Unless per locus mutation rates are extremely high, i.e., generally greater than 1 0-4, the widely used gaussian approximation for genetic effects at individual loci is not applicable. Nevertheless, the gaussian approximations predict that the true and extrapolated equilibria are in reasonable agreement, i . e . , within a factor of two, over a wide range of parameter values. In contrast, an alternative approximation that applies for moderate and low per locus mutation rates predicts that the extrapolation will generally overestimate the true equilibrium variance unless there is little selection associated with hidden effects. The tend- ency to overestimate is understandable because selection acts on all of the pleiotropic manifestations of a new mutation, but equilibrium covariances among the characters affected may not reveal all of this selection. This casts doubt on the proposal that much of the additive polygenic variance observed in natural populations can be explained %y mutation-selection balance. I t also indicates the difficulty of critically evaluating this hypothesis.
T is not known what accounts for the persistence of heritable polygenic
I
variation. Based on a mathematical analysis and empirical estimates of the This paper is dedicated to my friend and colleague John Gillespie on the occasion of his fortieth birthday.166 M. TURELLI
relevant parameters, LANDE (1 975) argued that mutation-selection balance may play a major role. This hypothesis, discussed earlier by FISHER (1930), LATTER (1 960), KIMURA ( 1 965) and BULMER ( 1 972), is extremely appealing because it involves an equilibrium between two ubiquitous forces: stabilizing phenotypic selection, which tends to eliminate additive genetic variance (e.g., FISHER 1930; ROBERTSON 1956; LEWONTIN 1964; WRIGHT 1969; BULMER 1972) and muta- tion, which continually reintroduces it. Previous mathematical analyses of mu- tation-selection balance for quantitative characters (reviewed in TURELLI 1984) assume that selection acts on the relevant loci only through the character(s) under study. This implies that all of the relevant mutation and selection pa- rameters are empirically estimable. However, the complex pathways that con- nect DNA to phenotypes ensure that the alleles contributing variation to any one character will also affect numerous other characters, not under study, that are also under selection. Naturally, one expects these hidden effects to obscure the relationship between estimable mutation and selection parameters and the actual mutation-selection equilibrium. This paper presents mathematical anal- yses that display how this relationship changes with alternative genetic assump tions and mathematical approximations. The mathematics is coupled with an attempt to determine the biological conditions under which the alternative models and approximations are appropriate. A major corollary of the calcula- tions is that genetic conclusions based on a set of mathematical assumptions introduced by LANDE (1975) may not be robust.
LANDE’S (1 975) treatment of mutation-selection balance, which he has ex- tended to multiple characters connected by pleiotropy (LANDE 1980), uses a generalization of the CROW and KIMURA ( 1 964) continuum-of-alleles model for polygenic traits. This model assumes that alleles and loci contribute additively to the trait(s) of interest (i.e., dominance and epistasis are ignored) and that the segregating alleles at each locus have an essentially continuous range of effects. T h e cornerstone of Lande’s analyses is the additional assumption that at each locus the distribution of allelic effects in a population is approximately gaussian. The additivity assumptions of Lande’s generalization of the contin- uum-of-alleles model together with the use of gaussian distributions to approx- imate the effects of the segregating alleles will be referred to as the gaussian genetic model. Unlike traditional population genetic analyses which derive ga- mete and allele frequencies from specified recursions, the gaussian genetic model assumes that the form of the distribution of effects is known. This profoundly simplifies the mathematics. Consequently, the gaussian genetic model is now the most commonly applied genetic analysis for polygenic traits, with applications including mutation-selection balance (LANDE 1975, 1977,
1980), sexual selection (LANDE 198 l), spatially varying selection (FELSENSTEIN 1977; SLATKIN 1978), disruptive selection (FELSENSTEIN 1979), and rapid phe- notypic evolution (KIRKPATRICK 1982).
It is important to recognize that the gaussian genetic model is not inter- changeable with gaussian-based models for phenotypes (e.g., FISHER I 9 18;
CONSEQUENCES OF PLEIOTROPY 167 traits in populations are often nearly gaussian (see WRIGHT 1968, chap. 15). In contrast, the gaussian genetic model stems from KIMURA’S (1965) mathe- matical derivation of an approximate gaussian distribution for allelic effects at individual loci under mutation-selection balance. Although KIMURA’S (1 965) result is frequently invoked, the underlying biological assumptions have gen- erally been unknown and ignored. Using the single character mutation and selection model of LANDE (1975), I have shown (TURELLI 1984) that the gaus- sian approximation for segregating alleles is likely to be applicable at equilib- rium only if the relevant loci experience extremely high mutation rates, e.g.,
in excess of per locus. An alternative approximation, named after KING-
MAN’S (1 978) “house-of-cards” model, was demonstrated to be applicable for more usual per locus mutation rates, i.e., 5 1 OW4. However, this conclusion was based on a one-character analysis that ignored confounding effects in the es- timation of the intensity of stabilizing selection. One objective of this paper is to describe biological and mathematical conditions under which the gaussian and house-of-cards approximations for the continuum-of-alleles model are valid when pleiotropy is considered.
T h e basis for the house-of-cards approximation is the empirically motivated assumption that among mutants at a given locus, the variance of phenotypic effects exceeds the variance of effects associated with currently segregating alleles (see Turelli 1984, pp. 147- 148). Unlike LANDE’S (1 975) predictions and the closely related results of KIMURA (1 965) and FLEMING (1 979), the house- of-cards predictions agree with those derived from a diallelic model by LATTER (1960) and BULMER (1972, 1980) and from a triallelic model by TURELLI (1 984). Thus, a key result from the single-character house-of-cards analysis is that the equilibrium genetic variance maintained by mutation-selection balance
is approximately independent of the number of available alleles at each locus. T h e analysis below shows that pleiotropy destroys this property. Thus, the validity of multivariate predictions for mutation-selection balance hinges on the validity of assumptions concerning the number and effects of segregating al- leles. This is one source of uncertainty that confounds equlibrium predictions based on single-character analyses.
As noted previously, the other major source is the estimation of selection intensity. Selection estimates for quantitative characters generally come from observing the frequency distribution of a character, or set of characters, in a cohort at two stages of the life cycle (JOHNSON 1976; LANDE and ARNOLD
1983). These estimates are used to predict selection intensities at the under- lying loci (see TURELLI 1984), but there are confounding influences. As shown by LANDE and ARNOLD (1983), changes in a given character are caused not only by direct selection on that character, but also by selection on correlated characters. This suggests that selection intensities may tend to be overesti- mated. Conversely, however, all of the selection experienced by new mutations may not be reflected accurately by phenotypic correlations. T h e goal of the analyses below is to sort out these contradictory effects.
168 M. TURELLI
quences of hidden pleiotropic effects. Within this general framework, I present two extreme alternative models for the number and effects of segregating alleles at each locus. T h e first is the continuum-of-alleles model of LANDE (1 980), the second is a five-allele generalization of the triallelic model of TUR-
ELLI (1984). To simplify the subsequent analyses, I argue for assuming com- plete linkage equilibrium so that only single-locus equilibria need be approxi- mated.
In the second section, APPROXIMATE ANALYTICAL RESULTS are presented for each model. Two alternative approximations are used for the continuum-of- alleles model: a gaussian approximation based on LANDE (1 980), which is
shown to be appropriate for relatively high per locus mutation rates, and a generalization of the house-of-cards approximation from TURELLI (1 984), which is shown to be appropriate for relatively low per locus mutation rates. Only a low mutation rate analysis is presented for the five-allele model. Qual- itative differences between the models and approximations are highlighted by simple special cases. I n addition, I present some asymptotic results for the low- mutation approximations which display the range of possible discrepancies be- tween actual equilibrium variances and extrapolations based on incomplete information. Detailed calculations are relegated to appendices.
T h e third part of my analysis consists of two sorts of NUMERICAL RESULTS. T h e first is numerical approximations for mutation-selection equilibria which exhibit the accuracy and domains of applicability of the alternative approxi- mations. T h e second consists of graphical and numerical comparisons of actual and extrapolated equilibria for various parameter values. Finally, the DISCUS- SION elaborates the difficulties of experimentally evaluating the power of mu- tation-selection balance to account for observed heritable variation.
MODELS AND METHODS
CONSEQUENCES OF PLEIOTROPY 1 6 9
study. T h e complexity of the results from this simple model dampens enthu- siasm for more realistic models of unknown pleiotropic effects.
As in empirical studies, we can estimate the intensity of stabilizing selection
on P I by measuring the reduction in phenotypic variance through the life cycle.
If it is assumed that both characters are at mutation-selection equilibrium, this within-generation reduction in variance can be calculated from a_ bivariate analysis. This yields a stabilizing selection estimate for PI, denoted Vs,l, which will be called the realized intensity of selection in PI. Assuming thzt the mu- tation parameters relevant to P1 are known, we can put them and V5,] into the formulas derived from single-character mutatioc-selection balance theory. This produces an extrapolated prediction, denoted Vg,l, for the equilibrium genetic variance for PI. In this model system, it can be directly compared to the true equilibrium genetic variance, denoted
cg,l,
obtained from a complete bivariate analysis. Thus, we can assess the accuracy of mutation-selection equilibrium predictions based on incomplete knowledge of genotype-phenotype relation- ships.Basic assumptions: We assume an effectively infinite, randomly mating, dip-
loid population with nonoverlapping generations. T o facilitate comparison with existing gaussian a’nd single-character results, we assume additive genetic ef- fects, no genotype-environment interaction and gaussian stabilizing selection as in LANDE (1 9 8 0 ) . Let P = ( P I , P2), G = ( G I , G2) and E = ( E l , E2) denote the bivariate phenotype and its genetic and environmental components. We assume
P = G + E , (1)
with the random vector
E
independent of G and distributed as a bivariate gaussian with mean (O,O), variances Ve,l and Ve,2 and correlation pe. Letting ndenote the number of loci contributing variance to either character, additivity of allelic effects implies
in which x(*) = (xt),
~ $ 3
denotes the average phenotypic contributions of an allele at the ith locus and the subscripts 8 and0
denote maternal us. paternal inheritance.Fitnesses are assigned to phenotypes by
w ( p l , ~ 2= ) exp{-’/2[(Pl/wd2
-
2pw(PI/w1)(P2/w2)+
( P 2 / ~ 2 ) ~ ] / ( 1-
p 3 . (3)Thus, both characters are subject to stabilizing selection with selection inten- sities proportional to wT2 and w;’ and optima scaled to 0. T h e correlation parameter pw satisfies -1
<
pw<
1 and measures the extent to which selection acts to produce covariance between P1 and Pz. Assumptions ( 1 ) and (3) imply that the mean fitness of genotype G isw(G1, Gz) = c exp[-Vz(G:V;:
-
~ ~ , G I G Z ( V , , I V ~ , S ) - ’ ~+
G%L?)/(1-
~ 3 1 ,
(4)in which c is a genotype-independent constant,
V,,, = wp
+
V,,,, and ( 5 4(5b)
170 M. TURELLI
Note that, as V,,, increases, the intensity of selection against nonoptimal geno- types for character i decreases.
Calculation of realized selection:
-
T h e key step in understanding the effects of pleiotropy is calculating Vs,l, the intensity of realized selection on PI, in terms of the parameters and phenotypic equilibrium of the bivariate model. T o cal- culate vs,l, we assume that P I experiences univariate stabilizing selection and we estimate its intensity from the within-generation reduction of phenotypic variance. T h e bivariate and univariate calculations for the change in pheno- typic variance rely on the approximation that the equilibrium distribution of phenotypes is gaussian. Because of the assumptions of polygenic inheritance(2) and gaussian environment effects ( l ) , this approximation for phenotypes is consistent with nongaussian distributions of allelic effects at the underlying loci. T h e accuracy of this approximation is discussed in APPENDIX 1 and in
FISHER (1 9 18).
Let Vp,l (Vi,,) denote the variance of P I before (after) selection, once the population has reached mutation-selection equilibrium. If we assume univariate gaussian stabilizing selection with intensity G*, i.e.,
w ( p l ) = exp(-P:/2G2), (6)
it is easy to show that
$ 2
and, hence,
A
V'!
=
vp,1
+
VpJUnder weak selection, i.e., G 2
>>
Va,l,thus
(7)
implies thatT h e weak selection approximation (8) is consistent with empirical estimates of ?s,l/Ve,l which generally fall between 10 and 20 (TURELLI 1984).
As (9) shows, predicting
r?,,,
from the bivariate model requires an approxi- mation for VP,]-
Vi,, at equilibrium. Let X p ( 2 ; ) denote the variance-covariance matrix for phenotypes before (after) selection, letE,
denote the variance-co- variance matrix for environmental effects, and letE,
denote the variance-co- variance matrix of the bivariate gaussian fitness function (3). As noted by LANDE (1 980),X p
-
2;=
zppw
+
2J'Zp2s Xp(&
+
X t ) - l 2 p ,( 1 0 4
( 1 Ob)
CONSEQUENCES OF PLEIOTROPY 171 yield
with
As expected from LANDE and ARNOLD’S (1983) discussion of indirect selection,
t . 1 5 V*J (1
2)
with equality if and only if ps = y.
Continuum-ofalleles model: T o carry out this analysis, we must specify the number and effects of alleles at each locus and the mutation scheme. Two models will be considered. T h e first is a special case of LANDE’S (1980) mul- tivariate extension of the continuum-of-alleles model. It assumes that at each locus there is an effectively infinite number of alleles with a continuous range of effects on one or both of the characters. Mutation at locus i occurs with probability pt and transforms an allele of effect
x
= (xl, xz) into an allele of effect x’ =(XI,
xi) withT h e mutation-induced displacement, M, is assumed to follow a bivariate gaus- sian distribution with mean (0, 0 ) , variances m:,t and m f , , and correlation pA,,.
Apart from the existence of correlation in the mutation-induced changes of P I
and Pz, this model assumes that no constraints are imposed by the genetic system. In particular, every locus affecting both characters is capable of pro- ducing essentially any effect on each character.
Five-allele model: T h e alternative model that will be considered is a five-allele generalization of the triallelic model of TURELLI (1984). It is a simple attempt at introducing genetic constraints associated with a limited range of potential bivariate allelic effects. For locus
i,
the alleles are denoted A$!o andAil
forj ,
k
= -Cl; allele Alfl contributes (jcl,,, kcz,,) to (GI,Gz)
with C I , ~ cp,, 2 0. This model is most plausible when allele A$!o is nearly fixed. Then, mutation affects the equilibrium genetic structure primarily through the mutation rates fromA$)O to the other four alleles. T h e mutation rate from A&, to AJ$ is
x ’ = x + M . (13)
PLlfd,O).(r*.t) = lhPt(l
+
jhPA,I) (14)with -1
<
P , , ~< 1. For simplicity, the mutation model will be completed by
assuming that each of the alleles A$ for
j ,
k
= f l mutates only to A ~ ! o at ratep,. This simplifying assumption has little effect on the low mutation rate ap- proximations presented in the next section. This model assumes that among mutants from A&, the variance introduced for PI (Pz) is c:,, (&) and the correlation between the changes in P1 and Pz is P ~ , ~ . Thus, the parameters
c!,, and cf,, are analogous to m:,, and m:,, in the continuum-of-alleles model,
I72 M. TURE1,I.I
T h e five-allele model differs from the continuum-of-alleles model in one critical respect. In both models nonzero P ~imposes a probabilistic coupling , ~
between the effects of mutation on the two characters. T h e five-allele model imposes an additional deterministic coupling between the variances contributed to the two traits, namely, their ratio must be ~ : , , / c f , ~ irrespective of other parameter values. Given our lack of knowledge of the genetic variants under- lying quantitative variation, it is difficult to determine whether this strict con- straint is more or less realistic than the weaker coupling imposed by P ~ , ~ .
Unfortunately, these alternative assumptions lead to quantitatively different consequences for hidden pleiotropic effects.
Linkage equilibrium and weak selection approximation: To complete the descrip-
tion of these polygenic models, the linkage relationships among the n loci should be specified. However, several lines of evidence presented in TURELLI (1 984) suggest that the overall genetic variances and covariances will be essen- tially independent of the recombination scheme under realistic selection values and reasonable constraints on the recombination rates. For instance, although both LANDE (1 975) and FLEMING (1 979) account for linkage disequilibrium and diploidy in their analyses, their final results for V, can be very well ap- proximated by applying their analyses to each locus in isolation as done earlier by LATTER (1960), KIMURA (1965) and BULMER (1972). Moreover, several numerical multilocus calculations show that, unless many of the loci are very tightly linked, so that the harmonic mean recombination rate falls below 0.05, the polygenic equilibria can be well approximated by extrapolating from single- locus haploid results (cJ: LANDE 1980). This holds even with selection as strong
denote a one-locus hap- loid prediction for the equilibrium genetic variance contributed to P I by locus
i,
and let @) denote the covariance for effects on P I and P2 of the alleles atlocus i. We assume that the overall variances and covariances can be approxi- mated by summing over loci, i.e.,
as V J V , = 10.
This simplification will be exploited below. Let
(15b)
APPROXIMATE ANALYTICAL RESULTS
Continuum of alleles
CONSEQUENCES OF PLEIOTROPY 173
erated by the recursion
pi,t+l(x) = (1
-
~ i ) p l t+
piJ
pl!,t(y)ma(x-
y ) d y
pL(x) = pi,t(X)w(x)/%
G , t
=J
pa,t(x)w(x)dx,(16)
with
and pi the mutation rate at locus
i.
(All integrals here and below are taken over the entire domain of the integrands unless otherwise specified.) For con- venience of notation, I have assumed that each locus has a mean effect of 0at equilibrium.
Gaussian approximation: following LANDE (1980), if we assume that p , , ( x ) and
pi,t+l(x) are gaussian, (16) implies
Z,,+,
=Z$
-
Z
@
,
+
Z p t ) - l Z p t+
paZ$. (17)For weak selection (i.e., Zs
+
Z,),
the equilibrium is approximated by(18)
2(i)
E . ~ - l / z ~ g ~ ; % )%E?,g s P r s
with positive semidefinite matrix square roots. Together with (15), this pro- vides explicit, albeit cumbersome, formulas for f g , l and F s , l . T h e single-char- acter extrapolation analogous to (18) is given by KIMURA'S (1965) formula
@,'I E JpjmT,ifs,l ; (19)
c g , i ( G ) J ~ ~ E , I & , I ~ ~ , I , (20)
from which (1 5) produces
n n
with u:,1 = 2 pimT,i and nE.1 =
2 ( 1
-/&Ii=l i= 1
as in LANDE (1975).
Because of the complexity of the expressions for cg,1 and
Pg,l,
algebraiccomparisons are not generally informative. However, one special case is worth considering, despite being biologically implausible, because it reveals a critical difference between the gaussian and house-of-cards predictions. Suppose there is no environmental correlation, no correlation in the phenotypic fitness func- tion (3) and no correlation in the mutant effects at the pleiotropic loci, i.e., p e = pw = pm,i 0. This reduces all of the matrices in (18) to diagonals, so that
= and @ ) = 0 for i = 1,
...,
n . (21)vgg,i(G) cg,i(G). (22)
It follows from (1 l), (15) and (20) that in this special case
174 M. TURELLI
of $g,l(G) for a wide range of parameter values. This is in marked contrast to the house-of-cards predictions.
House-of-cards approximation: T h e central argument presented in TURELLI (1984) in favor of the house-of-cards (HC) approximation is not affected by pleiotropy. When the variance associated with new mutants exceeds the seg- regating allelic variance, i.e., m,TI
>>
@i,
the equilibrium of (16) can be ap- proximated byif a constant c = (1 - pl)/G1 < 1 can be found so that
J
p , ( x ) d x = 1 (see KINGMAN 1978). APPENDIX2
displays an approximation for the equilibrium genetic variance and covariance produced by this distribution. T h e general algebraic expressions are complex and will not be repeated. However, if ps =P,,,,~ E 0, they reduce to
n
$g,I(HC) = 4VS,1 pJ(1
+
P,)
and tg(HC) = 0, with (24)PP
= s d s 1 , 2 and sJ,z = m,TI/V,,. ( 2 5 )I= 1
T h e composite parameter
PI
plays a critical role in what follows. Note that, if an allele of optimal effect at locus i mutates, it will suffer a decrease in relative fitness of order s,,: from selection on character j . Thus, when the house-of- cards approximation is applicable,PP
quantifies the relative intensity of selec- tion on new mutants that is attributable to their effect on the hidden character( P 2 ) us. their effect on the observed character ( P I ) . Even with nonzero corre- lations, remains central param5ter. As shown by approximation (2.6b) in APPENDIX 2, for each value of pp, Vgs1 depends on Vs,2, m;,, and m& only through
PE.
From TURELLI (1 984), the general single-character extrapolation is
For p e = pw = pm,i the special case
Pi
0,
cS,1
= Vs,] so that (24) impliescg,]
(HC)<
vg,l
(HC). InP,
the relationship is simplyeg,i(HC) = (1
+
P)Qg,i(HC). (27)A simple generalization to k hidden characters is available under complete symmetry, i.e., m:, V,, and no correlation. Under these as- sumptions (27) generalizes to
m 2 and V,,
whereas vg,1(G) = $g,I(G) irrespective of k.
CONSEQUENCES OF PLEIOTROPY 175 nected, can affect each other’s evolution only through phenotypic correlation. Because
cs,l
relies on phenotypic correlation for information about selection induce! by hidden pleiotropic effects, Fgg,l(G) may often reasonably approxi- mate Vg,l(G). In contrast, under the house-of-cards approximation, pleiotropic effects that are not revealed by correlation can decisively influence the genetic equilibrium. T h e reason is clear. T h e house-of-cards analysis assumes that all mutants arise from nearly optimal genotypes. These mutants will experience selection associated with all of the characters they affect, whether or not those characters, o r the mutational displacements, are correlated. Thus, hidden char- acters that are pleiotropically connected to observed ones can produce hidden selection that is not detected bycs,l.
Even with correlatio?, it is generally true that, asP
increases, cg,l(HC) increasingly overestimates Vg,l(HC). However as shown below, literally any relationship is possible.Although algebraic comparisons of the general expressions for cg,l(HC) and cg,I(HC) are not practical, three special cases, with Pi p m , are
tractable:
P
<C 1,P
= 1 with p m = p s , andP
>>
1. These cases reflect: selection on pleiotropic loci primarily through the character observed, equally through the observed and unobserved characters and primarily through the unseen character, respectively. From the general expressions for cg,l(HC) and cg,l(HC) in APPENDIX 2, it follows thatP
and pm,ilim t g , l ( ~ ~ ) / c g , l ( ~ ~ ) = I (29)
0-0
if Vs,2/Vs,l 4 as
P
+ 0. Thus, as expected intuitively,Aif selection acts essen-tially only on character 1, cg,l accurately approximates Vg,l. However, the ratio in (29) can approach one either from above or below depending on the signs of the correlation parameters. Thus, hidden pleiotropic effects need not bias pg,l upward.
If pi
=
1 and pm,i 3 p s , it follows from (2.6a) and (2.7a) thatwith equality if and only if
Thus for
P
= 1 and pm = ps, the results obtained without correlation supply an upper bound for the error introduced by hidden pleiotropic effects. How-ever, the numerical results of the next section show that this bound does not apply for other parameter combinations.
+ CO with nonzero corre-
lations. LANDE and ARNOLD’S (1983) multivariate analysis of phenotypic selec- tion suggests that this case, in which most selection experienced by the ob- served character is indirect, may frequently apply. Unfortunately, the results depend critically on how this selection occurs. Note that selection can be con- centrated on P2 by (1) letting m i / m : + CO with Vs,l/Vs,B fixed or (2) letting Vs,2/ Vs,l + 0 with m:/m: fixed or (3) by taking both limits simultaneously. Biolog-
176 M. TURELLI
ically, cases 1 and 2 reflect pleiotropic selection through large phenotypic effects on an unseen character that is under moderate selection us. moderate phenotypic effects on an unseen character that is under strong selection. If it is assumed that Vs,2 is bounded above, it can be shown that in case 1
whereas in cases 2 and 3
Thus,
vg,l
can either greatly overestimate or underestimate cg,l depending on the nature of pleiotropic selection. These asymptotic results must be inter- preted cautiously because the numerical analyses in the next section show that there are combinations of paraTeters for whichp2
is large, e.g., 10-100, butfg,l
is within a factor of two of Vg,l.Predicted domains of applicability: Reasonable conjectures concerning the do- mains of applicability of the alternative approximations can be obtained by requiring that the predictions be consistent with the assumptions used to derive them. T o keep the algebra manageable, I will consider only p e = pm = p w = 0. T h e numerical results in the next section show that these predictions suffice to produce useful guidelines.
LANDE (1975) motivated his gaussian analysis by assuming m?
<<
e).
T h e natural extension under pleiotropy ism,Tz
<<
Gji
for j = 1 , ~ . (34)pUl
>>
max(m?,JVS,1, m & / v s , ~ ) . (35)In the absence of correlation, substitution of @L(G) leads to
Thus, the effects and selection coefficients associated with both characters must satisfy the corresponding single-character constraints.
T h e house-of-cards predictions are based on (23) which assumes the converse of (34), namely,
m,T, >>
Q:
for j = 1 , ~ . (36)p2
<<
ml,,m2,,/(v,,l~~,2)'. (37)In the absence of correlation, substitution of @i(HC) leads to
This suggests that the house-of-cards approximation may apply to loci affecting two characters even when the single-character consistency criterion, pl
e<
m?/Vs, is not met for both characters. T h e numerical results of the next section confirm this. They also show that the strong inequalities in (35) and (37) can be relaxed to requiring only that the right- and left-hand sides differ by a factor of three.House-ofcards approximation for the Jive-allele model
APPENDIX 3 presents five-allele approximations for Qg,l and
Fg,l
that areCONSEQUENCES OF PLEIOTROPY 1 7 7
model. Two levels of approximations are given. T h e less precise ones, denoted Cg,1(5) and CgTg,1(5), are simpler and are used for the comparisons below. As for the continuum-of-alleles approximations, a comparison of the general expres- sions for
Cg,L
and eg,l is not helpful. However, as before, the comparison is illuminating when pe = pW = pm,i E 0. In this case, the approximations reduceto
n
with
Pf
= S ~ , J S ~ , ~ , as in the continuum-of-alleles model, but s),~ = c,’/V,,. ForpZ
p,
we have the simple relationshipVg,i(5) = (1 -k b2)Cg,i(5)- ( 4 0 )
Thus, under these conditions, Gg,l always overestimates
Cg,l
as it does underthe house-of-cards analysis for the continuum-of-alleles model. However, here the overestimate is proportional to
p2
rather than /3[CJ:
(2’7)l.This discrepancy between the continuum and five-allele predictions arises from a change in Cgg,l. Thus, in contrast to the single-character results of
TURELLI ( 1 9 8 4 ) , pleiotropy makes the house-of-cards predictions dependent on the number and effects of segregating alleles at each locus. Given our igno- rance of these, this result is not reassFring.
T h e discrepancy between
Cg,]
and Vg,l can be increased or decreased by the presence of nonzero correlations. As for the continuum-of-alleles, three cases, withPI
5p
and pm,, E pm, will be considered: /3<<
1, = 1 andp
>>
1 . Aswith the house-of-cards approximations for a continuum-of-alleles,
if Vs,2/Vs,1 + CO as
P
+= 0. ForP
= 1 and sgn(pm) = sgn(p,),vg,1(5) 5 2Cg,i(5) ( 4 2 )
with equality if and only if pe = pm = pw = 0. However, this bound is not preserved if sgn(p,) = -sgn(ps).
A significant difference from the continuum-of-alleles HC predictions arises with
P
>>
1. As before, it is informative to consider selection piling up on character2
in three separate ways: (1) cg/c: cc with V5,1/V,,2 fixed, ( 2 ) V5,2/ V,,l + 0 with cg/c: fixed and (3) cf/c: + CO and Vs,2/Vs,l + 0. As for thecontinuum, c y e 1 leads asymptotically to Fgg,1(5)
>>
Cg,1(5); whereas case 2 leads to Cg,l(5)<<
vg,1(5). T h e difference is that here case 3 also produces178 M. TURELLI
even in the presence of correlation. This is illustrated by the numerical results of the next section.
We can again apply the consistency criterion to delimit parameter values for which the five-allele approximation is expected to be accurate. The assumption
$8)
1 that leads to (3.3) is equivalent to the house-of-cards assumptionc :
~
>>
Q$i
forj
= I ,2
(44)P ,
<<
m a ~ ( ~ W ' ~ . l , cUVS,d. (45)[$ (36)]. If no correlation is assumed, substitution of @;(5) yields
Thus, for this bivariate model, the house-of-cards approximation is expected to apply to a locus if the single-character criterion, pZ
<<
cf/VS, is satisfied byeither of the characters affected. Because this model directly couples the vari-
ances contributed to each character, constraint (45) is weaker than the analo- gous constraint (37) for a bivariate continuum of alleles.
NUMERICAL RESULTS
T h e analytical approximations of the previous section will be supplemented by numerical analyses of two sorts. T h e first treats the accuracy and domains of validity of the various predictions for the equilibrium genetic variances and covariances. Supported by the analytical and numerical results underlying the linkage equilibrium and weak selection assumptions, I will consider only one- locus haploid models. Second, multilocus predictions for ?g,l and
eg,]
will be compared over a range of parameter values. These will extend and generalize the qualitative results obtained from the analytical comparisons for special cases. All calculations were performed in double precision on a DEC LSI1 1 /23 microcomputer (providing approximately 17 accurate decimal digits).
One-locus haploid equilibria
All of the equilibria were calculated by t h e same method. T h e first step for the continuum-of-alleles model is to approximate the recursion (1 6) by a finite allele analog of the form
with S a set of allele indices, the frequency of allele i among gametes in generation t, wi the (marginal) fitness of allele i and ug the mutation rate from allele i to allele
j .
T h e haploid version of the five-allele model (3.1) is already in this form. MORAN (1976) proved that under (46) the allele frequencies globally converge to the normalized (i.e., Zp2 = 1) elements of the unique, positive left eigenvector for the dominant eigenvalue of V = ( W I U ~ ) . This ei- genvector was approximated via the EISPACK algorithms (SMITH et al. 1976) and was used to approximate the equilibrium variances and covariances.Continuum of alleles: T h e major obstacle to approximating equilibria for (1 6)
CONSEQUENCES OF i'LEIOTROPY 179 of-alleles model can be very well approximated by 2 1 alleles with equally spaced effects. When the house-of-cards approximation is applicable, even fewer alleles suffice to approximate V,. This is expected because the same analytical ap- proximation applies with two, three and a continuum of alleles per locus. In contrast, with pleiotropy the house-of-cards predictions for five alleles and a bivariate continuum differ appreciably. This suggests that a larger number of alleles may be needed to accurately approximate a two-dimensional continuum. Surprisingly, the number needed to achieve accuracy comparable to that ob- tained in one dimension (i.e., relative errors of predictions in the neighborhood of 1-5%) is very large. In fact, 121 alleles (1 1 possi!de effects for each of the two characters) do not generally suffice if effects are assigned by a direct extension of the discretization procedure in TURELLI (1984). Because the avail- able computer could not easily manipulate matrices larger than 121 X 121, I used the more elaborate discretization procedure described in APPENDIX 4.
A brief review of the single-character continuum-of-alleles results from TUR-
ELLI (1 984) will be helpful in interpreting the two-dimensional results, partic- ularly the restricted range of parameters for which the gaussian approximation is accurate. One-locus haploid equilibria were calculated to determine the rel- ative accuracy and domains of validity for four alternative approximations: house-of-cards, KIMURA (1 965), LANDE (1 975) and FLEMING (1979). T h e non- gaussian approximation of FLEMING (1 979), reviewed in NAGYLAKI (1 984) and TURELLI (1 984), refines the gaussian approximations of KIMURA (1 965) and LANDE (1975). Over the range of parameter values used, the house-of-cards approximation was the most accurate for 20p 5 m2/Vs, whereas the FLEMING (1979) approximation was generally the most accurate for 2 0 p
>
m'/V,. These bounds are not sharp. Near the boundary both approximations err by 10-20% in opposite directions. If the estimates m2/Ve 2 0.03 from LANDE (1975) andV J V , s 10-20 from TURELLI (1984) are used, the numerical results supported
the house-of-cards approximation of
c,
for p 5 low4 and the Fleming approx- imation for p>
Even when the Fleming approximation was extremely accurate (e.g., for p = 10-2-10-3, its relative error was less than l%), the gaussian approximations overestimatedcg
by 10-40%. With m 2 / V , = 0.05,Vs/Ve = 20 and p = 10-4-10-5, they overestimated
cg
by a factor of three toten, with larger errors for smaller mutation rates.
In all of the tables below, the accuracy of the analytical predictions is esti- mated by computing the percent relative discrepancy between the predicted and numerically determined values of cg,i. These error estimates, which are confounded somewhat by the numerical approximations, are denoted %(G)i
and %(HC), for the gaussian and house-of-cards predictions, respectively. They are computed by
%(G), = 100(cg,,(G)
-
eg,i)/eg,t-
(47) Without loss of generality, we assume henceforth that Ve,l = Ve,2 = 1.proximations, the HC is the more accurate for p 5
180 M. TURELLI T A B L E 1
Effects of varying the mutation rate on the numerically determined equilibrium genetic variances, V , , and
G,,,
with V,I = 20, Vs,2 = 40, and p. = pm = pw = 0c1 m : x 10’ m % x 10‘ $8, I vg.2 %(G)I %(G)z %(HC), %(HC)Z
IO-‘ 5.44 2.47 9.79 X lo-* 9.64 X lo-‘ 6.8 3.2 176.9 167.6 IO-’ 5.21 2.68 2.20 X IO-* 2.31 X lo-* 45.7 41.6 19.7 16.4 5.21 2.61 2.67 X IO-’ 2.65 X lo-’ 282.5 284.5 -0.2 0.3 5.21 2.61 2.69 X 2.63 X 1102.9 1127.0 -0.7 1.3
_ _ _ _ ~ ~ ~
T A B L E 2
Effects of varying fi with Vs., = 20, Vs,2 = 40 and p. = pu = 0.8, pm = 0.79-0.82“
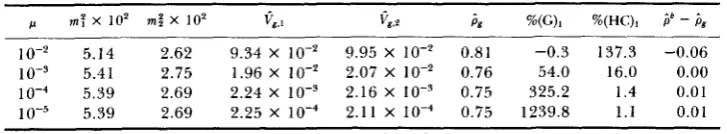
/,( m: x I O 2 m f x 1 0 2 $&I Gg.2 b g %(G)I %(HC)i bk - ;g
IO-‘ 5.14 2.62 9.34 X lo-‘ 9.95 X IO-‘ 0.81 -0.3 137.3 -0.06 IO-’ 5.41 2.75 1.96 X IO-‘ 2.07 X IO-* 0.76 54.0 16.0 0.00
5.39 2.69 2.24 X IO-’ 2.16 X IO-’ 0.75 325.2 1.4 0.01 lo-‘ 5.39 2.69 2.25 X 2 . 1 1 X 0.75 1239.8 1.1 0.01
a p,,, = 0.79 for p = lo-‘, p,,, = 0.82 for p = 10-3-10-5.
*
p = equilibrium correlation predicted by the gaussian and house-of-cards analyses.extremely accurate. T h e parameters in Table 1 yield mlmn/(Vs,lVs,2)’ g 1.3 X IO-’ and max(m:/Vs,l, mz/Vs,Z) E 2.6 X The results show that the strong inequalities in predictions (35) and (37) for the domains of applicability are conservative. A factor of three suffices for good agreement. For instance, with p = 4
x
and the remaining parameters as in Table 1, %(HC)I = 3.3 and %(HC)* = 0.5. Like the single-character results in TURELLI (1984), these sug-gest that the gaussian approximation is accurate only for extraordinarily high per locus mutation rates. For a “typical” rate of order it overestimates
cg
by a factor of ten. T h e relatively small errors in the regions of parameter space for which the gaussian or house-of-cards predictions were expected toapply support both the numerical approximations and the analytical predic- tions.
Table 2 shows that the qualitative results of Table 1 are not influenced by the addition of correlation. It also illustrates an unexpected relationship be- tween the gaussian and house-of-cards predictions. For these parameter values as well as all others examined, both approximations make identical predictions for the equilibrium genetic correlation. Further examination of the numerical results showed that
for all parameter values used. T h e first equality is easily verified analytically when pe = p m = p w = 0.
CONSEQUENCES OF PLEIOTROPY 181
TABLE 3
Effects of simultaneously varying the mutation variance parameters m: and m: with fi = V , , = 20, V,,2 = 40, and p. = pm = pw = 0
mf m%
cg.,
x lo3cg.*
x io3 % ( G ) ~ %(G), % ( H c ) ~ %(Hc)*2.61 X lo-’ 1.30 X lo-* 2.70 2.64 747.7 765.0 -1.1 1 .0 5.21 X lo-’ 2.61 X lo-‘ 2.67 2.65 282.5 284.5 -0.2 0.3 1.04 X 5.21 X lo-’ 2.53 2.60 80.8 75.5 5.5 2.4 2.09 x 10⁻³ 1.09 x
io-$
1.64 1.76 24.6 18.5 61.4 53.4 4.33 x 1.96 x 0.89 0.85 5.1 4.0 205.6 202.4TABLE 4
Effects of varying pw with = m: = 5.39 X lo-’, m; = 2.69 X lo-‘, pm = 0.82, p. = 0.8, Vs,, = 20 and Vs,2 = 40
& x 10s
e&*
x 105 ig %(C)I %(G)p %(HC)i %(HC)e 6 - &0.8 2.24 2.16 0.75 325.2 334.8 1.4 3.7 0.01 0.4 3.04 2.61 0.63 241.3 241.9 -0.2 0.0 0.00 0.0 2.85 2.39 0.51 249.9 247.8 0.3 -0.3 0.00 -0.4 2.19 1.87 0.36 301.7 302.5 0.2 0.4 -0.01 -0.8 1.14 1.04 0.13 483.8 509.9 0.7 5.2 -0.04 more accurate than the gaussian once p
<
mlm2/(VS,1V,,2)1/?, whereas the gaussian is more accurate for p>
max(m:/V,,l, m;/V,,z). Again, both approximations are quite accurate once a factor of three separates the two sides of the inequalities. T h e same qualitative results were obtained by varying the selection intensities and in the presence of correlation. Table 4 illustrates one of many sets of calculations showing that the house-of-cards approximations apply over a wide range of correlation parameters. It also displays the complex dependence of the equilibrium genetic variance on the correlation structure of the model.Table 5 presents a test of prediction (37) concerning the domain of appli- cability of the house-of-cards approximation. In the first five rows, m$ decreases while the parameters p , m: and Vs,l are held constant in the domain for which the single-character house-of-cards prediction is accurate, i.e.
,
lop 5 m?/Vs,l.T h e house-of-cards approximation is quite accurate for the first three sets of parameters which satisfy 3 p
< mlm2/(Vs,1V,,2)1h.
It is reasonably accurate even for the fifth set with p E mlm2/(V,,1Vs,~)”. Adding pc = pw = 0.8 and P,,, E 0.8 produces comparable house-of-cards errors but eliminates the decrease in the gaussian error as m$ decreases. Similar results were obtained by increasing Vs,2.For instance, the house-of-cards predictions are reasonably accurate for the parameters in the sixth row of Table 5 even though p = and m1m2/
These calculations demonstrate an important difference between the gaus- sian and house-of-cards approximations. T h e gaussian approximation accu- rately describes the variance contributed to P1 by a locus only if both of the characters affected by the locus satisfy p
>
m?/V,,i. Thus, its applicability can be destroyed by unknown pleiotropic effects involving strong selection ( i . e . ,182 M . TURELLI
T A B L E 5
Effects of extreme asymmetry, with = m: = 3.13 X lo-*, Vs,, = 20, and
p. = pm = pw = 0
3.13 X lo-‘ 40 2.35 3.31 237.5 238.5 -0.1 0.2 1.04 X lo-’ 40 2.82 2.34 180.6 176.5 0.7 -0.8
3.18 x 40 3.18 1.51 148.7 136.0 2.6 -2.7
1.09 x 40 3.35 0.97 136.6 115.3 5.6 -3.9
3.00 x 1 0 - ~ 40 3.43 0.54 131.1 104.0 9.2 -3.7 3.25 X lo-? 1500 3.37 32.88 135.2 112.3 6.3 -4.0 1.09 x IO-‘ 5000 3.46 28.59 128.8 158.8 11.4 26.0 1.13 X IO-’ 5000 3.48 4.79 127.9 398.9 13.5 148.5 large m ‘/VS). In contrast, the house-of-cards approximation accurately predicts both
Cg,] and
egg,*
as long as (37) is satisfied even if CL>
m;/V,,,. Additional calculations were performed to determine its behavior when (37) is violated but y<<
~Z:/V,,~. Two examples appear in the last rows of Table 5 . For the first, mlm~/(Vs,lVs,2)”* = 5.8 X lov5; for the second, it is 1.9 X Even though the house-of-cards approximation overestimates Vg,2, it reasonably ap- proximates Qg, This suggests that the house-of-cards approximation can ade- quately approximateCg,]
as long as<<
m:/Vs,l, irrespective of the parameters describing other effects of the locus. Clearly, this is a useful property when the pleiotropic effects are unknown.Five alleles: Equilibria for the haploid version of (3.1) were approximated for a wide range of parameter values to test the prediction that the house-of- cards approximations for both Cg,1 and Gg,2 would be accurate as long as
CL
<<
max(R/vS,l, d/vs,2). (49)T h e results of extensive calculations analogous to those presented in Tables 1-5 can be simply summarized. T h e “more precise” approximation (3.5) is within 10% of the observed equilibria as long as a factor of five separates the sides of (49). This holds irrespective of the correlation values used. For the cruder approximations (3.7) to reach this level of accuracy, a factor of 20 must separate the sides of (49). For such parameters, the “more precise” approxi- mation errs by less than 1 %.
Multilocus comparisons of
qg,l
and cg,lDespite the availability of analytical approximations for Cg,1 and
cg,I,
theircomplexity rules out simple conclusions concerning their relative magnitudes, except in special cases. Even the asymptotic results for the house-of-cards ap- proximations are of limited value because it is difficult to determine the actual parameter values for which they apply. T o provide some insight into the be- havior of the multilocus predictioy, two sorts of numerical results will be presented. T h e first are graphs of Vg,l and
cg,l
for each approximation underCONSEQUENCES OF PLEIOTROPY
0 8 -
1 6 r
. \ \
. \ \
\.
--.
,, \1.2
I
0 2 -
183
B
0 0 1
0 001 0 01 0 1 1
P'
-:-- O *-
- -
-.- .-
-. ' I h- - _
- - _
0.4
- _
0.0 10 100
P'
D
F
same mutation parameters, will be treated. Second, I present statistical sum- maries of comparisons between
tg,l
and vg,l obtained with parameter valueschosen randomly subject to various constraints. Both interchangeable and non- interchangeable loci are considered.
T h e six graphs in Figure 1 display
cg,l
and vg,l as functions ofP2.
T h e184 M. TURELLI
the statistical summaries below. Note that in each graph, there is a single curve for
Cg,]
but several for Qgg,]. T o produce them, initial values were chosen for all of the parameters; then, mz and V5,2 were varied to obtain the desired range ofp2
values. T h e alternative curves for eg,I result from varying m; and Vs,z at different rates. This was parameterized as follows. An initial choice of param- eter values gives p'(0) = m ~ ( 0 ) V 5 , 1 / m : V s , ~ ( ( O ) . To achieve P'(x) = 10.P2(0), m:and Vs,2 were varied as
m f ( x ) = m:(O) 1 Ox''@ and ( 5 0 4
Vs,2(x) = VS,2(O)1 O - x ( l - m p ) (50b) with 0 I mp 5 1. Thus, for mp = 0.5 both parameters vary at the same rate; whereas for mp > 0.5, mz varies more rapidly. Only a single cg,l curve appears in each graph because Cg,l depends on m$ and V5,2 only through
p2
once Vs,l,m: and p s are specified.
All of the graphs in Figure 1 assume Zp, = lo-' and p e = pm = p s = 0.8.
Other correlation patterns are discussed below. T h e graphs on the left assume that selection on new mutants is concentrated on character 1, i.e.,
p2
= m$,,,/ m:V,,2 < 1, and use as initial parameters Vs,I = 20, Vs,2 = 40, m: = 0.06 andm: = 0.03. T h e graphs on the right assume that selection is concentrated on character
2,
i.e.,p2
>
1, and use Vs,l = 40, Vs,2 = 20, m: = 0.03 and mg = 0.06. T h e gaussian predictions, Figure 1A and B, assume ten loci so that pz=
T h e house-of-cards predictions for five alleles, Figure 1E and F, assume 100 loci so that pz=
T h e graphs on the left show, as expected, that, if selection acts primarily through the observed character, the predictions, Qg,,l, are always close to the
true equilibria, V g , ] , irrespective of the model or approximation used. However, even as
0'
+ 0, Qs,1 accurately reflects the selection on the underlying loci only if Vs,2 + 03. Thus, although all of thecg,l
curves tend toward cg,l asP2
-+ 0, those with smaller mp values, corresponding to a more rapid increase of
Vs,2, converge more quickly.
T h e consensus among the models and analyses disappears for
p'
>
1. Figure 1 B shows that, according to the gaussian analysis,qg,l
accurately approximatescg,I
forp2
<
10 and then becomes increasing conservative asP2
increases. In contrast, Figure 1D showslthat under the house-of-cards analysis of the same model,Vg,]
overestimates Vg,1 for this range of parameters. Recall from (32) and (33) that, if mz/m: 03 with V,,,/V,,, constant, we expectcg,,/cg,l
>>
1eventually; whereas if mI/m: and Vs,,/Vs,2 both increase, we expect V g , l / c g , l -e<
1 eventually. This is reflected in the approach of
cg,l
toPg,l
as mp decreases from 0.75 to 0.25. However, even with mp = 0.5, so that m;/m: and V5,1/Vs,2increase at the same rate, Vg,1 overestimates Vg,1 by a factor of two or three for 1
<
p2
<
100. As expected from the analytical results of the previous section, Figure 1F shows that, for the five-allele model, the house-of-cards analysis predicts a larger discrepancy betweenVg,l
andCg,]
than seen with a continuum of alleles. For mp = 0.5, cg,1 overestimates I?&,] by a factor of eightor more for 20
<
P2
100. For instance, withp2
= 30, Vg,l = 0.35 corresponds to a predicted heritability of h 2 = 0.26; whereasT h e five-allele predictions are based on (3.5).
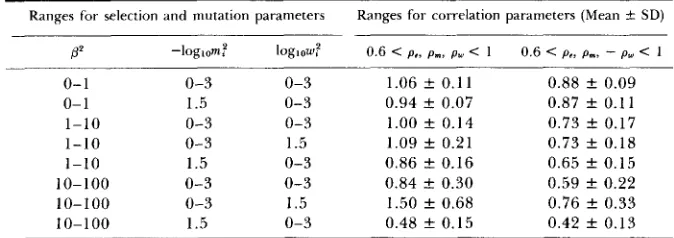
CONSEQUENCES OF PLEIOTROPY 185 T o circumvent partially the biases inherent in choosing examples and to understand the consequences of interlocus mutation differences, Vg,l and $g,l
were computed for parameter values chosen at random subject to various constraints. Three regions of parameter space for mutation and selection were explored: 0
0‘ <
1, 1<
p’
<
10 and 10<
p2
<
100. T o illustrate the effects of changingp’
= m~V,,l/m:V,,z via m%/m: vs. Vs,l/Vs,2, either the m’s, the Vs’s or both were chosen at random. When both were sampled, each ratio was restricted to the square root of the range ofp2.
Thus, for 10<
p2
<
100,mz/m‘: and Vs,l/Vs,:, were both restricted to
(m,
10). Over a given range, the values of m’ and w‘ = Vs,i-
1 were chosen independently and uniformly on alog scale. For
p’
<
1 (>l), the random values were ordered so that m: 2 mg (m: I m;) and Vs,l I Vs,2 (Vs,l 2 Vs,2). Only pairs satisfying the appropriate constraints were used to computecg,,
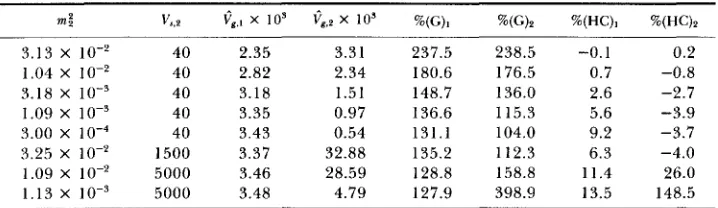
and Gg,l.In addition to picking random mutation and selection parameters, several patterns of correlation were considered. T h e simplest, pe = pm = pw = 0,
provides a standard of comparison for the house-of-cards predictions with non- zero correlations; it yields cg,l
=
Qg,l for the gaussian prediction. T h e con-straints 0.6
<
pe, pm, pw<
1 will be called “complementary” correlations. Based on the frequent agreement in sign of empirical estimates for genetic and en- vironmental correlations (see, for instance, HECMANN and DEFRIES 1970; FAL- CONER 1981, TABLE 19. l), this pattern may be the most reasonable, although the magnitudes imposed are large. Three other correlation patterns were also investigated in which the sign of one of pe, p m or pw differed from the other two; these will be referred to as “antagonistic” correlations. Among them, sgn(pe) = sgn(p,) = -sgn(p,) seems most reasonable because environmental and genetic perturbations of development may tend to have similar effects. In the tables below, only the pattern 0.6 pe, pm, -pw<
1 is considered, but results from the other two antagonistic correlation patterns will be briefly described. To condense the results, only the estimated means and standard deviations for?g,l/$g,l will be presented. For each range of parameters, the estimates are
based on 10,000 values for interchangeable loci and 1000 for noninterchange- able loci.
Table 6 presents results obtained with the gaussian approximation for ten interchangeable loci. T h e central qualitative result is that cg,l i! generally
within a factor of two of Qgg,l. Given the difficulty of estimating V, and esti-
mating the parameters that enter cgg,*this lye1 of agreement seems quite :at- isfactory. When
cg,l
is not within (YZV,,~, 2Vg,1), it is generally less than YzVg,l. As illustrated by Figure lB, the gaussian analysis predicts that cg,l tends toincreasingly underestimate Qg,l as
p2
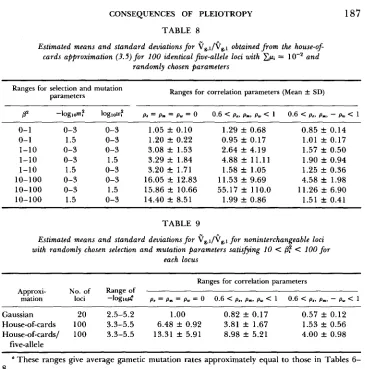
increases through both mX/m? and Vs.l/Vs,z.Apart from this distinguishing feature of the gaussian predictions, the other two major trends that appear in Table 6 also show up in Tables
7
and 8, which present results from the house-of-5ards analyses. For each we see (1) for a given range ofp2,
the mean of fg,l/Vg,, is largest when only mz/m! varies186 M . TURELLI
T A B L E 6
Estimated means and standard deviations f o r $g,,/$g,, obtained from the gaussian
approximation f o r ten identical loci with Cpi = lo-* and randomly chosen parameters
Ranges for selection and mutation parameters Ranges for correlation parameters (Mean C SD)
P P
0- 1 0- 1 1-10 1-10 1-10 10-100 10-100 10-100 0-3 1.5 0-3 0-3 1.5 0-3 0-3 1.5 loglow: 0-3 0-3 0-3 1.5 0-3 0-3 1.5 0-3
0.6 < p.. p.. py < 1
1.06 _t 0.11
0.94 k 0.07 1.00 k 0.14 1.09 f 0.21 0.86 k 0.16 0.84 k 0.30 1.50 f 0.68 0.48 & 0.15
0.6 < P ~ , pm,
-
py < 10.88 f 0.09 0.87 f 0.11 0.73 k 0.17 0.73 f 0.18 0.65 f 0.15 0.59 f 0.22 0.76 f 0.33 0.42 f 0.13
For details see text.
T A B L E 7
Estimated means and standard deviations f o r $g,l/$g,l obtained from the house-of: cards approximation with interchangeable loci, Cp, = IO-' and randomly chosen
parameters
Ranges for selection and mutation
parameters Ranges for correlation parameters (Mean _t SD)
P' -logma loglow? p. = p. = pm = 0 0.6 < p.. p.. py < 1 0.6 < p.. pn,- pw < 1
0- 1
0- 1
1-10 1-10 1-10 10-100 10-100 10-100
0-3 0-3 1.18 f 0.18 1.39 f 0.52 1.5 0-3 1.44 f 0.27 1.28 k 0.39 0-3 0-3 2.79 f 0.43 2.83 1 1.20 0-3 1.5 2.81 k 0.61 3.66 f 2.53 1.5 0-3 2.79 k 0.60 2.04 -t 0.87 0-3 0-3 6.68 f 1.34 4.00 2 2.09 0-3 1.5 6.54 f 1.86 15.36 f 13.92
1.5 0-3 6.51 f 1.84 1.06 k 0.65
0.85 f 0.15 1.02 2 0.15 1.22 f 0.40 1.23 f 0.45 0.98 rt 0.36 1.63 f 0.74 2.97 f 1.81 0.70 f 0.36 does the complementary correlation pattern, sgn(pp) = sgn(pn) = sgn(p,). Al- though the results do not appear in the tables, sgn(p,) = sgn(p,) = -sgn(p,) generally produces larger values than the complementary pattern; whereas sgn(pm) = sgn(p,) = -sgn(p,) produces values comparable to those with sgn(p,) = sgn(p,) = -sgn(pw). Irrespective of their signs, as the magnitudes of the correlation coefficients decrease, the results converge to those obtained without correlation. For instance, using the gaussian approximation with 10
<
p2
<
100 obtained from random values for m:/m: and Vs,l/Vs,p, the mean and stand- ard deviation of
pg,,/pg,l
are 0.93*
0.08 for 0.2<
p , , p m , p,<
0.6 and 0.78& 0.1 1 for 0.2
<
pe, p,, -pw<
0.6.Tables