TABLE OF CONTENTS: Vol37, No. 4, July 1994
ARTICLES291
2%
J 298
303
4 309
312
317
321
\/ 325
330
334
340
343
349 ? 353
358
362
365
Effects of Livestock Grazing on Sediment Production, Edwards Plateau of Texas by G.R. McCalla II, W.H. Blackburn, and L.B. Merrill
Prediction of Sediment Yield from Southern Plains Grasslands witb tbe Mod&d Universal Soil Loss Equation by S.J. Smith, J.R. Williams, R.G. Menzel, and G.A. Coleman
Soil and Nitrogen Loss from Oregon Lands Occupied by Tbm Subspecies of Big Sagebrush by Sherman R. Swanson and John C. Buckhouse
Vegetation and Soil Responses to Cattle Grazing Systems in tbe Texas Rolling Plains by M. Karl Wood and Wilbert H. Blackburn
An Economic Analysis of Two Systems and Three Levels of Grazing on Ponderosa Pine-Bunchgrass Range by Thomas M. Quigley, Jon M. Skovlin, and John P. Workman
Grazing Effects on Mycorrbiul Colonization and Florlstlc Composition of tbe Vegetation on a Semi-arid Range in Nor&em Nevada by Gabor J. Bethlenfalvay and Suren Dakessian
Herbaceous Vegetation-Lotebusb/iphus obtu.@olia (T. & G.) Gray vu. obtusi- jo&z]Interactions in Nortb Texas by M.A. Foster, C.J. Scifres, and P. W. Jacoby, Jr. Habitat Relations of Cercoarpusmontunus (true mountain mahogany) in Central
Utah by J.D. Brotherson, D.L. Anderson, and L.A. Szyska
Black-tailed Prairie Dog Food Habits and Forage Relationships in Western South Dakota by Daniel W. Uresk
Dry Season Forage Selection by Alpaca
(Lamapacos)
in Southern Peru by R.D. Farfan and F.C. BryantBotanical Composition of Diets of Cattle Grazing South Florida Rangeland by R.S. Kalmbacher, K.R. Long, M.K. Johnson, and F.G. Martin
Spanish Goat Diets on Mixed-brush Rangeland in the South Texas Plains by L.E. Warren, D.N. Ueckert, M. Shelton, and A.D. Chamrad
Yields, Nutrient Quality, and Palatability to Sheep of Fourteen Grass Accessions for Potential Use on Sagebrush-Grass Range in Soutbeastem Idabo by Robert B. Murray
Cattle Diets on Seeded Clearcut Areas in Central Interior Britisb Columbii by Dee A. Quinton
Small Mammal Abundance on Native and Improved Footbill Ranges, Utah by Courtney B. Smith and Philip J. Umess
An Economic Analysis of Black-tailed Prairie Dog [Cynomys MovMun~~] Con- trol by Alan R. Collins, John P. Workman, and Daniel W. Uresk
Stem-Diameter Age Relationships of Tumur& rumozizsimu in Central Utab by Jack D. Brotherson, John G. Carman, and Lee A. Szyska
Published bimonthly-January, March, May, July, September, November
Copyright 1984 by the Society for Range Manage- ment
INDIVIDUALSUBSCRIPTION is by membership in the Society for Range Management.
LIBRARY or other INSTITUTIONAL SUBSCRIP- TIONS on a calendar year basis are $56.00 for the United States postpaid and $66.00 for other coun- tries, postpaid. Payment from outside the United States should be remitted in US dollars by interna- tional money order or draft on a New York bank. BUSINESSCORRESPONDENCE, concerning sub- scriptions, advertising, reprints, back issues, and related matters, should be addressed to the Manag- ing Editor, 2760 West Fifth Avenue, Denver, Colo. 80204.
EDlTORIALCORRESPONDENCE,concerning manu- scriptsor othereditorial matters, should beaddressed to the Editor, 2760 West Fifth Avenue, Denver, Colo. 80204.
INSTRUCTIONS FOR AUTHORS appear on the inside back cover of each issue. A Style Manual is also available from the Society for Range Manage- mentattheaboveaddress@$1.25forsinglecopies; $1.00 each for 2 or more.
THE JOURNAL OF RANGE MANAGEMENT (ISSN 0022-409X) is published six times yearly for $56.00 per year by the Society for Range Management, 2760 West Fifth Avenue, Denver, Colo. 80204. SECOND CLASS POSTAGE paid at Denver, Colo. POSTMASTER: Return entire journal with address change-RETURN POSTAGE GUARANTEED-to Society for Range Management, 2760 West Fifth Avenue, Denver, Colo. 80204.
The Journal of Range Management serves as a forum for the presentation and discus- sion of facts, ideas, and philosophies pertain- ing to the study, management, and use of rangelands and theirseveral resources. Accord- ingly, all material published herein is signed and reflects the individual views of the authors and is not necessarily an official position of the Society. Manuscripts from any source- nonmembers as well as members-are wel- come and will be given every consideration by the editors. Submissions need not be of a technical nature, but should be germane to the broad field of range management. Editor- ial comment by an individual is also welcome and subject to acceptance by the editor, will be published as a “Viewpoint.”
370
373
377
380
Glandular Trichomes: A Helpful Taxonomic Character for ArtemMa no~u (Black Sagebrush) by Rick G. Kelsey
Persistence and Cqlonizing Ability of Rabbitbrush Collections in a Common Garden by James A. Young, Raymond A. Evans, and B.L. Kay
Shoot Production and Biomass Transfer of Big Sacaton [Sporobohs wrighti by Jerry R. Cox
Controlling Individual Junipers and Oaks with Pelleted Picloram by Thomas N. Johnsen, Jr., and Raymond S. Dalen
BOOK REVIEWS
384 Manual of Remote Sensing Editor-Chief Robert N. Colwell; Diversity edited by Ruth Patrick; A Handbook of Rare and Endemic Plants of New Mexico by The New Mexico Native Plant Protection Advisory Committee.
Managing Edltor PETER V. JACKSON III
2760 West Fifth Avenue Denver, Colo. 80204 Editor
PATRICIA G. SMITH
Society for Range Management 2760 West Fifth Avenue Denver, CO 80204 Book Review Editor RICHARD E. FRANCIS
Rocky Mountain Forest and Range Experiment Station 2205 Columbia S.E.
Albuquerque, New Mexico 87106
ASSOCIATE EDITORS E. TOM BARTLETT
Dept. of Range Science Colorado State University Fort Collins, CO 80523 GARY FRASIER
780 West Cool Drive Tucson, AZ 85704 G. FRED GIFFORD
Range Science Dept. Utah State University Logan, UT 84322 W.K. LAUENROTH
Department of Range Science Colorado State University Fort Collins, CO 80523 LYMAN MCDONALD
Statistics Department
College of Commerce and Industry University of Wyoming
Laramie, WY 82071 ROBERT MURRAY
US Sheep Experiment Station Dubois, ID 83423
KIETH SEVERSON Forest Hydrology
Laboratory
Arizona State University Tempe, AZ 85281 DARREL UECKERT
Texas Agricultural Experiment Station 7887 N. Highway 87
San Angelo, TX 76901 BRUCE WELCH
Shrub Science Laboratory 735 N 500 E
Provo, UT 84701 LARRY M. WHITE
USDA ARS
S. Plains Range Research Station 2000 18th St.
Woodward, OK 73801 KARL WOOD
Dept. of Animial and Range Sciences Box 3-l
Las Cruces. NM 88001 JAMES YOUNG
USDA ARS
Effects of Livestock Grazing on Sediment
Production, Edwards Plateau of Texas
G.R. MCCALLA II, W.H. BLACKBURN, AND L.B. MERRILL
Abstract
The influence of short duration grazing (SDG), moderate con- tinuous grazing (MCG), heavy continuous grazing (HCG), and grazing exclusion on sediment production of midgrass and short- grass-dominated communities was evaluated over a 20-month period on the Texas Agricultural Research Station located near Sonora in the Edwards Plateau, Texas. A combination of cattle, sheep, and goats was used in each grazing treatment. Sediment production was consistently less from the midgrass (bunchgrass) than from the shortgrass (sodgrass) community. The HCG pasture was severely overgrazed and resulted in excessive soil loss. The midgrasses in this pasture were destroyed after 26 months of over- grazing. Sediment production from the SDG pasture stocked at double the recommended rate increased during the study period. The SDG pasture, by the end of the study, had lost more sediment from both the midgrass- and shortgrass-dominated communities than the MCG pasture. Sediment loss from the midgrass community in the MCG pasture was consistently low during the study; how- ever, sediment production from the shortgrass community decreas- ed in the MCG pasture. Sediment production from the midgrass community in the non-grazed pasture remained consistently low throughout the study, but the shortgrass community showed a strong decrease in sediment loss during the study.
Historically, grazing has been an integral part of rangelands (Mack and Thompson 1982) and native herbivores have co- evolved with grasslands and most shrublands. However, the intro- duction of domestic livestock increased the potential for adversely impacting rangeland watersheds. Rangelands by their very nature are naturally large contributors of sediment (Branson et al. 1981). Livestock grazing has the potential of altering the amount and kind of vegetation, which in turn potentially alters surface soil hydro- logic characteristics (Blackburn et al. 1982). Reductions in the amount of vegetation may increase raindrop impact, decrease soil organic matter and aggregates, increase surface soil crusting, and decrease infiltration rates (Chapman 1933, Branson and Owen 1970, Blackburn 1975, Wood and Blackburn 1981). Altering the kind of vegetation may also increase sediment losses. Sediment production of sagebrush (Artemisia spp.) canopy zones in Nevada was less than that of the adjacent interspace areas (Blackburn 1975). Sediment loss from shortgrass-dominated sites in the Rol- ling Plains of Texas was greater than from adjacent midgrass or shrub canopy sites. Livestock grazing altered the sediment loss most from the midgrass-dominated areas and had little or no influence on the shrub canopy zones or shortgrass areas (Wood and Blackburn. 1982).
Much interest has been generated by specialized grazing systems and their potentials for decreasing erosion and adding economic benefits to the ranching industry. However, little information is available to support many of the claims concerning specialized grazing systems (Gifford and Hawkins 1978, Blackburn et al.
1982). The purpose of this study was to determine: (1) the influence
Authors are graduate research assistant, and professor of watershed management, Range Science Department, Texas A&M University, College Station 77843; and professor of range science, Texas Agricultural Experiment Station, Sonora 76950.
Published with approval of the Director, Texas Agricultural Experiment Station, as TA-18839.
Manuscript received July 25, 1983
JOURNAL OF RANGE MANAGEMENT 37(4), July 1984
of heavy continuous grazing, moderate continuous grazing, short duration grazing, and no grazing on sediment loss, and (2) the variables influencing sediment loss.
Study Area
Research was conducted on the Texas Agricultural Research Station, located near Sonora in the Edwards Plateau, Texas. The 1,404-ha station lies on the boundary separating Sutton and Edwards counties. Station elevation is approximately 632 m with an average growing season of 240 days.
The Edwards Plateau is second only to the Trans-Pecos region of Texas in length and frequency of drought (Sprott 197 1). Station precipitation varied considerably during the study period (Fig. 1).
IB
1
- .- TOW
YOn+hly
.
16
-- .- - NorInd
Monthly
14
”
oJ , , , , , , I I 1 1 I 1 1 1 I 1 1 I 1 JFMAMJJASONDJFMAMJJA
1980 I ,981
Fig. 1. Total monthly precipitation, January 1980 through August 1981. and normal monthly precipitation for Texas Agricultural Experiment Station near Sonora, Texas.
Precipitation was highly variable and poorly distributed (428 mm) in 1980, especially during the early growing season, while 198 1 had above average precipitation (556 mm by August). No precipitation was recorded in July 1981 and the greatest precipitation (171 mm) occurred in the preceding month, June 198 1. Average precipitation for the station is 553 mm annually (TDWR 1982).
The study site soils are Tarrant silty clays, members of the clayey-skeletal, montmorillonitic, thermic family of Lithic Haplus- talls. the slopes are <3%. Vegetation of the study area at the beginning of this project was characterized by oak mottes and grass-dominated interspaces. The grass interspaces were domi- nated by either mid- or shortgrasses. Grasses on the study site included common curlymesquite (Hilaria belangeri (Steud.) Nash) the dominant sodgrass, threeawn (Aristida spp.), sideoats grama (Bouteloua curtipendula (Michx.) Torr.) the dominant bunch- grass, Texas wintergrass (Stipa leucotricha Trin. & Rupr.), blue- stems (Andropogon spp., Bothriochloa spp., Schizachyrium spp.), and hairy grama (Bouteloua hirsuta Lag.). Dominant woody plants are live oak (Quercus virginiana Mill. var. virginiana), honey mesquite (Prosopisglandulosa Torr. var. glanduZosa(Torr.)
Cockll.) and ashe juniper (Juniperus asheii Buchh.).
Three grazing regimes: 1) heavy continuously grazing (HCG), 2) moderate continuously grazing (MCG), and 3) short duration grazing (SDG) (14 pasture-l herd; 4 day graze; 50 day rest period) were studied to evaluate the impacts of livestock grazing on selected hydrologic variables. An adjacent non-grazed pasture was added (March 1980) to evaluate recovery from livestock exclusion. The 3 grazed pastures were 6 ha in size and the non-grazed area was 3.5 ha. The HCG pasture was in low fair range condition at the beginning of the study (January 1980). The MCG, SDG, and non-grazed pastures were in fair to high fair condition (USDA
1972). A combination of cattle, sheep, and goats were used in each grazing treatment approximating the recommended AU ratio of 50:25:25, respectively, used on the Edwards Plateau.
of 0 to 3 cm and 5 to 8 cm were determined by the core method (Black 1965) and the gravimetric method (Gardner 1965), respec- tively. A soil sample was collected from O-3 cm within each plot after the simulated rainfall event and analyzed for organic matter by the Walkley-Black method (Walkley and Black 1934), aggregate stability by the wet sieve method (Kemper and Koch 1965), and texture by the hydrometer method (Bouyoucos 1962). Soil surface roughness within each plot was measured with a relief meter sim- ilar to the one described by Kincaid and Williams (1966) but consisting of 10 evenly spaced pins.
Analysis
The SDG pasture was under a high-intensity, low-frequency (HILF) (8 pasture-l herd; 17 day graze: 119 day rest period) grazing system prior to the SDG treatment (March 1978-December 1980). It was continuously grazed at a moderate stocking rate, approxi- mately 8.1 ha/AU/yr, previous to the HILF system. The SDG pasture simulated one pasture of a lCpasture, one-herd system, with approximately a 4-day and 50-day graze/rest cycle. Stocking rates varied from 3.2 ha/AU/yr to 4.9 ha/AU/yr because of de- stocking during the 1980 drought. The moderate continuously grazed pasture was historically grazed at 8.1 ha/
AU/
yr.Stocking rate on the HCG pasture varied in accordance with changes in forage production and livestock breeding season and was grazed most intensively at the beginning of the study. Stocking rate ranged from0.3 ha/AU/yr to 12 ha/AU/yr. This pasture has been extremely heavily grazed since March 1978, but previously was under MCG.
Data normality was determined by tests for skewness and kurto- sis (Snedecor and Cochran 1971). Values for sediment production and surface roughness were highly skewed requiring loglo trans- formation of the data sets. Within treatment variation (variation among subplots) was allocated to the residual for testing differen- ces (K.05) among treatments. Differences between vegetation communities and treatment differences by vegetation community were determined by analysis of variance. Treatment means were separated by Duncan’s multiple range test (Steele and Torrie 1980). Simple linear correlation and forward stepwise multiple regression analysis were used to determine degree of association and to iden- tify the most important factors determining sediment production (Draper and Smith 1981).
Results and Discussion Sediment Production
The non-grazed pasture was fenced in February 1980 to exclude livestock and was first sampled in March 1980. Previous grazing history was MCG. This pasture has a greater slope and stonier and shallower soil than the other pastures in the study. This difference was large enough to prevent direct comparison with the grazed pastures; however, recovery of watershed variables from livestock grazing can be evaluated.
Sediment production was significantly greater from the short- grass-dominated community than from the midgrassdominated community for all sample dates except March and May 1980 and July and August 198 1 (Fig. 2). The greatest sediment loss occurred
Methods
n
-a- Shortgrass Community --+- Midgrass Communify
Sediment Production
Sediment production was determined using a drip-type rainfall simulator (Blackbum et al. 1974) on 8, 0.5-m randomly located runoff plots in each vegetation type and treatments for each of the
11 sample dates during 1980 and 1981. The runoff plots were pre-wet with 120 liters of water using a sprinkler system to remove antecedent soil-water content differences and covered with clear plastic to maintain uniform surface water conditions. After the runoff plots drained to field capacity (approximately 24 hr), simu- lated rainfall was applied at a rate of 20.3 cm/ hr for 0.5 hours. This application rate approximates a storm with a return period of 150 years and was necessary to insure runoff from all plots. Runoff was continuously collected and, at termination of the simulated rainfall event, was thoroughly mixed and a l-liter subsample was collected. The sediment from each subsample was filtered through a #I Whatman filter, dried at 105’C for 24 hr, weighed, converted to sediment yield in kg/ ha, and used as an index of sheet erosion. Vegetative Cover, Standing Crop, and Mulch
The percentage of ground cover by midgrass, shortgrass, and forb foliage, and mulch, rock, and bare ground were determined by ocular estimate on each runoff plot from a gridded sampling quadrat. Grasses, forbs, and standing dead material were clipped to a 2-cm stubble height and mulch was hand-collected from each runoff plot. The herbaceous material was dried at 60°C for 48 hrs and weighed.
a a
; a a :
b
;
:
:
a a
:
a a0’ 8
JAN MAR MAY JUL AUG NO” JAN MAR MAY JVL A”G
1980 I 1981
Fig. 2. Mean sediment production by plant community and sample dare, Edwards Plateau, Texas. Mean for each sample date with the same letler are not significantly different (pC.05).
from the midgrass community in May 1980( 1,375 kg/ ha) and from the shortgrass community in August 1980 (3,874 kg/ ha). Lowest sediment production was from the midgrass community in July 1980 (337 kg/ha) and 1981 (363 kg/ha) and from the shortgrass community in July 1981 (524 kg/ha). The midgrass community showed an annual cyclic pattern with the lowest sediment produc- tion occurring in July. The cyclic pattern observed for the short- Soils
Immediately before each simulated rainfall event, soil bulk den- sity and soil water content adjacent to each runoff plots for depths
grass community tended to lag the midgrass soil loss pattern by 4 or 5 mo., except in July 1981 where soil loss because of excellent plant growth was low from both communities.
Midgrass Community
~ I-,:
Sediment production of the HCG pasture was significantly 6 . . o . . . . . y;l,:g::l:.:g_::z
greater than the MCG or SDG pastures in January, March and 6
8 a_._~;“_~____ 7 ,
0 ---- ----” ‘l”‘z “’ May of 1980 (Fig. 3). Accumulated sediment production through 56.~+ Shortgrass Community
1 : a a
4.000-b b b
ii
a a
z
a a a a
$
:,a.* a
& HCG --P-- MCG 5
48.000 -
..0.. SDG ii!
6 4o.cca - Mfdgrass Communrty
:
3.wJo - -&- HCG
--a-- MCG 0 32,ooa -
..a.. SDG t
2,ooa - Q 2
24.ooo- ,:’ ‘..
,:’ :
,.d’ ‘.:
; 4 16,ooo- P
l.ooo- ,:’ ‘.. ,:’
,*,*_.rTf
_..O;,.” b.. :.’ a 8.000 -&A-
___gTr._.~.~B”~.~‘e----~ ___~______o,__r.~~~.~~..‘.
a.. *. _/ o...d
,. --...~_____o_----~--~~~-~~~.~~~.~-.-
o _,~~r_, ._,._.~rr.~~:-::.-oO:.“.~“‘.“”
I . . . .._
z 00 =
I
I JAN MAR MAY JUL A”G NOV JAN MAR MAY JUL AUG
_,
r Yl : i FJ : : :
a a a
: a a ab
1980 1981
2 7.0al-b b bee ccb aab
Fig. 4.Accumulated sediment production’for midgrass or shortgrass plant
0 Shortgrass Community community by sample data and livestock grazing treatment, Edwards
I= -4- HCG Plateau, Texas. Accumulatedsoil lossfrom the HCGpasture wassigni/i-
0
;
--a-- MCG
..O.. soo cantly greater (PCOS). than from the MCG or SDG pastures for each sampledate. However, sediment loss wassimilarfrom the MCG or SDG
E pastures. Sampling was discontinued in the midgrass community after
L? May 1980 due to the adverse impact of the heavy stocking rate on
!2
bunchgrasses.
E pasture. This was primarily the result of the greater soil loss from
I the SDG pasture than from the MCG pasture during November
1980 and January 1981, which was attributed to poor growing conditions due to lack of rainfall during this period. Little regrowth occurred during the rest period prior to the November or January sampling dates. Grazing exclusion had little influence on sediment loss from midgrasses (Fig. 5). Sediment loss from the
5.ow- 2.000 -
-e.- Shortgrass Communrty
s 4.000- --*-- MIdgrass Commumty 2
iL 6
0’ ’ 4
JAN MAR MAY JUL AUG NOV JAN MAR MAY JUL AUG
F 3000-
1980 I 1981 2
Fig. 3. Mean sediment production for midgrass or shortgrass community 8 by sample date and livestock grazing Edwards Plateau, Texas. Meansfor
E 2000- each sample date with the same letter are not signtjicantly different 5 (IW.05). Sampling was discontinued in the midgrass community after May 1980 due to the adverse impact of the heavy stocking rate on
x
bunchgrass. ; IOCXJ-
L
___ _ __ -- - l
l ..- **
_.*---.___ --..~______________._--- May was I2 and 18 times greater from the HCG pasture than from
the MCG or SDG pastures (Fig. 4). These large sediment losses
from the HCG pasture were primarily a result of the small amount 0 JAN ’ MAR MA” J”L AUG NOV JAN MAR MAY J”L A”G
of bunchgrasses. Sampling was discontinued in the midgrass 1980 I 1981
community after May 1980, due to the adverse impact of the heavy Fig. 5. Mean sediment production for the non-grazed pasture by pkmt
stocking rate. community and sample date, Edwar& Plateau, Texas.
Sediment production from the MCG pasture was consistently
low throughout the study (Fig. 3). The lowest sediment loss non-grazed pasture was consistent throughout the study. occurred in March at the beginning of the study and the greatest Shortgrass Community
loss occurred in August 1980 and 1981. Sediment loss from the Sediment production from the HCG pasture was consistently SDG pasture varied, but was only significantly greater from the greater than from the SDG or MCG pastures (significant except in MCG pasture in November 1980 and January 198 1. Accumulated May and July of 1981) until August 1981 (Fig. 3). The greatest sediment production from the MCG pasture was constant through- sediment loss from the HCG pasture was in August 1980 with a out the study and was greater than the SDG pasture through general trend, especially after March 198 1, toward reduced sedi- August 1980 (Fig. 4). By November 1980, however, more accumu- ment loss primarily from the reduced stocking rate and improved lated sediment was lost from the SDG pasture than from the MCG soil water conditions. Accumulated sediment production was four
times greater from the HCG pasture at the end of the study than from the MCG or SDG pastures (Fig. 4).
Sediment production from the MCG pasture was variable, with a general trend for reduced sediment production after August 1980. The SDG pasture, however, showed a general trend of increased sediment production after May 1980. More sediment loss occurred from the MCG pasture than from the SDG pasture through August 1980; however, only during July and August was the loss significantly greater. Greater sediment loss occurred from the SDG pasture than from the MCG pasture during November
1980, and January and August 1981. Accumulated sediment pro- duction from the MCG pasture was greater than from the SDG pasture through July 1981 (Fig. 4). However, it was not until the last sample date that more sediment had been lost from the SDG pasture than the MCG pasture. This was a result of increased soil loss from the SDG pasture after August 1980. The shortgrass community in the non-grazed pasture showed a strong decrease in sediment production after August 1980 due to the increased plant and mulch cover (Fig. 5). Sediment loss from this pasture was greatest in August 1980 and least at the end of the study.
Sediment production from the SDG pasture increased during the study from both the midgrass and shortgrass communities. Sediment production in the shortgrass community tended to increase from the SDG pasture where trends for the HCG, MCG, and non-grazed pastures were all downward. Sediment production from the midgrass community in the MCG pasture varied little during the study.
Factors Influencing Sediment Production
Grass standing crop (r=0.58), midgrass cover (r=O.53), total vege- tation cover (r=O.Sl), surface roughness (r=O.44), bare ground (r=0.436), mulch accumulation (rz0.43) were the variables influenc- ing sediment production the greatest. Midgrass cover accounted for 28% of the variation in sediment production and was one of the stronger influencing variables. Shortgrass (r=0.09) and forb (r=O. 12) cover, however, accounted for less than 2% of the variation in sediment production and were positively related to sediment loss. Predictive equations with sediment production as a dependent variable were determined by forward stepwise multiple regression analysis. The independent variables are listed in order of correla- tion with the highest correlated variable listed first. The multiple regression equation for sediment production is:
sediment production, y = 3.620 - 0.004 GSC - 0.002 MA + .013 FC - 0.012 VC
Grass standing crop (GSC) was the most important variable followed in order by mulch accumulation (MA), forb cover (FC) and vegetation cover (VC). These variables accounted for 47% of the variation in sediment production (R2 = 0.47) and are all vegetation-related, strongly influenced by midgrasses and are neg- atively related to sediment production except for forb cover. No surface soil variable occurred in the equation. Forb cover, how- ever, is generally an indication of poor surface soil conditions and/ or site abuse. Likewise, midgrasses strongly influence surface roughness, organic matter content and bare ground. Sediment production was influenced more by vegetation variables than by surface soil variables. This may be because of the high organic matter content and well aggregated soil of the study area.
Conclusions
Sediment production was consistently less from the midgrass (bunchgrasses) than from the shortgrass (sodgrasses) community. A decline in midgrasses, regardless of the cause, results in greater soil loss. The HCG pasture was severely overgrazed and resulted in excessive soil loss. The midgrasses in this pasture were destroyed after 26 months of overgrazing.
Sediment production from the SDG pasture stocked at double the recommended rate increased during the study period. The SDG
pasture, by the end of the study, had lost more sediment from both the midgrass- and shortgrass-dominated communities than the MCG pasture. The greater soil loss from the SDG pasture occurred primarily during the 1980 drought. Results strongly suggest that if most of the additional carrying capacity with a SDG system cannot be obtained by increasing livestock distribution as a result of fencing and water development, then extreme caution should be used in adjusting stocking rates upward.
Sediment loss from the midgrass community in the MCG pas- ture was relatively stable during the study; however, sediment loss from the shortgrass community decreased in the MCG pasture. The non-grazed pasture had a large enough site difference to prevent direct comparison with the grazed pastures. Sediment production from the midgrass community after livestock exclusion remained fairly stable throughout the study, but decreased sedi- ment loss occurred in the shortgrass community.
Variables influencing sediment production include grass stand- ing crop, midgrass cover, total vegetation cover, surface rough- ness, bare ground and mulch accumulation. The most important multiple regression variables were grass standing crop, mulch accumulation, forb cover, and total vegetation cover.
Literature Cited
Black, C.A. (ed.). 1965. Methods of soil analysis. Amer. Sot. of Agron. Series No. 9. Madison, Wis.
Blackburn, W.H. 1975. Factors influencing infiltration and sediment pro- duction of semiarid rangelands in Nevada. Water Resour. Res. 11:929-937. Blrckburn, W.H., R.W. Knight, and M.K. Wood. 1982. Impact of grazing
on watersheds: a state of knowledge. Texas Agr. Exp. Sta. Pub. MP-1496.
Blackburn, W.H., R.O. Meeuwig, and C.M. Skau. 1974. A mobile infil- trometer for use on rangeland. J. Range Manage. 27:322-323. Bouyoucos, G.J. 1962. Hydrometer method improved for making particle
size analysis of soil. Agron. J. 54464-465.
Branson, F.A., and J.B. Owen. 1970. Plant cover, runoff, and sediment yield relationships on Mancos shale in western Colorado. Water Resour. Res. 6:783-790.
Branson, F.A., C.F. Cifford, K.G. Renard,md R.F. Hadley. 1981. Range- land Hydrology. Kendall/ Hunt Pub. Co., Dubuque, Iowa.
Brock, J.H., W.H. Blackbum, and R.H. Hans. 1982. Infiltration and sediment production on a deep hardland range site in north central Texas. J. Range Manage. 35:195-198.
Chapman, H.H. 1933. Influence of overgrazing on erosion and watersheds. Civil Eng. 3:74-78.
Draper, N.R., and H. Smith. 1981. Applied Regression Analysis. John Wiley and Sons, Inc., New York, N.Y.
Gardner, W.H. 1965. Water Content. In:C.A. Black(ed.), Methodsof Soil Analysis. Amer. Sot. of Agron. Series No. 9. Madison, Wis.
Gifford, G.F., and R.H. Hawkins. 1978. Hydrologic impact of grazing on infiltration: a critical review. Water Resour. Res. 14:304-313. Kemper, W.D., and E.J. Koch. 1965. Aggregate stability of soils from the
western portions of the U.S. and Canada. USDA Tech. Bull. 1355. Kincaid, D.R., and G. Williams. 1966. Rainfall effects on soil surface
characteristics following range improvements. J. Range Manage. 19~346-351.
Mack, R.N., and J.N. Thompson. 1982. Evolution in steppe with few large hooved mammals. Amer. Natur. 1 l9:757-773.
Snedecor, G.W., and W.G. Cochran. 1971. Statisitical Methods. Iowa State Univ. Press, Ames, Iowa.
Sprott, J.M. 1971.Texas droughtsduring the 20th century. Chapter 1. Beef cattle management duringdrought Texas Agr. Ext. Serv. Publ. B-l 108. Steele, R.G.D., and J.H. Torrie. 1980. Principles and Procedures of Statis-
tics. McGraw-Hill Book Co., Inc., New York, N.Y.
Texas Department of Water Resources. 1982. Climatic data for Sonora Experiment Station. Mimeo.
United States Department of Agriculture. 1982. Range condition classifi- cation. Mimeo.
Walkley, A., and A.I. Black. 1934. An examination of the Deqtjareff method for determining soil organic matter and a proposed modification of the chromic acid titration method. Soil Sci. 37:29-38.
Wood, M.K., and W.H. Blackbum. 1981. Sediment Procution as Influ- enced by Livestock Grazing in the Texas Rolling Plains. J. Range Manage. 34:228-23 1.
Prediction of Sediment Yield
Plains Grasslands with the
versa1 Soil Loss Equation
S.J. SMITH, J.R. WILLIAMS, R.G. MENZEL, AND G.A. COLEMAN
Abstract
Amounts of sediment per runoff event from grassland watersheds ln the Texas Blackland prairie, Southern High Plains, Central Rolling Red Prairies, and Central Rolling Red Plains land resource areas of Oklahoma and Texas were predicted using the modified Universal Soil Loss Equation (MUSLE). In this quatlon,
Y q 11.8(Qck,)066 KCPSL
where Y = sediment yield in metric tons, Q q runoff volume in m3,9p
= peak runoff rate in ma/set, K = soil erodibility factor, C = crop management factor, P q erosion control-practice factor, and SL =
slope length, gradient factor. Periods of study were 3 to 5 years and included treatments involving grazing density, fertilization, culti- vation, and burning. Over the range of watersheds, average mea- sured sediment yield varied from less than 10 to more than 800 kg/ha/event. In most cases, the predicted values compared favor- ably to the tleid measured values.
Accurate prediction of sediment yield from watersheds is impor- tant from land use, management, and environmental standpoints. To aid in this prediction Williams (1975) developed the Modified Universal Soil Loss Equation (MUSLE), by replacing the rainfall energy factor of the USLE (Wischmeier and Smith 1960) with a runoff energy factor. The energy factor in MUSLE is a function of the product of the runoff volume and the peak runoff rate for an individual storm. As noted by Williams (1981), MUSLE has cer- tain advantages over USLE, especially in simulating sediment yield from a watershed. The advantages include (I) application to indi- vidual storms, (2) elimination of the need for sediment delivery ratios because the runoff factor reflects energy used in sediment transport as well as in sediment detachment, and (3) greater accu- racy because runoff generally accounts for more sediment yield variation than does rainfall. In fact, the Sedimentation Task Committee (1970) of the Hydraulics Division, American Society of Civil Engineers, has stated that runoff is the best single indicator of sediment yield. To date, initial results with MUSLE have been encouraging (Williams 1981, Cooley and Williams 1983, Smith et al. 1983) but additional testing is necessary to fully document the equation’s utility in specific land resource areas and under different land management conditions. The present study involves applica- tion of the equation to grassland watersheds in the Texas Black- land Prairie (BP), Southern High Plains (HP), Central Rolling Red Prairies (RP), and Central Rolling Red Plains (RRP) major land resource areas of Oklahoma and Texas (Soil Conservation Service 1981).
Procedures and Watersheds Equation Development
In the original development of MUSLE (Williams 1975), mea-
Authors are soil scientist, hydraulic engineer, soil scientist, and hydraulic engineer, respectively. Address of Smith, Menzcl, and Coleman is Water Quality and Watershed Research Laboratory, P.O. Box 1430, Durant, Okla. 74702. Address of F;;;,rns is Grassland, Soil, and Water Research Lab., P.O. Box 748, Temple, Tex.
Technical assistance by ARS personnel at El Reno and Woodward, Okla., and Bushland and Temple, Tex., is gratefully acknowledged.
Manuscript accepted October 20, 1983.
from Southern
Modified Uni-
sured data provided runoff rates and volumes to form the runoff energy factor. This factor was then substituted for the rainfall energy factor in the USLE and an optimization technique (DeCour- sey and Synder 1969) was employed to determine the prediction equation. This equation, MUSLE, may be stated as:
Where Y q sediment yield in metric tons,
Q= runoff volume in m3, % = peak runoff rate in rn3/ set,
K= soil erodibility factor, c= crop management factor,
P= erosion control-practice factor, and SL = slope length, gradient factor.
Y q Il.8 (Qq,,)OmKCPSL
Except for substituting the runoff energy factor, 11.8 (Qqp)o.ss for the rainfall energy factor in USLE, the remainder of the equation is identical to USLE.
Watersheds
General details about the watersheds are included in the left part of Table 1. More specific information has been provided in earlier publications (Sharpley et al. 1982, Smith et al. 1983). Suffice it to note here that the watersheds provided good representation of the land resource areas, encompassing a range of soils, slopes, and grasses. Size varied from 0.04 to 122 ha and periods of study were 3 to 5 years. Watershed slopes ranged from 1 to almost 9%. During the period of study annual rainfall ranged from 43 to 95 cm, and mean annual runoff ranged from 1.2 to 24cm. Treatments included annual grazing, deferred grazing, fertilization, spring burning, and cultivation. Grazing intensities varied from none (HP) to double stocking (RP, FR I). Prior to the study, the BP and HP watersheds were in tame/ virgin grassland or cropland, and all others were in good condition, virgin grassland. After 2 years half of the RP and RRP watersheds were placed in continuous wheat. The BP and HP continuous cropland watersheds, which were in sorghum-cotton- oats and wheat-sorghum-fallow rotations, respectively, have been included mainly for comparative purposes.
Field Measurement and Sampling
Except for the small O&t-ha HP grassland watersheds, runoff was measured using precalibrated flumes or weirs equipped with FW-1 stage recorders. Sediment discharge was collected from suspended sediment concentrations taken automatically for the duration of each hydrograph. After comparison with the runoff hydrograph, samples for a specific watershed were cornposited in proportion to total flow to provide a single representative sample of liquid and sediment. In the case of the HP grassland watersheds, a “splitting device” was employed that collected about I/ 10 of the respective runoff. Sediment concentration was determined gravi- metrically after removal of liquid.
Testing Procedure
For each watershed, the MUSLE predictions were determined using runoff energy factors which involved measured runoff volumes and peak flow rates from individual events. The other
Table 1. Sediment yield characteristics of Southern Plains watersheds.
Major land
Res. area’ Watershed
Size ha
Average
Period of Number of Mean yield/event Std. Dev. Regression
“‘&l-Je
record events Meas. Pred. Meas. Pred. R* slope
BP
HP
RP
RRP
SWll 1.08 0.98 77-80 20
WI0 7.97 2.10 76-80 18
Y14 2.27 1.38 77-80 28
NG 0.04 1.00 78-80 4
SG 0.04 1.00 78-80 4
FRI 1.62 2.58 77-80 20
FR2 1.62 2.88 77-80 17
FR3 1.62 3.18 77-80 19
FR4 1.62 3.64 77-80 21
WWl 4.80 7.00 77-80 34
ww2 5.56 8.20 77-80 54
RP
RRP
FRS 1.62 3.48 77-80
FR6 1.62 2.88 77-80
FR7 1.62 2.88 77-80
FR8 1.62 2.73 77-80
ww3 2.71 8.60 77-80
ww4 2.91 7.40 77-80
;: 28 29
29 40
BP Y 122 2.57 7680 SO
Y2 53 2.86 76-80 34
BP Y6 6.6 3.21 76-80 24
Y8 8.4 2.24 76-80 18
YIO 7.5 1.88 76-80 23
HP GIO 3.3 1.80 78-80 16
Gil 2.6 2.00 78-80 19
Gl2 2.1 2.20 78-80 IS
b/h-
Grasslands
278 287 349 376
23 23 21 23
124 128 280 264
8 9 10 I1
14 I3 22 16
; 8 7 13 IS 15 16
8 9 20 19
IS IS 59 56
10 I1 2s 23
111 111 299 255
Grasslands to Wheat Lands
SO 63 157 198
46 47 133 148
25 37 64 9s
26 18 71 36
51 51 168 164
38 37 99 85
Mixed Lands (Grasslands and Croplands)
74 58* 118
148 174 191 2::
Croplands
542 534 481 364
343 343 550 487
812 632 1125 783
396 386 859 782
364 286 798 640
428 531 827 1060
0.91 0.89
0.88 0.84
0.77 0.93
0.97 0.84
0.92 1.30
0.89 0.84
0.96 0.95
0.96 1.08
0.99 1.05
0.94 1.06
0.88 1.10
1.00 0.94 0.99 0.69
1.00 0.88
0.80 0.87 0.67 1.66
1.02 1.09
0.90 1.36
0.83 0.75
0.60 1.02
0.98 1.12
0.84 1.32
0.99 1.09
0.98 1.23
0.94 0.76
*Statistically different at S% level from measured value using the t-test, paired data.
‘BP, Texas Blackland Prairie; HP, Southern High Plains; RP, Central Rolling Red Prairie; RRP, Central Rolling Red Plains.
factors, K,C,P, and SL. in Eq. [I], were obtained from Agricultural
Handbook 537 (Wischmeier and Smith 1978). In the case of the grasslands, P was unity and K, C, and SL ranged from0.28 to 0.37, 0.002 to 0.400, and 0.14 to 1.05, respectively. Statistical methods were conducted using standard procedures as outlined in Snedecor (1956). In the case of the linear regression analysis, a slope greater than unity indicates sediment yield is overpredicted, whereas a slope less than unity indicates sediment yield is underpredicted.
Results and Discussion
A comparison of the MUSLE predicted and the actual measured amounts of sediment yield on an event basis for the individual watersheds is detailed in the right part of Table 1. Obviously, a wide range of results within and among watersheds was obtained, with mean sediment yields per event ranging from essentially none
to as much as 812 kg/ ha on the Y 10 cropland watershed. Predic- tion of mean sediment yields and respective standard deviations was quite satisfactory, particularly in the case of the continuous grassland watersheds. In general, R2 values for both grasslands and croplands were 0.8 or higher and the regression slopes were close to unity. Moreover, using the paired t-test as a basis for difference, only the Y mixed land-use watershed (containing both grassland and cropland subwatersheds) exhibited a statistical difference @ = 0.05) between the predicted and measured sediment yields. Even here, the predicted and measured means, 58 and 74 kg/ha/event, respectively, were fairly close. Therefore, when viewed in light of the wide range of land uses and conditions involved, the general utility of MUSLE is considered good.
While knowledge of sediment yield on an event basis is necessary from a water quality/ environmental modeling standpoint, annual
Table 2. Measured and predicted runoff and sediment yields for Texas Blackland Prxirie grasslandsl.
Annual runoff Annual sediment yield
Period of Mean Std. Dev. Mean Std. Dev.
Watershed record Meas. Pred Meas. Pred. Meas. Pred. Meas. Pred.
SW-I I 77-80 IS l? 14 12 1330 kg/ ha 1110 930 820
WI0 76-80 25 26 13 13 82 82 98 44
Y14 77-80 20 24 14 16 820 1040 Ill0 1810
‘Predictions from EPIC Model (Williams, et al., 1982).
t
o Grassland /’
X Grassland to Wheatland ./ / I 0 Mixed land
(Grossland and Cropland)
z\
I
0 Cropland = -a25 1000 ?
MEASURED MEAN ANNUAL SEDIMENT YIELD (kg/ha)
Fig. 1. A comparison of the MUSLEpredictedandactual measuredmean annrurl sediment yields for the warersheds.
sediment yields are often desired from a land management/ conser- vation planning standpoint. Figure. 1 is a plot of the mean annual MUSLE predicted and the actual measured sediment yields for the various watersheds. Mean annual measured sediment yields ranged from 10 kg/ ha for the NG, HP grassland watershed to 3,700 kg/ ha for the YIO, BP cropland watershed. In general, MUSLE per- formed satisfactorily for all the watershed types, with the good fit between mean annual predicted and measured sediment yields for the grasslands particularly evident. In view of the fact that the Soil Conservation Service tolerable annual soil loss limits for the RRP grasslands and other watersheds are 5,550 and 11,100 kg/ ha, respectively’, none of the watersheds posed serious erosion prob- lems during the study periods (3 to 5 years). This encouraging piece of information should be tempered, however, by the statement that the grassland watersheds were all in good condition prior to initia- tion of the study, and the cropland watersheds were farmed accord- ing to recommended practice.
The test results in the present study were made using measured runoff volumes and peak runoff rates. In general practice, how- ever, such information is not available. In these cases MUSLE may be linked with hydrologic simulation models (Williams and Berndt 1977) to provide estimates of (Qqp) in Eq. (I). As
Tolerable annual soil losses. File copy received 1981, SCS, Stillwater, Okla.
an example, MUSLE was combined with several other hydrologic components to form the EPIC (Erosion-Productivity Impact Cal- culator) model (Williams et al. 1982). Preliminary results (Table 2) using an estimated (Qqp) term from the EPIC model are encourag- ing.
Overall, the results of this study leave little doubt that MUSLE can be a useful tool for predicting sediment yields from grassland watersheds in major land resource areas of the Southern Plains. Moreover, results with the mixed land-use watersheds (containing both grassland and cropland subwatersheds) support the view (Williams 1981) that MUSLE has utility on a multiple as well as individual watershed basis. Consequently, MUSLE may have application to larger, basin-scale, land areas.
Literature Cited
Cooley, K.R., and J.R. Williams. 1983. Applicability of the USLE and MUSLE to Hawaiian Agricultural Lands. In: Proc. Internat. Conf. on Soil Erosion and Conservation, Honolulu, Hawaii.
DeCoursey, D.&and W.M. Snyder. 1969. Computer-oriented method of optimizing hydrologic model parameters. J. Hydrology 9:34-56.
Sedimentation Task Committee. 1970. Sedimentation engineering, Chap. IV. Sediment sources and sediment yields. Proc. Amer. Sot. Civil Engr. 96 (HY6):1283-1329.
Sherpley, A.N., SJ. Smith, and R.G. Menzel. 1982. Prediction of phos- phorus losses in runoff from Southern Plains watersheds. J. Environ. Qual. 11:247-251.
Smith, SJ., R.G. Menzel, E.D. Rhoades, J.R. Williams, and H.V. Eck. 1983. Nutrient and sediment discharge from Southern Plains grasslands. J. Range Manage. (Accepted for publication).
Snedecor, G.W. 1956. Statistical Methods, 5th Ed. Iowa State Univ. Press, Ames.
Soil Conservation Service. 1981. Land resource regions and major land resource areas of the United States. USDA , Agr. Handbook 296, Washington, D.C.
Williams, J.R. 1975. Sediment-yield prediction with Universal Equation using runoff energy factor. p. 244-252. In: Present and Prospective Technology for Predicting Sediment Yield and Sources. U.S. Dep. Agr. ARS-S40.
Williams, J.R. 1981.Testing the modified Universal Soil Loss Equation. p. 157-164. In: Estimating Erosion and Sediment Yield on Rangelands. USDA. ARM-W-26.
Williams, J.R., and H.D. Berndt. 1977. Sediment yield prediction based on watershed hydrology. Trans. Amer. Sot. Agr. Eng. 20:1100-l 104.
Willlams, J.R., P.T. Dyke, and CA. Jones. 1982. EPIC-A model for assessing the effects of erosion on soil productivity. In: Proc. Third Int. Conf. on State-of-the-Art in Ecological Modeling, Fort Collins, CO.
Wischmeier, W.H. and D.D. Smith. 1960. A universal soil-loss equation to guide conservation farm planning. 7th Int. Cong. Soil Sci. Trans.
1:418-425.
Wischmeier, W.H. and D.D. Smith. 1978. Predicting rainfall erosion losses. U.S. Dep. Agr., Sci. Ed. Admin., Agr. Handbook 537. Washing- ton, D.C.
Soil and Nitrogen Loss from Oregon Lands
Occupied by Three Subspecies of Big Sage-
w w
brush
SHERMAN R. SWANSON AND JOHN C. BUCKHOUSE
Abstract
Measurements of runoff and soil loss from simulated high- intensity rainstorms are reported for shrub interspaces of 3 sites occupied by each of 3 subspecies of Artemisia tnihhztu (big sagebrush) in each of 4 locations in eastern Oregon. A. tridentrrto
ssp. wyomihgensis sites as a group had signlflcantly higher soil loss than A. LridcnteCo ssp. vaseyona sites. Comparisons of means
within locations showed nonsignificant differences between land supporting big sagebrush subspecies except at Frenchglen. Soil loss was positively correlated with runoff, percent bare ground, and vesicular soil porosity; but it was negatively correlated with medium and coarse sand and coarse fragments in the surface soil and with organic ground cover. Aridisols lost more soil than Mollisols. Habitat types did not appear useful for indexing soil loss from these sites. Surface soil morphology, however, correlated with large significant differences in soil loss and may be a useful index. Organic and ammonium nitrogen loss was not correlated with a subspecies of A. tridenlatu, but did correlate with soil erosion and many of the soil features that affect soil erosion. Amounts of nitrogen lost do not appear to be critical.
Soil loss rates under natural conditions are among the highest for semiarid shrublands (Branson 1975). Osborn et al. (1978) found as much as IO times greater sediment yields from brush-covered watersheds than from grass-covered watersheds. Buckhouse and Gaither (1982) measured potential soil losses of 43 1 kg per hectare for grassland ecosystems and 1,284 kg per hectare for sagebrush
(Artemisia species) ecosystems in central Oregon.
Big sagebrush (A. tridentatal) is widespread, once occupying 145 million acres in western North America (Beetle 1960). Sage- brush ecosystems are also very diverse, suggesting a finer classifica- tion is needed, such as the habitat types of Daubenmire (1968) for improved management of western watersheds (Pfister 1981). In recent decades, improvement in sagebrush taxonomy has enabled identification of 3 subspecies of A. tridentata, each with distinct plant morphology and ecological requirements. Tisdale and Hiro- naka (1981) stressed the value of these subspecies in synecology and used them in classification by habitat type.
A. tridentata ssp. wyomingensis (Wyoming big sagebrush) dom- inates the most arid habitats of the 3 big sagebrush subspecies. It generally occurs below 1,800 m on moderately deep, well-drained soils which may be slightly calcareous near the surface. Because these sites are xeric and more easily degraded, a high percentage of them are in low ecological condition (Winward 198 1). A. tridentata
ssp. tridentata (basin big sagebrush) is a good indicator of poten- tially arable land because it occupies deep, well-drained soils. A. tridentata ssp. vaseyana (mountain big sagebrush) resides in the upper foothill to mountain areas. It occupies deep, well-drained soils with moisture available most of the summer (Winward 1980).
In Idaho, Hironakaand Fosberg( 1979) found A. tridentata ssp.
wyomingensis primarily on Aridisols (mostly Camborthids), A.
huthors are Extension range specialist, Range, Wildlife, and Forestry Department, Umversity of Nevada, Rena 895 12 and associate professor, Department of Rangeland Rcsourccs, Oregon State University, Corvallis 9733 I.
Research was supported through funding provided by USDA Agricultural Research Service and the Eastern Oregon Agricultural Research Center. This article was submitted as Technical Paper No. 6752, Oregon Agricultural Experiment Station, Corvallis.
Manuscript received April 1 I, 1983.
298
tridentata ssp. vaseyana entirely on Mollisols (Cryborolls), and A. tridentata ssp. tridentata or a combination of these soil orders.
Plant growth is often stimulated by additions of nitrogen, espe- cially when there is ample soil moisture (Sneva and Hyder 1965, Wallace et al. 1978) which allows the fertilized plants to use soil nitrogen more efficiently (James and Jurinak 1978). Most ecosys- tem nitrogen is tied up in soils (West and Klemmedson 1978). It is concentrated near the surface (Charley 1977) and is associated with clays and fine soil particles (Bremmer 1965, Chichester 1969, Swift and Posner 1972) and especially with organic matter (Nishita and Haug 1973, Swift and Posner 1972, and Nagi 1980). Being near the surface and associated with erodible material, it is susceptible to erosional loss (Fletcher et al. 1978). Although organic nitrogen is chemically unavailable for plant uptake, it does constitute the largest portion of the soil reserves, especially at and near the soil surface (West and Skujins 1978).
This research was undertaken to assess the capacity of big sage- brush subspecies to indicate differences in potential soil loss, organic and ammonium nitrogen loss, and runoff. These erosion parameters were related to other site factors, including soil classifi- cation, surface soil morphology, soil texture, organic matter, and ground cover of vegetation and litter.
Study Area and Methods
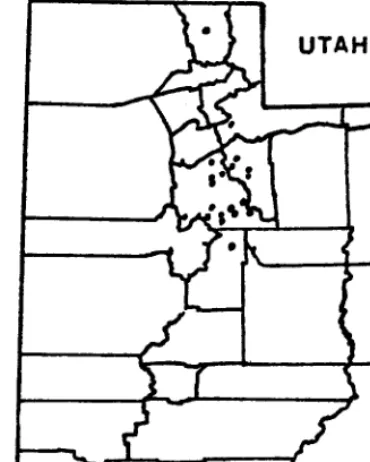
Four widely spaced study locations (Millican, Squaw Butte, Frenchglen, and Baker) were selected in 3 of the major geomorphic divisions of Oregon (High Lava Plains, Basin-Range, and Blue Mountains), At each location, 3 sites for each of 3 big sagebrush subspecies were studied, totaling 36 sites. Each site was located in a relatively homogeneous stand, representative of a common habitat type.
Rainfall simulation to initiate soil loss was done with a Rocky Mountain infiltrometer (Dortignac 1951). Sites were selected to be on slightly sloping terrain near a road and free enough of large surface soil stones that plot selection would not be unduly con- strained. All but one of the A. tridentata ssp. wyomingensis sites were on Aridisols and all the A. tridentata ssp. vaseyana sites were on Mollisols. The lone A. tridentata ssp. wyomingensis site on a Mollisol was located very close to an A. tridentata ssp. vaseyana
site;, neither site represented a large homogeneous area. A. triden- tata ssp. tridentata sites were about evenly divided between Mol- lisol and Aridisol soil orders.
Before mid-July in 1980, herbaceous vegetation data were col- lected from 3 frequency transects of IO 30 X 6l-cm plots each. Shrub density was determined with 3 I X30-m strip plots; canopy cover was estimated with 3 30-m line-intercepts (Pieper 1978). Following vegetation analysis, soils were described and classified (Soil Conservation Service 1975). Samples were analyzed in the laboratory for bulk density (Blake 1965), particle size distribution, and organic matter (Walkley and Black 1934).
In the summer of 198 1 a set of 3 “F” type rainfall simulators were used to produce a high intensity (12.6 cm hr-‘), short duration (28 minutes) rainfall. This simulation should be considered as an index of potential rainfall because storms of this magnitude have a return
epipedon of Mollisols is influential in promoting distinct soil struc- ture which aids infiltration, and in forming soil aggregates which are less easily eroded. In addition, higher organic matter may indicate greater plant growth which also protects the soil. Organic ground cover averaged 62% on Mollisols and significantly less, 35%, on Aridisols.
6000
5000
Characteristics of the site which appear related to soil erosion can be grouped into 3 categories: soil morphology, soil cover, and soil texture. Soil morphology is not suitable for correlation analy- sis and is discussed below. Of the soil-surface and surface-soil variables, percent bare ground was most highly correlated with soil loss (r = .49); however, percent organic ground cover was highly inversely related (r = -.94) to percent bare ground and it was selective as the principal variable in multiple correlation analysis. The amount of medium and coarse sand in surface soil was the variable next most highly correlated with soil loss (r = -.41). However, 2 other particle size classes-clay and silt-and the amount of coarse fragments in surface soil were selected next in stepwise multiple linear correlation analysis (Table 2). Surface soil
_ 4000 t,
Porosity not
7 vesicular
f \
ol
y 3000 v) :: E 2000
1000
Table 2. Correl8tion analysis of soil surfwe and surf8ccsoil fmtors in 633 subplots with total soil loss in central md erstern Oregon.
Stepwise
Site Factor multiple Rz
Organic ground cover .20**
Clay .39**
Coarse fragments .42**
Silt .475’
Bare ground
Medium and coarse sand (.25-2. mm)
Bulk density Organic matter Fine sand (.05-.25 mm)
**Indicates significance at the .OI level of probability.
Simple r -.45**
.30** -.19**
.23** .49*+ -.41**
.22** -.19**
.05
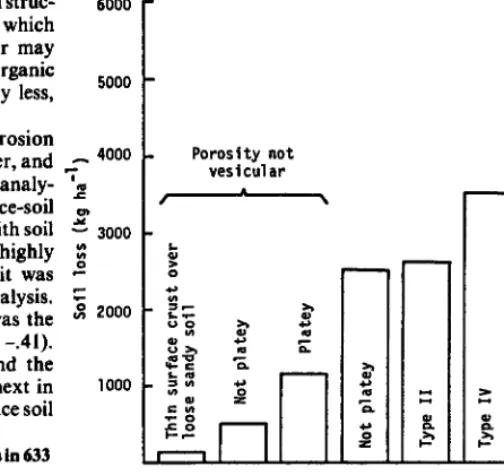
Fig. 2. Surface soil morphology and soil loss. There is no signtpcant difference @robability = 0.1) between bars over any one line. Types II. III and IV were described by Eckert et al. (1978).
intercoppice microplains and has larger polygons with a flat top. Type IV has an almost unbroken flat surface with thin irregular cracks. All 3 types have platey structure, but vesicular pores are larger and well developed in Type III and especially in Type IV.
bulk density and organic matter were also significantly correlated with soil loss, but less so (r = .22 and -.19, respectively).
Numerous studies have shown organic ground cover is critical in erosion control (Branson et al. 1981) because it breaks the impact of falling raindrops and forms sediment traps on the soil surface. Coarse fragments on the soil surface can have a similar effect (Eckert et al. 1978).
Vesicular porosity is indicative of unstable soil structure that is easily deformed by trapped air. Vesicular soil horizons are gener- ally high in silt content, low in organic matter, and poorly aggre- gated (Miller 1971 and Blackburn 1975). Instability leads to easy displacement by falling raindrops, which may lead to clogging of surface pores and reduced infiltration as observed in this study and in the work of Blackburn (1975) and Eckert et al. (1978).
Yariv’s model (1976) predicts loss of medium and coarse sand- size particles on the basis of the high hydration energies of the minerals in smaller particles and the larger mass of larger particles The correlation of clay and silt with soil loss is in relation to the particle size distribution of the soil, not of the sediment. The correlation may reflect the rapid infiltration on sandy soils. Rapid infiltration decreases erosion both by decreasing water available for runoff and by decreasing the probability of detachment of soil particles since the surface tension and viscosity of the soil water mixture at the soil surface is greater (Yariv 1976).
Five of the Millican sites had a surticial deposit of tephra, a lithologic discontinuity that is different from other sites. There- fore, stepwise multiple linear correlation was repeated with these sites omitted. In that analysis, bare ground accounted for 32% of the variability in soil loss, again emphasizing the importance of ground cover. Coarse fragments in the surface soil increased the multiple coefficient of determination only slightly.
The correlation of soil loss to bulk density and organic matter also relates indirectly to the correlation of soil loss to soil morphol- ogy. Soil organic matter promotes soil aggregation and reduced bulk density (Wooldridge 1964) typical of soils with crumb struc- ture. Low soil organic matter was probably not more strongly related to soil loss in this study because it is characteristic of both arid sites which may have erosive silty soils and of sandy soils which may be nonerosive due to a high infiltration rate. Bulk density is probably not more strongly correlated with soil loss in this study because low bulk density is characteristic of both erosive soils with vesicular porosity and nonerosive soils with well aggre- gated crumb structure.
Morphology of the surface soil was perhaps the dominant influ- ence on soil loss (Fig. 2). Both vesicular porosity and platey struc- ture were associated with increased soil loss. Eckert et al. (1978) described 4 types of surface soil morphology and their microtopo- graphic position. Three of the 4 types occurred in plots of this study. Type II is found on slope and coppice bench positions, has a very irregular surface, and deep, well-developed cracks separating polygons that are 5 to 8 cm in diameter. Type III is found on
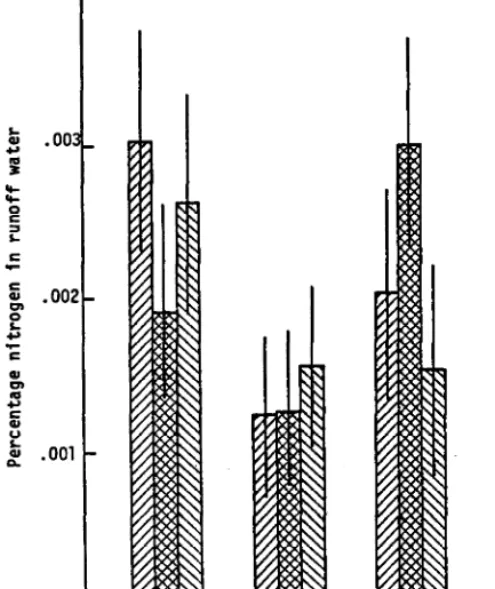
Organic and ammonium nitrogen loss shows a similar pattern to soil loss (Fig. 3). However, no differences among subspecies in percentage nitrogen in the runoff water apply across all locations. At Frenchglan, A. tridentata ssp. wyomingensis sites lost more nitrogen than A. tridentatu ssp. vuseyunu sites. Similarity to soil loss data is illustrated by the significant correlation (rz = 55) between sediment concentration and nitrogen concentration in runoff water.
A stepwise multiple correlation of soil-surface and surface-soil factors with organic and ammonium nitrogen concentration in runoff water indicated the importance of medium and coarse sand as well as organic ground cover, coarse fragments, and clay-all factors primarily influencing soil loss (Table 3). Results in the 2 multiple correlations, soil loss and nitrogen loss, are very similar except that the simple coefficient of correlation for organic ground