Available Online atwww.ijcsmc.com
International Journal of Computer Science and Mobile Computing
A Monthly Journal of Computer Science and Information Technology
ISSN 2320–088X
IMPACT FACTOR: 6.017IJCSMC, Vol. 6, Issue. 6, June 2017, pg.41 – 47
Statically Analysis on Big Data Using R
Programming & SVM
Anshul Jatain
1, Amit Ranjan
2 Research Scholar1, Assistant Professor21,2
Department of Computer Science & Engineering, Om Group of Institutions (Hisar, Haryana)
Abstract:- Over the past decade, big data analysis has seen an exponential growth and will certainly continue to witness spectacular developments due to the emergence of new interactive multimedia applications and highly integrated systems driven by the rapid growth in information services and microelectronic devices. So far, most of the current mobile systems are mainly targeted to voice communications with low transmission rates. In the near future, however, big data access at high transmission rates will be. This is a review on accessible big-data systems that include a set of tools and technique to load, extract, and improve dissimilar data while leveraging the immensely parallel processing power to perform complex transformations and analysis. “Big-Data” system faces a series of technical challenges.
Keywords: - Big Data, SVM, IDC, NIST, Big Data, EMC.
I. INTRODUCTION
Owing to the uniqueness of “Big Data”, designing a large scale [10]“Big-Data” system faces a series of technical challenges, including:
First, due to the large variety of different data sources and the huge volume, it is too difficult to collect, integrate and analysis of “Big Data” with scalability from scattered locations.
Second“Big Data” systems need to manage, store and integrate the gathered large and variedverity of datasets, while provide function and performance assurance [1], in terms of fast retrieval, scalability and secrecy protection.
Third “Big Data” analytics must effectively excavationlarge datasets at different levels in realtime or near realtime - including modeling, visualization [2], prediction and optimization - such that inherent potentials can be revealed to improve decision making and acquire further advantages.
To address these challenges, the researcherIT industry and community has given various solutions for “Big Data” science systems in an ad-hoc manner. Cloud computing can be called as the substructure layer for “Big Data” systems to meet certain substructure requirements, such as cost-effectiveness, resistance[2], and the ability to scale up or down. Distributed file systems and No SQL databases are suitable for persistent storage and the management of massive scheme free datasets [1]. Map Reduce, R is a programming framework, has achieved great success in processing “Big Data” group-aggregation tasks, such as website ranking [10]. Hadoop integrates data storage, data processing, system management, and other modules to form a powerful system-level solution, which is becoming the mainstay in handling “Big Data” challenges. We can build various “Big Data” application system based on these innovative technologies and platforms. In light of the of big-data technologies, a systematic frame work should be in order to capture the fast evolution of big-data research.
BIG DATA:DEFINITION,HISTORY AND PARADIGMS
Definition: Fundamentally, “Big Data” science means not only a large volume of data but also other features that distinguish it from the concepts of „„massive data‟‟ and „„very large data‟‟ [1], [2]. In fact, several definitions for “Big Data” are found in the literature, and three types of dentition play an important role in shaping how “Big Data” is viewed: [4]
1)Attributive Definition: IDC is a pioneer in studying “Big Data”science and its impact. It defines “Big Data” in a 2011 report that was sponsored by EMC (the cloud computing leader): „„Big data technologies describe a new generation of technologies and architectures [1], designed to frugally extract value from very huge volumes of extensive variety of data, by enabling high-velocity capture, discovery or analysis.‟‟
2)Comparative Dentition: In 2011, McKinney‟s report denned “Big Data” as „„datasets whose size is beyond the ability of typical database software tools to capture, store, manage, and analyze [1]‟‟.
3)Architectural Definition: The National Institute of Standards and Technology (NIST) suggests that, „„“Big Data” is where the
data volume, acquisition velocity, or data representation limits the ability to perform effective analysis using traditional relational approaches or requires the use of significant horizontal[5] scaling for efficient processing.‟‟
TABLE 1
ABRIEF HISTORY OF BIG DATA
TRADITIONAL
DATA BIG DATA
VOLUME GB
CONSTANTLY UPDATED (TB
OR PB)
Generated Rate Per hour, day, More rapid
Structure Structured Semi- structured
or un-structured
Data Source Centralized fully distributed
Data Integration Easy Difficult
Considering the growth and intricacy of “Big Data”science systems, previous descriptions are based on a one-sided view point, such as chronology or milepost technologies. The history of “Big Data” is presented in terms of the data size of interest. Under this framework, the history of “Big Data” is tied closely to the capability of efficiently storing and managing larger datasets, with size boundaries expanding by orders of degree.
1)Megabyte to Gigabyte: In the 1970s and 1980s, historical business data introduced the earliest “Big Data” challenge in moving from megabyte to gigabyte sizes. [18]
2)Gigabyte to Terabyte: In the late 1980s, the popularization of digital technology caused data volumes to expand to several gigabytes or even a terabyte, which is beyond the storage and/or processing capabilities of a single large computer system [2]. Data parallelization was proposed to extend storage capabilities and to improve performance by distributing data and related tasks, such as building indexes and evaluating queries, into disparate hardware.
3)Terabyte to Petabyte: During the late 1990s, when the database community was admiring its „„finished‟‟ work on the parallel
database, the rapid development of Web 1.0 led the whole world into the Internet era[2], along with massive semi-structured or unstructured web pages holding terabytes or petabytes (PBs) of data.
II. BIG DATA PROBLEM AND CHALLENGES
However, considering variety of data sets in “Big Data” problems, it is still a big challenge for us to purpose efficient representation, access, and analysis of shapeless or semi-structured data in the further researches [12]. How can the data be preprocessed in order to improve the quality of data and analysis results before we begin data analysis [1] [2]? As the sizes of dataset are often very large, sometimes several gigabytes or more, and their origin from varied sources, current real-world databases are pitilessly susceptible to inconsistent, incomplete, and noisy data. Therefore, a number of data preprocessing techniques, including data cleaning [11], data integration, data transformation and date reduction, can be applied to remove noise and correct irregularities. Different challenges arise in each sub-process when it comes to data-driven applications.
III. PRINCIPLES FOR DESIGNING BIG DATA SYSTEM
In designing “Big Data” analytics systems, we summarize seven necessary principles to guide the development of this kind of burning issues [3]. “Big Data” analytics in a highly distributed system cannot be achievable without the following principles [13]:
1)Good architectures and frameworks are necessary and on the top priority. 2)Support a variety of analytical methods
3)No size fits all
4)Bring the analysis to data
5)Processing must be distributable for in-memory computation. 6)Data storage must be distributable for in-memory storage. 7)Coordination is needed between processing and data units.
BIG DATA OPPORTUNITIES
The bonds between “Big Data” and knowledge hidden in it are highly crucial in all areas of national priority. This initiative will also lay the groundwork for complementary “Big Data” activities, such as “Big Data”substructure projects, platforms development, and techniques in settling complex, data-driven problems in sciences and engineering. Researchers, policy and decision makers have to recognize the potential of harnessing “Big Data” to uncover the next wave of growth in their fields. There are many advantages in business section that can be obtained through harnessing “Big Data” increasing operational efficiency, informing strategic direction, developing better customer service, identifying and developing new products and services, identifying new customers and markets, etc.
BIG DATA ANALYSIS
PURPOSE AND CATEGORIES
Data analytics addresses information obtained through comment, measurement, or tests about a phenomenon of interest. The following lists only a few potential purposes:
1) To generalize and deduce the data and determine how to use it.
2) To check whether the data are genuine.
3) To give guidance and contributionin decision making system.
4) To identify and conclude reasons for fault.
5) To forecast what will occur in the future.
Descriptive Analytics: exploits historical data to describe what occurred in past. For instance, a regression technique may be used to find simple trends in the datasets, visualization presents data in a meaningful fashion, and data modeling is used to collect, store and cut the data in an efficient way. Descriptive analytics is typically associated with business intelligence or visibility systems [2].
Predictive Analytics: focuses on predicting future probabilities and trends. For example, predictive modeling uses statistical techniques [6] such as linear and logistic regression to understand trends and predict future out-comes, and data mining extracts patterns to provide insight and forecasts [4].
Prescriptive Analytics: addresses decision making and efficiency. For example, simulation is used to analyze complex systems to gain insight into system performance and identify issues and optimization techniques are used to find best solutions under given constraints.
IV. BIG DATA CLASSIFICATION ALGORITHM There are three algorithms:-
1)Decision Tree
2)Random Forest
3)Support Vector Machine
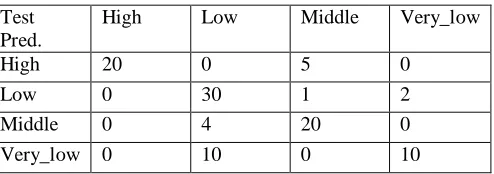
Decision tree learning uses a decision tree as a predictive model which maps observations about an item to conclusions about the item's target value. It is one of the predictive modelling approaches used in statistics, data mining and machine learning. Tree models where the target variable can take a finite set of values are called classification trees. In these tree structures, leavesrepresent class labels and branches represent conjunctions of features that lead to those class labels. Decision trees where the target variable can take continuous values are called regression trees.In decision analysis, a decision tree can be used to visually and explicitly represent decisions and decision making. In data mining, a decision tree describes data but not decisions; rather the resulting classification tree can be an input for decision making [23].
Confusion matrix - Decision Tree (Predict on Test Data)
Table 2
Test Pred.
High Low Middle Very_low
High 20 0 5 0
Low 0 30 1 2
Middle 0 4 20 0
Very_low 0 10 0 10
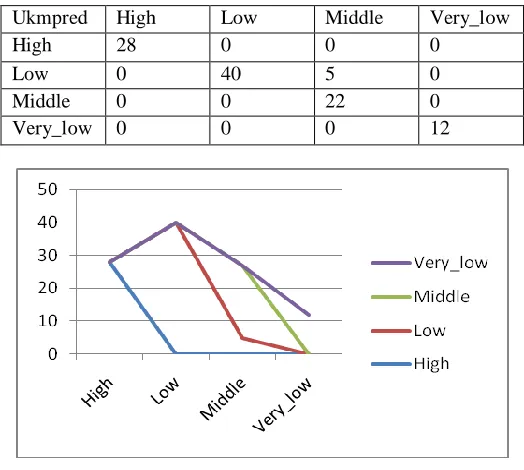
Confusion matrix -Random Forest (Predict on Test Data)
Table 3
Ukmpred High Low Middle Very_low
High 28 0 0 0
Low 0 40 5 0
Middle 0 0 22 0
Very_low 0 0 0 12
FIGURE 1 Predict on Test Data Random Force
Support Vector Machines (SVMs) is supervised learning methods used for classification and regression tasks that originated from statistical learning theory. As a classification method, SVM is a global classification model that generates non-overlapping partitions and usually employs all attributes. The entity space is partitioned in a single pass, so that flat and linear partitions are generated. SVMs are based on maximum margin linear discriminants, and are similar to probabilistic approaches, but do not consider the dependencies among attributes.
Traditional Neural Network approaches have suffered difficulties with generalization, producing models which overfit the data as a consequence of the optimization algorithms used for parameter selection and the statistical measures used to select the best model. SVMs have been gaining popularity due to many attractive features and promising empirical performance. They are based on the Structural Risk Minimization (SRM) principle have shown to be superior to the traditional principle of Empirical Risk Minimization (ERM) employed by conventional Neural Networks. ERM minimizes the error on the training data, while SRM minimizes an upper bound on the expected risk. This gives SRM greater generalization ability, which is the goal in statistical learning. According to, SVMs rely on preprocessing the data to represent patterns in a high dimension, typically much higher than the original feature space. Data from two categories can always be separated by a hyperplane when an appropriate nonlinear mapping to a sufficiently high dimension is used.[25]
Confusion matrix - Support Vector Machine(Predict on Test Data) Table 4
Ukmpred High Low Middle Very_low
High 100 0 1 0
Low 0 125 4 5
Middle 1 1 110 0
FIGURE 2 Predict on Test Data on SVM BIG DATA TOOLS:TECHNIQUES AND TECHNOLOGIES
To capture the value from “Big Data”, we need to develop new techniques and technologies for analyzing it. Until now, scientists have developed a wide variety of techniques and technologies to capture, curate, analyze and visualize Big Data. We need tools (platforms) to make sense of “Big Data”. Current tools concentrate on three classes, namely, batch processing tools, stream processing tools, and interactive analysis tools. Most batch processing tools are based on the Apache Hadoop infrastructure, such as Mapreduce [4], R Programming and Dryad. The interactive analysis processes the data in an interactive environment, allowing users to undertake their own analysis of information.
V. RPROGRAMMING
The R language is well established as the language for doing statistics, data analysis, data-mining algorithm development, stock trading, credit risk scoring, market basket analysis and all [9] manner of predictive analytics. However, given the deluge of data that must be processed and analyzed today, many organizations have been reticent about deploying R beyond research into production applications. [16]
VI. COMPARISONS OF CLASSIFICATION FOR BIG DATA SCIENCE
To apply different classification technique I have chosen a real dataset about the student‟s knowledge status about the subject of Electrical DC Machines. Distribution of every numeric variable can be checked with function summary (), which returns the minimum, maximum, mean, median, and the first (25%) and third (75%) quartiles. For factors (or categorical variables), it shows the frequency of every level.
I applied different data classification algorithms Decision Tree, Random Forest and SVM (Support Vector Machine). In these algorithm we have divided our data set into to two subset name Training Dataset and Test Dataset. In Different algorithm we h ave got different accuracy results are.
1)Decision Tree - 85.47%
2)Random Forest - 96.12%
3)SVM Model - 96.87%
So on the basis of result obtained using different classification result we can chose any algorithm according our requirement to analysis “Big Data”. Here as result shown analysis on User Knowledge Modeling Data Set SVM Model provides best result.
VII. CONCLUSION
REFERENCES
[1] C.L. Philip Chen, Chun-Yang Zhang, “Data intensive applications, challenges, techniques and technologies: A survey on Big Data” Information Science0020-0255 (2014), PP 341-347, elsevier
[2] Han hu1At. Al. (Fellow, IEEE),” Toward Scalable Systems for Big Data Analytics: A Technology Tutorial”, IEEE2169-3536(2014), PP 652-687
[3] Shweta Pandey, Dr.VrindaTokekar,” Prominence of Map Reduce in BIG DATA Processing”, IEEE (Fourth International Conference on Communication Systems and Network Technologies)978-1-4799-3070-8/14, PP 555-560
[4] Katarina Grolinger At. Al.“Challenges for Map Reduce in Big Data”, IEEE (10th World Congress on Services)978-1-4799-5069-0/14,PP 182-189 [5] Zhen Jia1 At. Al.“Characterizing and Sub setting Big Data Workloads", IEEE 978-1-4799-6454-3/14, PP 191-201
[6] Avita Katal, Mohammad Wazid, R H Goudar, “Big Data: Issues, Challenges, Tools and Good Practices”, IEEE978-1-4799-0192-0/13,PP 404-409 [7] Du Zhang,”Inconsistencies in Big Data”, IEEE978-1-4799-0783-0/13, PP 61-67
[8] Zibin Zheng, Jieming Zhu, and Michael R. Lyu, “Service-generated Big Data and Big Data-as-a-Service: An Overview”, IEEE (International Congress on Big Data) 978-0-7695-5006-0/13, PP 403-410
[9] Vignesh Prajapati, Big Data Analytics with R and Hadoop Packt Publishing
[10] Lei Wang At. Al., “BigDataBench: aBigDataBenchmarkSuitefromInternetServices”,IEEE 978-1-4799-3097-5/14.
[11] Anirudh Kadadi At. Al., “Challenges of Data Integration and Interoperability in Big Data”, IEEE (International Conference on Big Data)978-1-4799-5666-1/14, PP 38-40
[12] SAS, Five big data challenges and how to overcome them with visual analytics
[13] Hajar Mousanif At. Al., “From Big Data to Big Projects: a Step-by-step Roadmap”, IEEE (International Conference on Future Internet of Things and Cloud) 978-1-4799-4357-9/14, PP 373-378
[14] Tianbo Lu At. Al., “Next Big Thing in Big Data: The Security of the ICT Supply Chain”, IEEE (Social Com/PASSAT/Big Data/Econ Com/Bio Med Com) 978-0-7695-5137-1/13, PP 1066-1073
[15] Ganapathy Mani, Nima Barit, Duoduo Liao, Simon Berkovich, “Organization of Knowledge Extraction from Big Data Systems”, IEEE (4 Fifth International Conference on Computing for Geospatial Research and Application) 978-1-4799-4321-0/14, PP 63-69
[16] Joseph Rickert, “Big Data Analysis with Revolution R Enterprise”, 2011
[17] Carson Kai-Sang Leung, Richard Kyle MacKinnon, Fan Jiang, “Reducing the Search Space for Big Data Mining for Interesting Patterns from Uncertain Data”, IEEE 2014, PP 315-322
[18]Ajith Abraham1, Swagatam Das2, and Sandip Roy3, “Swarm Intelligence Algorithms for Data Clustering”, PP 280-313
[19] Swagatam Das, Ajith Abraham, Senior Member, IEEE, and Amit Konar, “Automatic Clustering Using an Improved Differential Evolution Algorithm”, IEEE 2008, PP 218-237
[20] Karthik Kambatla, Giorgos Kollias, Vipin Kumar, Ananth Grama, “J. Parallel Distrib. Comput”, Elsevier 2014, PP 2561-2573 [21] Yanchang Zhao, “R and Data Mining: Examples and Case Studies”, www.RData Mining.com,2014
[22] H. T. Kahraman, Sagiroglu, S., Colak,“User Knowledge Modeling Data Set”,UCI,vol. 37, pp. 283-295, 2013 [23]Wikipedia,https://en.wikipedia.org/wiki/Decision_tree_learning