Available online:
https://edupediapublications.org/journals/index.php/IJR/
P a g e | 1905Design Analysis and Optimization of Idler Frame for
Conveyor Applications
K Naga Hanumaiah &
A Siva Naga Raju
21
M-Tech, MECH (CAD/CAM), Chinthalapudi Engineering College
2
Assistant professor, MECH, Chinthalapudi Engineering College
Abstract
Troughing idlers frames are used for conveying
bulk materials, and are designed and manufactured
with different Troughing angles. Design of idlers
and idlers frames are done as per CEMA
standards. Static and dynamic analyses are carried
out to evaluate the structural stability in terms of
strength. Design iterations are carried out to
optimize or minimize the material. The stresses
obtained from static analysis are below the
allowable limit and the fundamental frequency
obtained from the dynamic analysis is safe when
compared to operating frequency of the conveyor
belt.
1.1 SELECTION AND LOAD RATING OF THE IDLERS FOR BELT CONVEYORS
Selection of the bulk handling idlers is based on the idler load, generally on the center idler of a 3 -roll set.
Q = conveyor capacity (t/h)
v = belt speed (m/s)
G = belt weight (kg/m)
FT = total load of one idler set (N)
FQ = total load of center idler (N)
B = belt width (mm)
L = length of idler shell (mm)
D = idler diameter (mm)
d = shaft diameter (mm)
a = idler spacing (m)
a = troughing angle
þ = rolling angle of the material in motion
e = factor which takes into account the influence of the troughing angle on the load of centre idler (table 1)
c = factor which takes into account the influence of material particle size on the load of centre idler (table 2)
5.2 Calculation of idler load (center idler of 3 - roll set)
Q = 1300 t/h
v = 2.2 m/s
G = 20 kg/m
Available online:
https://edupediapublications.org/journals/index.php/IJR/
P a g e | 1906a = 1.2 m
α = 450
β = 300 (Coal)
Load for one idler set 𝐹𝑇
𝐹𝑇= [
𝑄
3.6 × 𝑣+ 𝐺] × 𝑎 × 10
𝐹𝑇= [
1300
3.6 × 2.2+ 20] × 1.2 × 10 = 2210 𝑁
Load of center idler 𝐹𝑄
𝐹𝑄 = 𝑒 × 𝑐 × 𝐹𝑇
e = 0.7 (Table 1)
c = 1.2 (Table 2)
𝐹𝑄 = 0.7 × 1.2 × 2210 = 1856 𝑁
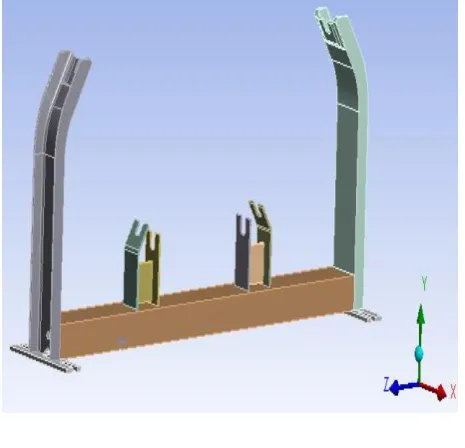
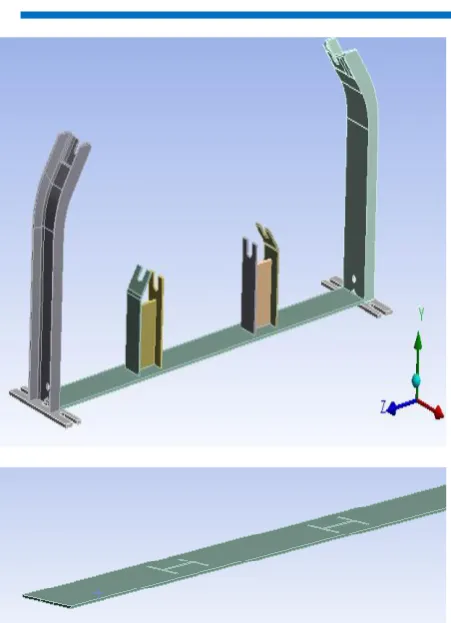
1.2 Geometry of Idler frame
In the present analysis four geometries are analysed and results are compared to select best optimized design. The different geometries are shown in the below figures.
Figure 1.3: Geometry 1 & Base frame design
Available online:
https://edupediapublications.org/journals/index.php/IJR/
P a g e | 1907Figure 1.5: Geometry 3 & Base frame design
Figure 1.6: Geometry 4 & Base frame design 1.7 Meshing. One of the most relevant steps in the Finite Element Analysis is the meshing. The speed
and the accuracy of the results have a direct connection in how this part is done. The higher the numbers of nodes are the higher the accuracy of the results, however the speed of the simulation decreases. Figure 5 shows how the mesh looks in ANSYS Mechanical.
Mesh diagram should be placed.
Fig 1.7: Mesh of the structure
1.8. Pre-processing. After meshing the structure, the Boundary Conditions have to be applied in the model. For obtaining the stress the algorithm first calculates the displacements, hence the necessity to fix the model. Furthermore, after fixing the model the load conditions that influence the structure are given as inputs to the analysis. In Figure 6 it is possible to observe how these boundary conditions are placed in the structure.
1.9Loads:
To observe maximum stress produce into idler frame, model is subjected to extreme conditions and static analysis is carried out in Ansys Workbench. idler frame was constraint at bottom of end support. Idler forces applied to idler frame.
Available online:
https://edupediapublications.org/journals/index.php/IJR/
P a g e | 1908Figure 1.11: Centre idler load on the structure
The above applied loads are repeated on the other geometries also.
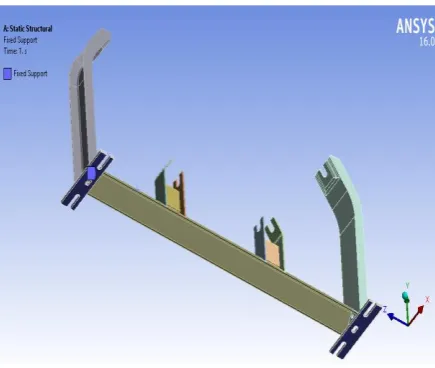
1.12 Boundary conditions:
Figure 1.13: Boundary condition on the structure
Fixed support applied on the bottom surface at the ends of the structure as shown in figure 5.8
Post processing. The final step is to run the simulations, but before it has to be specified which results are required by the user. In order to determine if the model can resist the loads applied to it, it is necessary to know, e. g. the Maximum Von Mises stress and the displacement. Knowing these results the user can compare with the data from the material used and applying the safety factor it can be determined if the structure is stiff enough. Another use is being able to extract the
results automatically for the possibility to optimize the structure.
2. RESULTS AND DISCUSSIONS 2.1ANALYSIS RESULTS
This chapter is intended for presenting the results obtained after learning the theories and applying the method described in the two previous chapters. It starts with the validation of the model.
GEOMETRY 1: RESULTS TOTAL DEFORMATION(MM)
Figure 2.1: Total deformation - True scale
Available online:
https://edupediapublications.org/journals/index.php/IJR/
P a g e | 1909VON MISES STRESS(MPA)
Figure 2.3: von Mises stress in the structure
The total deformation observed in the structure is 0.61mm. Maximum von Mises stress observed in the structure is 71MPa.
Figure 2.4: weight of the Geometry 1 GEOMETRY 2: RESULTS
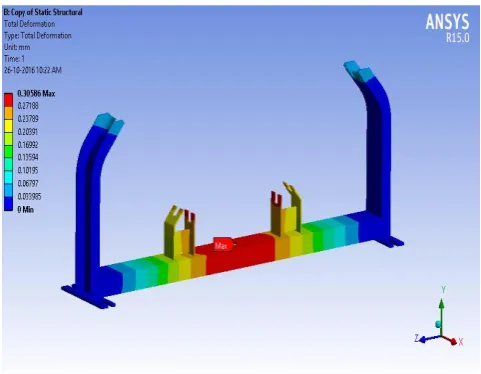
TOTAL DEFORMATION(MM)
Figure 2.5: Total deformation - True scale
Figure 2.6: Total deformation - Deformed scale VON MISES STRESS(MPA)
Available online:
https://edupediapublications.org/journals/index.php/IJR/
P a g e | 1910The total deformation observed in the structure is 0.30 mm. Maximum von Mises stress observed in the structure is 72MPa.
Figure 2.8: weight of the Geometry 2
GEOMETRY 3: RESULTS TOTAL DEFORMATION(MM)
Figure 2.9: Total deformation - True scale
Figure 2.10: Total deformation - Deformed scale
VON MISES STRESS (MPA)
Figure 2.11: von Mises stress in the structure
The total deformation observed in the structure is 68.4 mm. Maximum von Mises stress observed in the structure is 516MPa.
Figure 6.13: weight of the Geometry 3
Available online:
https://edupediapublications.org/journals/index.php/IJR/
P a g e | 1911Figure 3.1.2: Total deformation - True scale
Figure 3.2: Total deformation - Deformed scale
VON MISES STRESS(MPA)
Figure 3.3: von Mises stress in the structure
The total deformation observed in the structure is 0.15 mm. Maximum von Mises stress observed in the structure is 39.9MPa.
Figure 3.4: weight of the Geometry 4
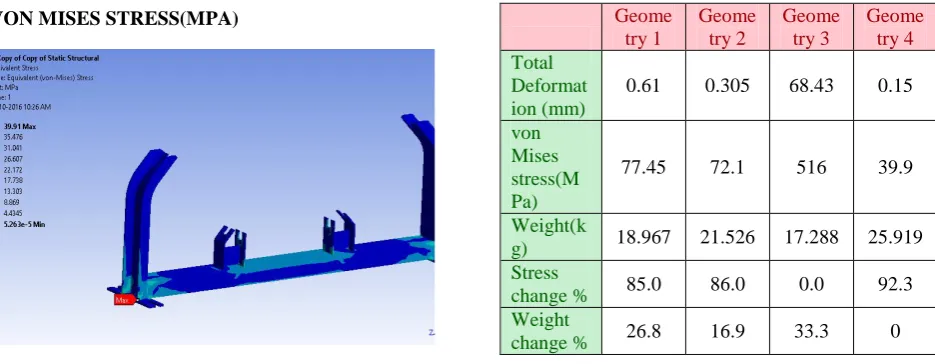
3.5 Results Summary
The analysis are done on the four different geometries by applying idler forces on the structure. The results are summarized in the below table. From the results it is observed that stresses and behaviour results are as expected and below the limits. The geometry 1 V shape channel results are better in weight and stress & deformation results as compare with other geometries of C channel, Plate & Tube channel frame designs.
4. CONCLUSION Geome try 1 Geome try 2 Geome try 3 Geome try 4 Total Deformat ion (mm)
0.61 0.305 68.43 0.15
von Mises stress(M Pa)
77.45 72.1 516 39.9
Weight(k
g) 18.967 21.526 17.288 25.919 Stress
change % 85.0 86.0 0.0 92.3
Weight
Available online:
https://edupediapublications.org/journals/index.php/IJR/
P a g e | 1912The idler frame is analysed with different base frame designs such as V shape, C shape, Plate and Tube types. stresses and behaviour results are as expected and below the limits. The geometry 1 V shape channel results are better in weight with 26 % in reduction as compare with higher value and stress of 85 % in reduction as compare with higher value & deformation results as compare with other geometries of C channel, Plate & Tube channel frame designs. V shape frame is also very easy to manufacture compare with tube and C shape channels.