International Journal of Research (IJR) Vol-1, Issue-8, September2014 ISSN 2348-6848
Change Detection in Land use / Land cover in Akola Taluka Using Remote Sensing and GIS
Change Detection in Land use / Land cover in Akola
Taluka Using Remote Sensing and GIS Technique
Chaitanya Pande
Department of Geoinformatics, shri shivaji collage, Akola-444001(MH)
Abstract:
In the present study of Akola Taluka is a part of Akola districts of Maharashtra, India. It covers an area of 1042.71sq. km. In Survey of India (SOI) topographic sheets (D/13, D/14, H/1, H/2, H/5, H/6 and 55-H/12,) of 1:50,000 scale. In study area is located in Akola Districts of Maharashtra which is located between 69°68′23” to 23°08’21” N latitude and 73°98’29’’ to 22°76’23’’ E longitude. For finding the status and extent of Changes in Murtizapur Taluka of Land use/ Land cover maps was prepared using remote sensing data. The Land use / Land Cover map during 1998 and 2013 was prepared using LISS-III and Land sat TM data The transformation of a particular land use/land cover categories into different categories were derived by spatial intersection of 1998-2013. The prepared maps were overlaid using GIS to obtain Change Detection maps to know the changes occurred in different land use classes during 1998-2013. The final maps were prepared after reconciliation of
doubtful areas observed in preliminary maps. The final maps were prepared/ composed and area statistics was generated using visual interpretation techniques and Arc Map 10.1 Software.
Keywords: Land use, Land covers, Change Detection, LISS-III Data, GIS, Remote Sensing.
1. Introduction
The population is increasing day by
day so the land use/land cover areas also
change. The land use/land cover pattern of
a region is an outcome of natural and
socio-economic factors and their
utilization by man in time and space. Land
is becoming scarce resource due to
immense agricultural and demographic
pressure. Hence, information on land use /
land cover and possibilities for their
optimal use is essential forthe selection,
planning and implementation of land use
schemes to meet the increasing demands
for basic human needs and welfare. This
information also assists in monitoring the
dynamics of land use resulting out of
changing demands of increasing
change has become a central component in
current strategies for managing natural
resources and monitoring environmental
changes. This involves development of
spatial and temporal database and analysis
techniques. The advancement in the
concept of vegetation mapping has greatly
increased research on land use/ land cover
change thus providing an accurate
evaluation of the spread and health of the
world’s forest, grassland, and agricultural
resources has become an important
priority. Viewing the Earth from space is
now crucial to the understanding of the
influence of man’s activities on his natural
resource base over time. In situations of
rapid and often unrecorded land use
change, observations of the earth from
space provide objective information of
human utilization of the landscape. Over
the past years, data from Earth sensing
satellites has become vital in mapping the
Earth’s features and infrastructures,
managing natural resources and studying
environmental change. Further, satellite
remote sensing data have been
successfully used to estimate Leaf Area
Index (LAI), based on the relationship
between LAI and the Normalized
Difference Vegetation Index (NDVI)
(Kale et al., 2005). An accurate forest
cover-type and/or land-classification
system is essential to providing
information for effective management of
natural resources (Schriever and Russell,
1995). The remote sensing technology in
integration with Geographical Information
System (GIS), helps in extracting
maximum amount of vegetal information
that describe vegetation diversity i.e.
extent, structure, composition and
condition. The availability of new
high-resolution satellite image sources e.g.,
IKONOS Provides an opportunity to map
ground features that was not previously
available using medium resolution
imagery (e.g. Landsat, SPOT 4). Remote
Sensing (RS) and Geographic Information
System (GIS) are now providing new tools
for advanced ecosystem management. The
collection of remotely sensed data
facilitates the synoptic analyses of Earth -
system function, patterning, and change at
local, regional and global scales over time;
such data also provide an important link
between intensive, localized ecological
research and regional, national and
international conservation and
management of biological diversity
(Wilkie and Finn, 1996).The present study
has been taken up in order to understand
the changes that have taken place in land
use/land cover in Murtizapur Taluka of
Akola district. Therefore, attempt will be
made in this study to map out the changes
International Journal of
Change Detection in Land use / Land cover in Akola Taluka Using Remote Sensing and GIS Murtizapur Taluka between 1998 and 2013
with a view to detecting the land
consumption rate and the changes that has
taken place in this status particularly in the
built-up land so as to predict possible
changes that might take place in this status
in the next 10 years using both Geographic
Information System and Remote Sensing
data.
India
Research (IJR) Vol-1, Issue-8, September2014 ISSN 2348
Change Detection in Land use / Land cover in Akola Taluka Using Remote Sensing and GIS 1998 and 2013
with a view to detecting the land
consumption rate and the changes that has
taken place in this status particularly in the
up land so as to predict possible
ce in this status
years using both Geographic
Information System and Remote Sensing
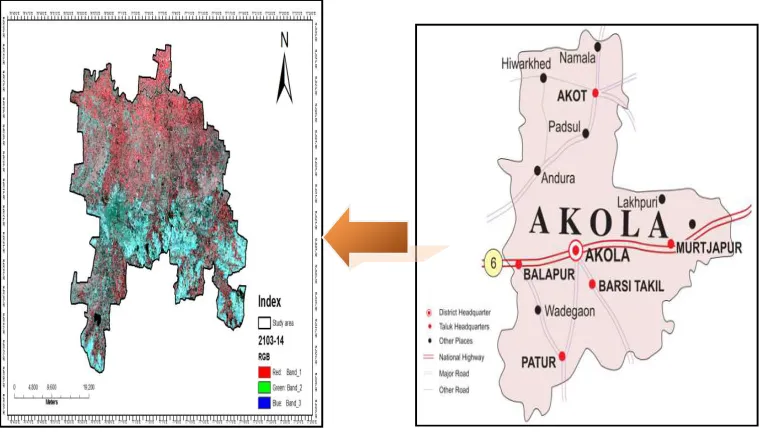
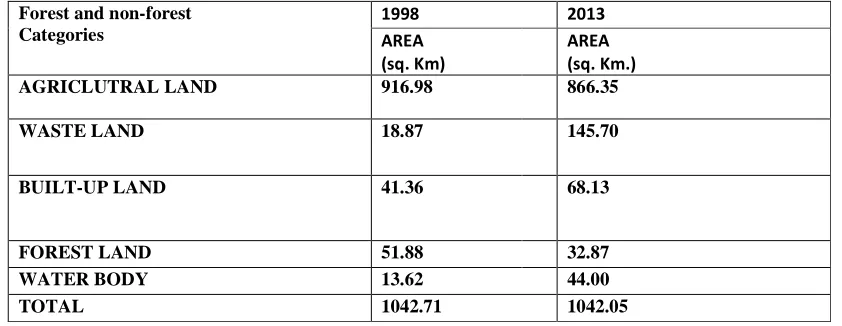
2. Study Area:-
The study area is situated in Akola
Districts of Maharashtra which is located
between 69°68′23” to 23°08’21
and 73°98’29’’ to 22°76’23’’ E longitude.
The study area is covered by Survey of
India (SOI) toposheets 55D/13, 55D/14,
55-H-1, 55-H-2, 55-H-5, 55-H
and on 1:50,000 scale.
Maharashtra State of India
ISSN 2348-6848Change Detection in Land use / Land cover in Akola Taluka Using Remote Sensing and GIS The study area is situated in Akola
Districts of Maharashtra which is located
21” N latitude
and 73°98’29’’ to 22°76’23’’ E longitude.
The study area is covered by Survey of
India (SOI) toposheets 55D/13, 55D/14,
H-6, 55-H-12
AkolaTaluka
Akola District
Figure 1. Location Map of Study Area
Methodology:-International Journal of Research (IJR) Vol-1, Issue-8, September2014 ISSN 2348-6848
Change Detection in Land use / Land cover in Akola Taluka Using Remote Sensing and GIS DATA SOURCE
DATA ACQUISITION RECONNAISANCE SURVEY
DATA ENHANCEMENT, PROCESSING AND INTEGRATION
INITIAL LAND USE /LAND COVER CLASSIFICATION
DEVELOPMENT OF A CLASSIFICATION SCHEME
GROUND TRUTHING
EDITING OF INITIALLAND USE/LAND COVER MAPS
FINAL PRODUCTION OF LAND USE/LAND COVER MAPS
CHANGE DETECTION ANALYSIS BASED ON LAND USE/LAND COVER MAP FOR EACH YEAR
CHANGE PREDICTION FOR PLANNING
Figure 2. Flow chart of Methodology
4. Data Products:-
The present study was based on primary
and secondary data sources.The study has made
use of various primary and secondary data. These
include Survey of India (SOI) topographic sheets
(D/13, D/14, H/1, H/2, H/5,
55-H/6 and 55-H/12,) of 1:50,000 scales; and satellite
images Landsat TM (geocoded data (for the year
2013). These (Landsat) data were visually and
Software (for processing, analysis and integration
of spatial data) to reach the objectives of the
study. Adequate field checks were made before
finalization of the thematic maps. The main goalof
this study is to extract land use and land cover
changes using multi- temporal satellite data.
Table 1. Data used of LULC Mapping
5. Visual Analysis:-
Visual interpretation technique was
used for the mapping of land use/land
cover. Prior to interpretation of multidate
satellite data, a reconnaissance survey
of the study area was done to develop
a classification scheme based on local
knowledge and ancillary information. An
interpretation key was also
developedbased on standard
Photo-elements like tone, texture, size, shape,
association, pattern, location etc. To
identify and map different classes. With
the help of interpretation key onscreen
preliminary interpretation of satellite data
was done using ARC GIS 10.1software.
6. Ground truth verification:-
Entire study area was visited to get
an acquaintance of different ground feature
and cover type with respect to satellite
data. The doubtful area on preliminary
interpreted maps from satellite data
were carefully verified in the field. After
verification, these areas were reconciled
on the maps and corrections were made to
create the final maps of study area.
7. Overlay analysis, Final Map
Preparationand Area statistics
Generation:-
Union method is applied for
Overlay analysis using ARC GIS 10.1
Software. The final maps were prepared
after reconciliation of doubtful areas
observed in preliminary maps. The final
maps was prepared/ composed and area
statistics was generated using Arc Map
10.1 Software.
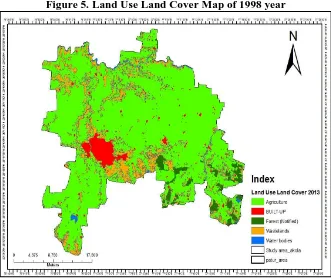
8.
Conclusion
:-In the present study land use/ land
cover map of study area for the years
1998, and 2013. In order to monitor the
changes in land use / land cover proper
care was taken in the selection of cloud
free temporal data. It was not possible S/N Data Type Date of
Production
Resolution Source
International Journal of Research (IJR) Vol-1, Issue-8, September2014 ISSN 2348-6848
Change Detection in Land use / Land cover in Akola Taluka Using Remote Sensing and GIS to obtain the ground truth pertaining to
older data of satellite image of Land sat
1998 therefore a novice approach to
overcome the same was followed.
Mapping was done for the year 2013 data.
The major land use / land cover categories
identified in the study area are Built-up,
Agricultural land, wasteland, Water Body
and Forest, their area extent are presented
in Table 1 and Fig 4, and 5 In general
major area was occupied by
Agricultural land followed by Wasteland
,Forest, built-up land and minimum by
Water Body. Built-up area identified in the
study area was mainly large city
settlements.The total area which was 41.36
sq. km. in 1998 increased to 68.13 sq. km.
In 2013 Agricultural land was observed
mainly on plain land and uplands and
accounted 916.98 and 866.35 sq. km.
during 1998 and 2013 respectively and
decrease in the area was 50.63 sq. km.
/year.
Wasteland was noticed on uplands
with or without scrub. The total wasteland
which was 18.87 and 145.70 sq. km. in
1998 and 2013 respectively and increases
in the area was increase 126.83 sq.km/
year.
Forests are mainly located on hilly
and upland areas. The total area during
1998 was 51.88 and 32.87 sq. km. which
decreased to 19.01 in 2013 respectively.
The forests were further classified into
Dense, Open and Scrub forests. As the
forest for the year 1998 was extracted from
SOI toposheet, it was not possible to
delineate further sub-classes. The area
covered by river was same during all the
years while area of reservoirs is 13.62 % in
1998 and increased -44.00 in 2013.
Table 1 Land Use and Land Cover Distribution (1998, 2013):-
Forest and non-forest Categories
1998 2013
AREA (sq. Km)
AREA (sq. Km.)
AGRICLUTRAL LAND 916.98 866.35
WASTE LAND 18.87 145.70
BUILT-UP LAND 41.36 68.13
FOREST LAND 51.88 32.87
WATER BODY 13.62 44.00
International Journal of Research (IJR) Vol-1, Issue-8, September2014 ISSN 2348-6848
Figure 5. Land Use Land Cover Map of 1998 year
International Journal of Research (IJR) Vol-1, Issue-8, September2014 ISSN 2348-6848
Change Detection in Land use / Land cover in Akola Taluka Using Remote Sensing and GIS References
1. Anderson J R, Hardy E, Roach J T and
Wiremer R E (1976). A landuse and
landcover classification system for use
with remote sensing data. Professional
paper No.964 USGS. Reston Verginia,
pp.28
2. Arvind C. Pandy and M. S. Nathawat
(2006). Land Use Land Cover
Mapping Through Digital Image
Processing of Satellite Data – A case
study from Panchkula, Ambala and
Yamunanagar Districts, Haryana
State, India.
3. Dabbs, D.L. and Gentle, G.C., (1974).
Landscape classification and plan
succession Trends in Peace Athabasca
Delta Can. Wildlife Service Rep. SER: pp
32-34.
4. Daniel, et al, (2002) A comparisons of
Landuse and Landcover Change
Detection Methods.ASPRS-ACSM
Annual Conference and FIG XXII
Congress pg.2.
5. District resource map, Geological Survey
of India, Central Region , Sehore.
6. District Statistical Handbooks of Sehore
(2002 to 2007).
7. Gautam N C & E R Narayanan
(1983). Satellite remote sensing
techniques for natural resources
survey, In Environmental
Management, edited by L R Singh,
Savindra Singh, R C Tiwari and R P
Srivastava (Allahabad geophysical
society), pp 177-181.
8. Gautam, N.C., and Narayan, L.R.A.,
(1983). Landsat MSS data for land
use/land cover inventory and mapping – a
case study of Andhra Pradesh, J. Indian
Soc. Remote Sensing, 11(3), pp 15-28.
9. Jaiswal RK, Saxena R and Mukherjee
S (1999) Application of Remote
Sensing Technology for Landuse /
Landcover change analysis. J. Indian
Soc. Remote Sensing 27(2),pp
123-128
10. Mas, J.F., (1999), “Monitoring Land
Cover Changes: A Comparison of
Change Detection Techniques”,
International Journal of Remote
Sensing, 20(1), 139152.
11. Minakshi,R Chaursia and P K Sharma
(1999). Landuse / Landcover Maping
and Change Detection Using Satellite
Data – A Case Study of Dehlon Block,
District Ludhiana, Punjab, J. Indian
Soc. Remote Sensing 27(2): 115-121.
12. National Remote Sensing Agency /
Project Report, (2006), “National
Land Use And Land Cover Mapping
Using Multitemporal Awifs Data”
13. Chaitanya Pande and Kanak N.
Moharir(2014), “Analysis of Land
Use/Land Cover Changes Using
Remote Sensing Data and GIS
Techniques of Patur Taluka,